46 Telluride Dr · Fountain Inn, SC
Flood risk 1/10 · Minimal
- FEMA flood zone
- X (unshaded)
- Chance of flooding over 30 yrs
- 0.0%
- Est. flood insurance / yr
- $473 – $860
Fire risk 4/10 · Minor
- Est. fire insurance / yr
- $783 – $1,453
Heat risk 5/10 · Moderate
- Hot days now (above 104°F)
- 7 days/yr
- Hot days in 30 yrs
- 17 days/yr
Wind risk 2/10 · Minimal
- Chance of severe wind over 30 yrs
- 2.0%
Air-quality risk 4/10 · Minor
- Unhealthy air days now
- 3 days/yr
- Unhealthy air days in 30 yrs
- 4 days/yr
Risk factors via First Street. Map © Google.
Why this score? — see what drove the D grade
The composite is a weighted blend of 9 inputs, each scored 0–100. Each bar is that input's sub-score; the figure is the points it added to the 100-point composite (weight × sub-score).
- Cash flow +11.8/30.0
- ARV discount +7.5/15.0
- Schools +4.2/10.0
- Livability +4.1/5.0
- 1% rule +4.0/10.0
- Condition / age +4.0/5.0
- DSCR +3.5/10.0
- Rent growth +3.2/5.0
- Appreciation +0.0/10.0
$232,900
🖨 Deal sheet (PDF) 📄 Offer letter ✓ Due diligence
Listing remarks
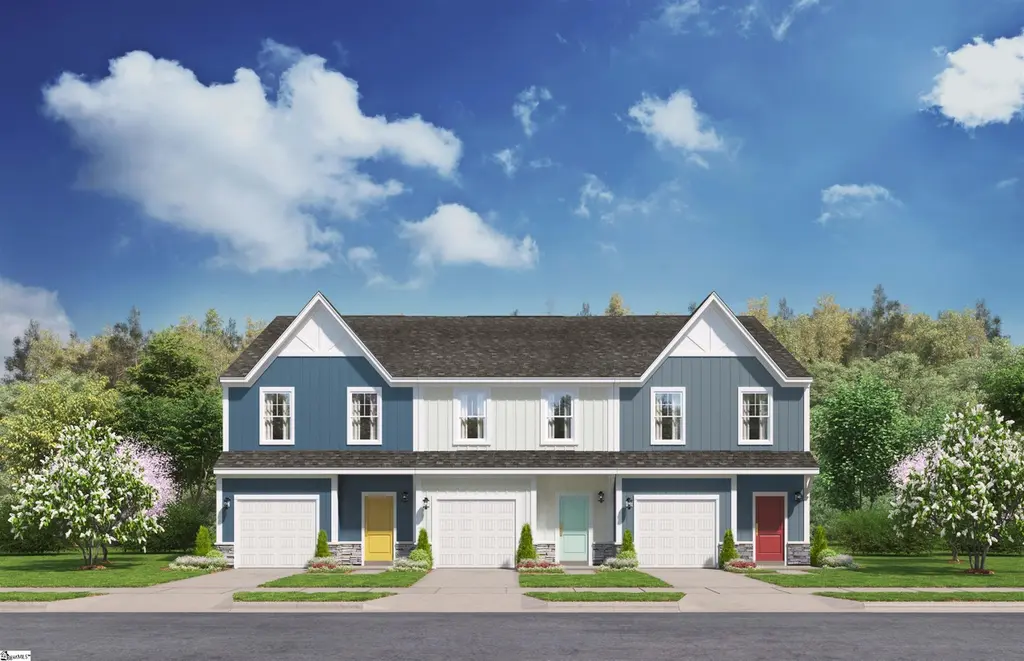
Welcome to the Amara floor plan at Fairview Terrace! This beautifully designed 3-bedroom, 2.5-bath end unit townhome is ideally located just off Fairview Road in Simpsonville. The main level offers an inviting open-concept layout featuring a cozy living room, a spacious kitchen with all appliances included, and a designated dining area that opens to a private back patio—perfect for relaxing or entertaining. A convenient half bath and entry hall closet complete the downstairs for added everyday convenience. Upstairs, you’ll find a generous primary suite with a full bathroom and walk-in closet, two additional bedrooms, a shared hallway bath, and a walk-in laundry room to make dail
Key facts
- Walk-in closet
- On-site dog park
- Private back patio
Tags
Property features AI
Finance
- HOA & community: Homeowners association; HOA covers exterior maintenance and lawn maintenance; Community offers common areas, lawn maintenance, and a dog park
Exterior
- Parking: Attached 1-car garage; Paved concrete driveway
- Utilities: Public water; Gas water heater; Public sewer; Private garbage pickup
- Home design: Two-story home; Model: Amara; New construction (2026); New/Never lived in
- Construction: Vinyl siding exterior; Architectural roof; Slab foundation; Built by Stanley Martin Homes
- Exterior features: Patio; Level lot; Common areas and dog park in the community
Interior
- Kitchen: Dishwasher; Disposal; Stand-alone gas range; Refrigerator; Pantry
- Bedrooms: Primary bedroom on second level with walk-in closet, shower-only bath, and double sink; Second bedroom approximately 12 x 9; Third bedroom approximately 12 x 10; Primary bedroom approximately 14 x 14
- Flooring: Carpet; Luxury vinyl tile/plank
- Bathrooms: Two full bathrooms; One half bathroom
- Heating & cooling: Natural gas heating; Central electric forced cooling
- Interior features: Open floor plan; 9-foot+ smooth ceilings; Cable available; Walk-in closet; Pantry/closet
- Laundry & utility: Washer and dryer included; Second-floor walk-in laundry
Neighborhood map
What this means for you Summary
Snapshot
- This is a 3-bed/2.5-bath townhouse listed at $233k. Condition is rated good.
Deal economics
- At list price, monthly cash flow is $-63 ($-754/yr) — negative.
- To cash-flow at today's rent, offer at most $224k (3.9% below list).
- To meet the 1% rule (rent ≥ 1% of price), the offer needs to be $210k (10.0% below list).
- Recommended offer: $210k (10.0% below list) — sets the bar for 1% rule.
- Cap rate 6.0% vs local median 4.1% in Fountain Inn — top-decile yield for the area; either an underpriced asset or a hidden risk that comps aren't pricing in. Stress-test before assuming the spread holds.
Location & tenants
- Location reads 82/100 on livability (#4 in SC, #1,162 nationally) — a professional / high-income tenant draw. Strengths: crime A+, cost of living A+, housing A+; Watch: commute F.
- Greenville 01 (suburban): math 44% / reading 54% proficiency, ranked #10 of 80 in SC (top 12%) — families likely to look elsewhere, expect single-tenant / working-renter base with shorter leases.
- Zoned schools: Fork Shoals School (math 47% / reading 52%, grade D, #168 of 597 statewide, top 31%, 792 students, 58% FRL) — zoned schools average 58% FRL vs 42% district-wide (16 pts higher); higher-poverty schools than district average — tighter screening recommended.
- Market conditions: Rents rising (+2.9%/yr); 244 active listings in the ZIP; 2 comparable units currently listed for rent nearby; solid renter incomes; 5,595 units permitted in Greenville County in 2024 (566 in 5+ unit buildings).
Forward outlook
- Local home prices are declining (-3.0%/yr); year-one equity from $2k of loan paydown is wiped out by about $7k of value loss. Plan a longer hold.
- Greenville County population projected at +34% by 2050 — long-run rental-demand tailwind backs the buy-and-hold thesis.
Negotiation context
- It's been on market 55 days — a 3% lower offer ($226k) is reasonable based on typical stale-listing flexibility.
Risks & watch-outs
- Climate carrying-cost: extreme-heat days projected 7→17/yr by 2055 (HVAC capex compounding) — expect insurance premiums to compound above CPI over the hold.
Questions for the listing agent
- What do current leases actually rent for vs. the listed asking? Can we see a recent rent roll and the last 12 months of T-12 income?
- It's been on market 55 days. Have you received any prior offers? Is the seller open to a 10% concession, seller financing, or rate buy-down credit?
- What does the HOA fee cover, when was the last increase, and are there any pending special assessments or reserve-fund shortfalls?
- Is there a deadline driving the sale (1031 exchange, divorce, estate, relocation)? That informs how much negotiation room exists.
- The area grade is low — what's the realistic commute time and amenity access for the typical tenant pool here? Any planned neighborhood developments (good or bad) we should know about?
- What's the average days-on-market for RENTAL listings here right now (not sales)? A rising rental-DOM trend means longer vacancies and softer asking-rent achievability than the comps imply.
- What's the recent tenant-quality profile in this submarket — average credit score on applications, eviction rate, late-payment / NSF rate, and stable-employment percentage? A property-management company in the area should have these aggregated.
- How much new for-sale + rental construction is in the pipeline within 1–3 miles? Heavy new supply typically softens prices + rents 12–24 months out; constrained supply supports both.
Investment metrics
- 1% rule
- 0.90% ✗
- Cap rate
- 5.97%
- Cash-on-cash
- -1.16%
- DSCR
- 0.95
- GRM
- 9.3
CMA / ARV
No comps found within radius.
Projected returns pro-forma
-3.0% appreciation · 2.85% rent growth · sell at horizon
- IRR
- -18.3%
- Equity multiple
- 0.36×
- Total profit
- $-41,956
- Equity at exit
- $34,726
- IRR
- -10.9%
- Equity multiple
- 0.35×
- Total profit
- $-42,574
- Equity at exit
- $20,137
Cash invested: $65,212 (down + closing). Projections, not guarantees.
Landlord ↔ Tenant lean methodology
- Overall (STATE)
- 90 Strongly Landlord-Friendly
- State South Carolina
- 90 Strongly Landlord-Friendly · R+6
- County
- — inherits STATE
- City
- — inherits STATE
ZIP-level market 29680
- Home prices YoY
- -31.2%
- Rents YoY
- 2.9%
- Active inventory
- 244
- Price-to-rent
- 9.3×
Monthly cashflow live
- Estimated rent
- $2,097 medium interval (Pro) →
- Mortgage (P&I)
- −$1,221
- Tax est. 1.5%
- −$291 /mo · $3,494/yr
- Insurance
- −$97
- HOA
- −$110
- Vacancy / Maint / Mgmt
- −$440
- Net cashflow
- $-63
Break-even live
Sensitivity live
| Price | -10% $98 | -5% $18 | +0% $-63 | +5% $-143 | +10% $-224 |
|---|---|---|---|---|---|
| Rent | -10% $-228 | -5% $-146 | +0% $-63 | +5% $20 | +10% $103 |
| Rate | -1.0pp $54 | -0.5pp $-4 | base $-63 | +0.5pp $-123 | +1.0pp $-185 |
UW: 25.0% down · 7.5% · 30yr · 1.5% tax · 5.0% vac · 8.0% maint · 8.0% mgmt
Financing live
Cash to close
- Down payment
- $58,225
- Closing costs
- $6,987
- Reserves months
- —
- Total cash needed
- —
Loan-product check · same deal, 3 products live
Conventional
25% down · 7.5% · 30yr
- Down + closing
- —
- Monthly P&I
- —
- Monthly cashflow
- —
- DSCR
- —
- Eligible?
- —
Personal DTI + credit; lowest rate.
DSCR
20% down · 8.5% · 30yr
- Down + closing
- —
- Monthly P&I
- —
- Monthly cashflow
- —
- DSCR
- —
- Eligible?
- —
No personal income docs; deal must DSCR.
Hard money
10% down · 12.0% · 12mo
- Down + closing
- —
- Monthly P&I
- —
- Monthly cashflow
- —
- DSCR
- —
- Eligible?
- —
Short-term bridge; refi at stabilization.
Rent comps 2 comps
| Address | Beds | Baths | Sqft | Rent | $/sqft | DOM | Units | Dist |
|---|---|---|---|---|---|---|---|---|
| 109 Crossview Dr Simpsonville, SC | 3.0 | 2.0 | 1431 | $1,906 | $1.33 | 13d | 1 | 1.04mi |
| 4 Rockshire Trl Fountain Inn, SC | 3.0 | 2.5 | 1400 | $1,900 | $1.36 | 25d | 1 | 1.19mi |
HOA detail
- Monthly dues
- $110 · $1,320/yr
Listing history 18 events
-
2026-06-22days on market $232,900 Active 55 DOM
-
2026-06-18days on market $232,900 Active 52 DOM
-
2026-06-17days on market $232,900 Active 51 DOM
-
2026-06-16days on market $232,900 Active 50 DOM
-
2026-06-15days on market $232,900 Active 49 DOM
-
2026-06-13days on market $232,900 Active 47 DOM
-
2026-06-13days on market $232,900 Active 46 DOM
-
2026-06-10days on market $232,900 Active 44 DOM
-
2026-06-09days on market $232,900 Active 43 DOM
-
2026-06-08days on market $232,900 Active 42 DOM
-
2026-06-07days on market $232,900 Active 41 DOM
-
2026-06-03days on market $232,900 Active 37 DOM
-
2026-06-03days on market $232,900 Active 36 DOM
-
2026-06-01days on market $232,900 Active 35 DOM
-
2026-05-31days on market $232,900 Active 34 DOM
-
2026-05-29price $232,900
-
2026-05-18price $236,900
-
2026-04-27$241,900 Active
ⓘ Source: listings_history table (triggers on properties + properties_extension) + one-shot
backfill from property_details.listing_events for pre-trigger history.
Climate risk First Street
- Flood 1/10 Low FEMA zone X (unshaded) · 0% chance over 30 yrs
- Wildfire 4/10 Moderate
- Heat 5/10 Major 7 d/yr ≥104°F today · 17 d/yr by 30 yrs out
- Wind 2/10 Low 2% chance of damaging wind over 30 yrs
- Air quality 4/10 Moderate 3 unhealthy d/yr today · 4 by 30 yrs out
Nearby sold comps map
Loading sold comps map…
Walkable amenities ~0.75 mi
Loading nearby amenities…
Taxation est. · year 1
- Rental income
- $25,165
- − Mortgage interest
- −$13,046
- − Property taxes
- −$3,494
- − Insurance
- −$1,164
- − Repairs & maintenance
- −$2,013
- − Management
- −$2,013
- − HOA
- −$1,320
- − Depreciation
- −$6,775
- Taxable loss
- −$4,660
- Est. tax savings @ 24.0%
- +$1,118
- After-tax cash flow
- $365/yr
For passive investors: Depreciation is non-cash, so a rental often shows a tax loss while cash-flowing — sheltering income. Rental losses are passive: they offset passive income freely, and up to $25,000/yr can offset ordinary (W-2) income if you actively participate and your MAGI is under $100k (phasing out to $0 by $150k); unused losses carry forward. On sale, claimed depreciation is recaptured at up to 25%, and gains may owe capital-gains tax (a 1031 exchange can defer both). Figures are a year-1 estimate at your 24.0% rate — not tax advice; consult a CPA.
Condition & rehab AI · 6 photos
This well-maintained and modern townhome is move-in ready with a good condition score and minimal repairs needed. It offers a good ROI with updates that can further enhance its value.
Value-add opportunities
- Both Painting the interior walls — Fresh paint can enhance the home's curb appeal and interior aesthetics.
- Both Landscaping the front yard — A well-maintained front yard can improve the home's curb appeal and attract potential buyers/tenants.
- Both Adding smart home features — Smart home features can increase the home's value and appeal to tech-savvy buyers/tenants.
- Both Upgrading the flooring in the bathrooms — Upgrading the flooring in the bathrooms can improve the home's overall appearance and functionality.
Renovation cost estimate screening
Value-add ROI direction
- Both Painting the interior walls — Fresh paint can enhance the home's curb appeal and interior aesthetics. ↑
- Both Landscaping the front yard — A well-maintained front yard can improve the home's curb appeal and attract potential buyers/tenants. ↑
- Both Adding smart home features — Smart home features can increase the home's value and appeal to tech-savvy buyers/tenants. ↑
- Both Upgrading the flooring in the bathrooms — Upgrading the flooring in the bathrooms can improve the home's overall appearance and functionality. ↑
ⓘ Cost ranges are severity-bucket heuristics (US national rule-of-thumb). Get contractor quotes + a written scope before underwriting a rehab budget.
Schools (NCES district)
- District
- Greenville 01
- NCES district ID
- 4502310
- Math proficiency
- 44% ▼ -10.00%
- Reading proficiency
- 54% ▼ -2.00%
- Median HH income
- $49,596
- Composite
- 41.88/100
- National rank
- #3370
- State rank
- #10 of 80 in SC
Livability — Fountain Inn
- Score
- 82/100
- State rank
- #4
- US rank
- #1162
Category grades
Schools grade is shown separately in the Schools card above.
Census & demographics
- County
- Greenville County · 573,815 people
- City population
- 22,907
- Metro
- Greenville-Anderson, SC
- Population (ZIP)
- 35,770
- Household income
- $86,716
- Rent vs Own
- Severe rent burden
- 553.0
Population outlook (Greenville County) Hauer SSP2
- Today (2025)
- 574,580 people
- By 2030
- 615,615 · +7.1%
- By 2040
- 695,373 · +21.0%
- By 2050
- 769,367 · +33.9%
- By 2075
- 933,296 · +62.4%
- By 2100
- 1,029,196 · +79.1%
Race, ethnicity, and origin ACS 2023
- Neighborhood character
- Diverse neighborhood (Simpson 0.60)
- Race & ethnicity
- White 57% Black 24% Two or more races 10% Hispanic / Latino 9% Asian 2%
- Hispanic origin (detail)
- Mexican 2% Puerto Rican 2%
- Common ancestry
- Lithuanian 2% Slovak 2% Italian 2%
- Foreign-born
- 8% · Canada, Jamaica
- Languages at home
- 89% English-only · Spanish 7% French/Haitian/Cajun 1% Other Indo-European 1%
Political lean MEDSL · Greenville
- 2024 margin
- Strong R (+22.2) · D 38.0% · R 60.2% · Other 1.8%
- 2008→2024 swing
- +1.7pp toward D · 2008: -23.9pp · 2024: -22.2pp
- All cycles
- 2024: R+22.2 2020: R+18.2 2016: R+24.7 2012: R+27.8 2008: R+23.9
Not yet ingested
- Civics
- —
Market trends
- HPI YoY
- ▼ -102.15%
- Current HPI
- 224.9051
- Rent YoY
- ▲ 2.85%
- Metro
- Greenville-Anderson, SC
- State GDP YoY
- ▲ 4.51%
- F500 in state
- 2
Industry mix (Fortune 500 HQ in SC)
| Industry | F500 HQs | Revenue |
|---|---|---|
| Packaging | 1 | $7B |
|
||
Price history
-3.7% since first listed3 events — show timeline
- 2026-05-29 Price Changed $232,900 Greater Greenville MLS
- 2026-05-18 Price Changed $236,900 Greater Greenville MLS
- 2026-04-27 Listed $241,900 Greater Greenville MLS
Cash-flow waterfall
monthlySold comps — $/sqft
last 12 mo · ≤1 miLoading sold comps…