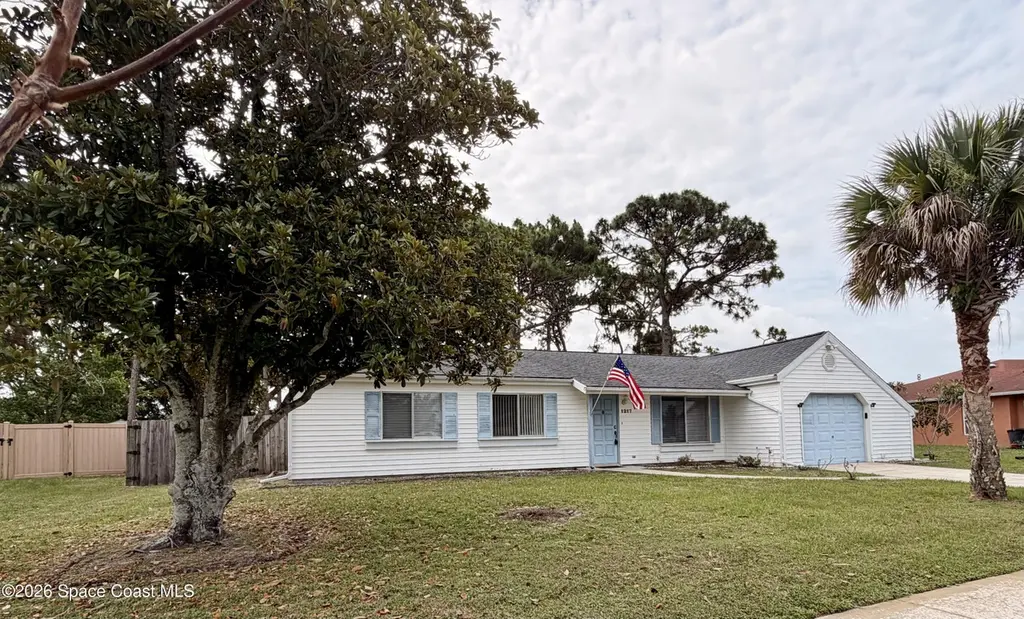
1217 Ethel Cir NE · Palm Bay, FL
Flood risk 1/10 · Minimal
- FEMA flood zone
- X (unshaded)
- Chance of flooding over 30 yrs
- 0.0%
- Est. flood insurance / yr
- $507 – $1,088
Fire risk 1/10 · Minimal
- Est. fire insurance / yr
- $947 – $1,759
Heat risk 10/10 · Severe
- Hot days now (above 105°F)
- 7 days/yr
- Hot days in 30 yrs
- 22 days/yr
Wind risk 10/10 · Severe
- Chance of severe wind over 30 yrs
- 99.0%
Air-quality risk 1/10 · Minimal
- Unhealthy air days now
- 0 days/yr
- Unhealthy air days in 30 yrs
- 0 days/yr
Risk factors via First Street. Map © Google.
Why this score? — see what drove the D grade
The composite is a weighted blend of 9 inputs, each scored 0–100. Each bar is that input's sub-score; the figure is the points it added to the 100-point composite (weight × sub-score).
- Cash flow +11.9/30.0
- ARV discount +7.5/15.0
- Schools +4.7/10.0
- Livability +3.6/5.0
- DSCR +3.5/10.0
- 1% rule +2.5/10.0
- Condition / age +2.5/5.0
- Rent growth +2.4/5.0
- Appreciation +2.2/10.0
$249,999
🖨 Deal sheet (PDF) 📄 Offer letter ✓ Due diligence
Listing remarks MLS
Home has been well cared for and maintained. Ready to move in condition. New A/C, New Hot Water Heater, New Refrigerator. Large Kitchen with breakfast bar and family room/den in addition to living room. Spacious and private back yard. Utility shed with ramp. Won't last at this price!
Key facts
- Storage shed
- Brand-new roof
- Large open space
Tags
Property features AI
Exterior
- Parking: Garage with garage door opener (1 vehicle); Off-street parking; RV access/parking
- Utilities: Public sewer; Water connected; Electricity connected; Sewer connected; Cable available
- Home design: Single family residence; Faces northwest
- Construction: Aluminum siding; Vinyl siding; Frame construction; Shingle roof
- Exterior features: Cleared lot; Paved city street frontage; Shed(s)
Interior
- Kitchen: Dishwasher; Electric range; Refrigerator
- Bedrooms: 3 bedrooms
- Flooring: Carpet; Laminate; Other
- Bathrooms: 2 full bathrooms
- Heating & cooling: Central heating (electric); Central air (electric)
- Interior features: Eat-in kitchen
- Laundry & utility: Washer hookup; Electric dryer hookup; Laundry in garage
Neighborhood map
What this means for you Summary
Snapshot
- This is a 3-bed/2.0-bath single-family listed at $250k.
Deal economics
- At list price, monthly cash flow is $-64 ($-765/yr) — negative.
- To cash-flow at today's rent, offer at most $239k (4.5% below list).
- To meet the 1% rule (rent ≥ 1% of price), the offer needs to be $186k (25.5% below list).
- Recommended offer: $186k (25.5% below list) — sets the bar for 1% rule.
Location & tenants
- Location reads 72/100 on livability (#366 in FL) — a middle-class / working-renter tenant base. Strengths: cost of living A+, housing A+; Watch: employment D+, amenities F, health & safety D-.
- Brevard (suburban): math 53% / reading 57% proficiency, ranked #19 of 73 in FL (top 26%) — acceptable for families but not a draw, mixed tenant base, ~2y average lease.
- Zoned schools: Riviera Elementary School (math 56% / reading 48%, grade C-, #990 of 2,144 statewide, top 48%, 696 students, 72% FRL); Stone Magnet Middle School (math 33% / reading 35%, grade F, #426 of 571 statewide, top 75%, 670 students, 69% FRL); Palm Bay Magnet Senior High School (math 25% / reading 37%, grade F, #429 of 667 statewide, top 65%, 1,486 students, 63% FRL) — zoned schools average 68% FRL vs 43% district-wide (25 pts higher); higher-poverty schools than district average — tighter screening recommended.
- Zoned-school proficiency averages 39% at this address vs 55% district-wide (-16 pts) — the specific schools serving this property underperform the Brevard average; the district grade overstates school quality for this exact location.
- Market conditions: Rents soft (-0.5%/yr); 321 active listings in the ZIP; 40 comparable units currently listed for rent nearby; rentals at typical pace (median 25d on market — plan ~3-4 weeks tenant-placement turnaround); 4,602 units permitted in Brevard County in 2024 (702 in 5+ unit buildings).
- This rent runs 40% of the median local income ($56k/yr) — at the standard rent-burdened threshold; future hikes will face affordability resistance.
Forward outlook
- Local home prices are declining (-3.0%/yr); year-one equity from $2k of loan paydown is wiped out by about $8k of value loss. Plan a longer hold.
- Brevard County population projected at +15% by 2050 — modest demand growth; plan on rents tracking national, not racing it.
Negotiation context
- It's been on market 17 days — a 2% lower offer ($246k) is reasonable based on typical stale-listing flexibility.
- 3 sale attempts since 13y ago with the ask held roughly flat each time — persistent listings suggest the price (not the market) is what's stuck; bring a comps-based counter.
- Current owner paid $115k; list at $250k implies a 117% gain — meaningful room to come down on a strong offer.
Risks & watch-outs
- Climate carrying-cost: severe wind risk, 99% chance of damaging wind over 30y; extreme-heat days projected 7→22/yr by 2055 (HVAC capex compounding) — expect insurance premiums to compound above CPI over the hold.
Questions for the listing agent
- What do current leases actually rent for vs. the listed asking? Can we see a recent rent roll and the last 12 months of T-12 income?
- Built in 1977 — when were the roof, HVAC, electrical panel, plumbing, and water heater last replaced?
- Is there a deadline driving the sale (1031 exchange, divorce, estate, relocation)? That informs how much negotiation room exists.
- The area grade is low — what's the realistic commute time and amenity access for the typical tenant pool here? Any planned neighborhood developments (good or bad) we should know about?
- What's the average days-on-market for RENTAL listings here right now (not sales)? A rising rental-DOM trend means longer vacancies and softer asking-rent achievability than the comps imply.
- What's the recent tenant-quality profile in this submarket — average credit score on applications, eviction rate, late-payment / NSF rate, and stable-employment percentage? A property-management company in the area should have these aggregated.
- How much new for-sale + rental construction is in the pipeline within 1–3 miles? Heavy new supply typically softens prices + rents 12–24 months out; constrained supply supports both.
Investment metrics
- 1% rule
- 0.75% ✗
- Cap rate
- 5.99%
- Cash-on-cash
- -1.09%
- DSCR
- 0.95
- GRM
- 11.2
CMA / ARV
No comps found within radius.
Projected returns pro-forma
-3.0% appreciation · 0.0% rent growth · sell at horizon
- IRR
- -21.2%
- Equity multiple
- 0.28×
- Total profit
- $-50,123
- Equity at exit
- $37,276
- IRR
- -22.5%
- Equity multiple
- -0.00×
- Total profit
- $-70,346
- Equity at exit
- $21,615
Cash invested: $70,000 (down + closing). Projections, not guarantees.
Landlord ↔ Tenant lean methodology
- Overall (STATE)
- 87 Strongly Landlord-Friendly
- State Florida
- 87 Strongly Landlord-Friendly · R+3
- County
- — inherits STATE
- City
- — inherits STATE
ZIP-level market 32905
- Home prices YoY
- -1.8%
- Rents YoY
- -0.5%
- Active inventory
- 321
- Price-to-rent
- 11.2×
Monthly cashflow live
- Estimated rent
- $1,863 high interval (Pro) →
- Mortgage (P&I)
- −$1,311
- Tax from tax record
- −$121 /mo · $1,449/yr
- Insurance
- −$104
- HOA
- −$0
- Vacancy / Maint / Mgmt
- −$391
- Net cashflow
- $-64
Break-even live
Sensitivity live
| Price | -10% $78 | -5% $7 | +0% $-64 | +5% $-135 | +10% $-205 |
|---|---|---|---|---|---|
| Rent | -10% $-211 | -5% $-137 | +0% $-64 | +5% $10 | +10% $83 |
| Rate | -1.0pp $62 | -0.5pp $0 | base $-64 | +0.5pp $-129 | +1.0pp $-194 |
UW: 25.0% down · 7.5% · 30yr · 1.5% tax · 5.0% vac · 8.0% maint · 8.0% mgmt
Financing live
Cash to close
- Down payment
- $62,500
- Closing costs
- $7,500
- Reserves months
- —
- Total cash needed
- —
Loan-product check · same deal, 3 products live
Conventional
25% down · 7.5% · 30yr
- Down + closing
- —
- Monthly P&I
- —
- Monthly cashflow
- —
- DSCR
- —
- Eligible?
- —
Personal DTI + credit; lowest rate.
DSCR
20% down · 8.5% · 30yr
- Down + closing
- —
- Monthly P&I
- —
- Monthly cashflow
- —
- DSCR
- —
- Eligible?
- —
No personal income docs; deal must DSCR.
Hard money
10% down · 12.0% · 12mo
- Down + closing
- —
- Monthly P&I
- —
- Monthly cashflow
- —
- DSCR
- —
- Eligible?
- —
Short-term bridge; refi at stabilization.
Rent comps 40 comps
| Address | Beds | Baths | Sqft | Rent | $/sqft | DOM | Units | Dist |
|---|---|---|---|---|---|---|---|---|
| 1265 Ethel Cir NE Palm Bay, FL | 3.0 | 2.0 | 1346 | $1,750 | $1.30 | 15d | 1 | 0.08mi |
| 1264 Dawn St NE Palm Bay, FL | 3.0 | 2.0 | 1176 | $1,950 | $1.66 | 15d | 1 | 0.10mi |
| 1701 Forest Knoll Dr NE Palm Bay, FL | 2.0–3.0 | 2.0 | 1200 | $2,050 | $1.71 | 15d | 5 | 0.13mi |
| 2190 Forest Knoll Dr NE Unit 90-202 Palm Bay, FL | 2.0 | 2.0 | 1069 | $1,400 | $1.31 | 25d | 1 | 0.13mi |
| 2160 Forest Knoll Dr NE Unit 60-102 Palm Bay, FL | 2.0 | 2.0 | 1069 | $1,350 | $1.26 | 25d | 1 | 0.15mi |
| 2130 Forest Knoll Dr NE #202 Palm Bay, FL | 2.0 | 2.0 | 1069 | $1,450 | $1.36 | 25d | 1 | 0.17mi |
| 2100 Forest Knoll Dr NE #202 Palm Bay, FL | 2.0 | 2.0 | 1069 | $1,600 | $1.50 | 15d | 1 | 0.20mi |
| 3814 Tree Ridge Ln NE Palm Bay, FL | 2.0 | 2.5 | 1170 | $1,500 | $1.28 | 25d | 1 | 0.24mi |
| 1625 Sunny Brook Ln NE Unit G103 Palm Bay, FL | 3.0 | 2.0 | 914 | $1,700 | $1.86 | 25d | 1 | 0.28mi |
| 1000 Palm Place Dr NE Palm Bay, FL | 1.0–2.0 | 1.0–2.0 | 884 | $2,185 | $2.47 | 22d | 8 | 0.28mi |
| 3513 Tree Ridge Ln NE Palm Bay, FL | 2.0 | 2.5 | 1170 | $2,000 | $1.71 | 25d | 1 | 0.29mi |
| 1608 Sunny Brook Ln Palm Bay, FL | 1.0–3.0 | 1.0–2.0 | 1040 | $1,600 | $1.54 | 25d | 6 | 0.36mi |
| 1497 Krin Ct NE Palm Bay, FL | 3.0 | 2.0 | 1712 | $2,400 | $1.40 | 22d | 1 | 0.37mi |
| 1656 Sunny Brook Ln NE Unit L102 Palm Bay, FL | 3.0 | 2.0 | 914 | $1,690 | $1.85 | 22d | 1 | 0.45mi |
| 1625 Par St NE Unit 1104 Palm Bay, FL | 2.0 | 2.0 | 1025 | $2,100 | $2.05 | 25d | 1 | 0.55mi |
| 1625 Par St NE Unit 1107 Palm Bay, FL | 2.0 | 2.0 | 1025 | $1,875 | $1.83 | 25d | 1 | 0.55mi |
| 1625 Par St NE Unit 1206 Palm Bay, FL | 3.0 | 2.0 | 1208 | $2,050 | $1.70 | 25d | 1 | 0.55mi |
| 1625 Par St NE Unit 1207 Palm Bay, FL | 3.0 | 2.0 | 1208 | $2,025 | $1.68 | 25d | 1 | 0.55mi |
| 1605 Par St NE Unit 3204 Palm Bay, FL | 3.0 | 2.0 | 1208 | $2,000 | $1.66 | 25d | 1 | 0.58mi |
| 1605 Par St NE Unit 3102 Palm Bay, FL | 2.0 | 2.0 | 1025 | $2,100 | $2.05 | 25d | 1 | 0.58mi |
| 1605 Par St NE Unit 3202 Palm Bay, FL | 3.0 | 2.0 | 1208 | $2,300 | $1.90 | 25d | 1 | 0.58mi |
| 1635 Par St NE Unit 2103 Palm Bay, FL | 2.0 | 2.0 | 1025 | $2,100 | $2.05 | 25d | 1 | 0.60mi |
| 1635 Par St NE Unit 2203 Palm Bay, FL | 3.0 | 2.0 | 1208 | $2,300 | $1.90 | 25d | 1 | 0.60mi |
| 1625 Par St NE Unit 1203 Palm Bay, FL | 3.0 | 2.0 | 1208 | $2,075 | $1.72 | 25d | 1 | 0.60mi |
| 1625 Par St NE Unit 1205 Palm Bay, FL | 3.0 | 2.0 | 1208 | $2,300 | $1.90 | 25d | 1 | 0.60mi |
| 1687 Avery Rd NE Palm Bay, FL | 2.0 | 2.0 | 876 | $1,800 | $2.05 | 25d | 1 | 0.61mi |
| 1327 Cherry Hills Rd NE Palm Bay, FL | 3.0 | 2.0 | 1706 | $2,800 | $1.64 | 15d | 1 | 0.70mi |
| 188 Hidden Woods Pl Melbourne, FL | 3.0 | 2.5 | 1648 | $2,100 | $1.27 | 25d | 1 | 0.72mi |
| 1501 Harvard Cir Melbourne, FL | 1.0–3.0 | 1.0–2.0 | 1075 | $2,000 | $1.86 | 25d | 3 | 0.73mi |
| 1300 Arlington Ln NE #125 Palm Bay, FL | 2.0 | 2.5 | 1140 | $1,500 | $1.32 | 20d | 1 | 0.74mi |
| 917 Castleford Ave NE Palm Bay, FL | 3.0 | 2.0 | 1604 | $2,150 | $1.34 | 25d | 1 | 0.77mi |
| 3016 Pinewood Dr NE Palm Bay, FL | 1.0–2.0 | 1.0 | 800 | $1,103 | $1.38 | 25d | 1 | 0.82mi |
| 1907 Cleveland St NE Palm Bay, FL | 3.0 | 2.0 | 1320 | $1,985 | $1.50 | 25d | 1 | 0.88mi |
| 1245 Palm Bay Rd Palm Bay, FL | 1.0–2.0 | 1.0–2.0 | 807 | $1,425 | $1.76 | 25d | 6 | 0.89mi |
| 890 Luminary Cir #103 Melbourne, FL | 3.0 | 2.0 | 1277 | $1,800 | $1.41 | 15d | 1 | 0.89mi |
| 4001 Pinewood Dr NE Palm Bay, FL | 2.0 | 2.0 | 1036 | $1,269 | $1.22 | 25d | 5 | 0.90mi |
| 2106 Tarrytown Ln NE Palm Bay, FL | 3.0 | 2.0 | 1281 | $1,900 | $1.48 | 15d | 1 | 0.93mi |
| 2152 Spring Creek Cir NE Palm Bay, FL | 3.0 | 2.0 | 1465 | $2,249 | $1.54 | 25d | 1 | 0.94mi |
| 1411 Sheafe Ave NE #102 Palm Bay, FL | 2.0 | 1.0 | 1156 | $1,550 | $1.34 | 25d | 1 | 0.94mi |
| 1880 Mogra Cir NE Palm Bay, FL | 2.0–3.0 | 2.0 | 1090 | $1,899 | $1.74 | 15d | 6 | 0.94mi |
Listing history 12 events
-
2026-06-18days on market $249,999 Active 17 DOM
-
2026-06-17days on market $249,999 Active 16 DOM
-
2026-06-16days on market $249,999 Active 15 DOM
-
2026-06-15days on market $249,999 Active 14 DOM
-
2026-06-14days on market $249,999 Active 12 DOM
-
2026-06-10days on market $249,999 Active 9 DOM
-
2026-06-08days on market $249,999 Active 7 DOM
-
2026-06-07days on market $249,999 Active 6 DOM
-
2026-06-05days on market $249,999 Active 3 DOM
-
2026-06-03days on market $249,999 Active 2 DOM
-
2026-06-01remarks 699-char remark
-
2026-06-01$249,999 Active 1 DOM
ⓘ Source: listings_history table (triggers on properties + properties_extension) + one-shot
backfill from property_details.listing_events for pre-trigger history.
Tax reassessment forecast FL · Resets to sale price
- Current annual tax
- $1,449 · $121/mo
- Projected year-2 tax
- $2,075 · $173/mo
- Expected delta
- +$626/yr (+$52/mo · 43.2%)
ⓘ Screening estimate from a state-policy table — verify with the county assessor before closing.
Climate risk First Street
- Flood 1/10 Low FEMA zone X (unshaded) · 0% chance over 30 yrs
- Wildfire 1/10 Low
- Heat 10/10 Extreme 7 d/yr ≥105°F today · 22 d/yr by 30 yrs out
- Wind 10/10 Extreme 99% chance of damaging wind over 30 yrs
- Air quality 1/10 Low 0 unhealthy d/yr today · 0 by 30 yrs out
Nearby sold comps map
Loading sold comps map…
Walkable amenities ~0.75 mi
Loading nearby amenities…
Taxation est. · year 1
- Rental income
- $22,362
- − Mortgage interest
- −$14,004
- − Property taxes
- −$1,449
- − Insurance
- −$1,250
- − Repairs & maintenance
- −$1,789
- − Management
- −$1,789
- − Depreciation
- −$7,273
- Taxable loss
- −$5,191
- Est. tax savings @ 24.0%
- +$1,246
- After-tax cash flow
- $481/yr
For passive investors: Depreciation is non-cash, so a rental often shows a tax loss while cash-flowing — sheltering income. Rental losses are passive: they offset passive income freely, and up to $25,000/yr can offset ordinary (W-2) income if you actively participate and your MAGI is under $100k (phasing out to $0 by $150k); unused losses carry forward. On sale, claimed depreciation is recaptured at up to 25%, and gains may owe capital-gains tax (a 1031 exchange can defer both). Figures are a year-1 estimate at your 24.0% rate — not tax advice; consult a CPA.
Schools (NCES district)
- District
- Brevard
- NCES district ID
- 1200150
- Math proficiency
- 53% ▼ -9.00%
- Reading proficiency
- 57% ▼ -4.00%
- Median HH income
- $49,426
- Composite
- 46.86/100
- National rank
- #2370
- State rank
- #19 of 73 in FL
Livability — Palm Bay
- Score
- 72/100
- State rank
- #366
- US rank
- #6458
Category grades
Schools grade is shown separately in the Schools card above.
Census & demographics
- Census place
- Palm Bay, FL
- County
- Brevard County · 602,871 people
- City population
- 132,211
- Metro
- Palm Bay-Melbourne-Titusville, FL
- Population (ZIP)
- 24,792
- Household income
- $56,411
- Rent vs Own
- Severe rent burden
- 1962.0
Population outlook (Brevard County) Hauer SSP2
- Today (2025)
- 623,254 people
- By 2030
- 648,420 · +4.0%
- By 2040
- 690,009 · +10.7%
- By 2050
- 715,669 · +14.8%
- By 2075
- 775,744 · +24.5%
- By 2100
- 776,687 · +24.6%
Race, ethnicity, and origin ACS 2023
- Neighborhood character
- Diverse neighborhood (Simpson 0.57)
- Race & ethnicity
- White 61% Hispanic / Latino 16% Black 16% Two or more races 11% Asian 2%
- Hispanic origin (detail)
- Mexican 1% Puerto Rican 4% Cuban 4%
- Common ancestry
- Romanian 2% Hispanic 2% Slovak 2%
- Foreign-born
- 13% · Canada, Jamaica
- Languages at home
- 83% English-only · Spanish 12% French/Haitian/Cajun 2% Other Indo-European 2%
Political lean MEDSL · Brevard
- 2024 margin
- Strong R (+20.8) · D 39.1% · R 59.9% · Other 1.0%
- 2008→2024 swing
- -10.4pp toward R · 2008: -10.4pp · 2024: -20.8pp
- All cycles
- 2024: R+20.8 2020: R+16.4 2016: R+19.8 2012: R+12.7 2008: R+10.4
Not yet ingested
- Civics
- —
Market trends
- HPI YoY
- ▼ -5.59%
- Current HPI
- 309.8748
- Rent YoY
- ▼ -0.52%
- Metro
- Palm Bay-Melbourne-Titusville, FL
- State GDP YoY
- ▲ 3.28%
- F500 in state
- 36
Industry mix (Fortune 500 HQ in FL)
| Industry | F500 HQs | Revenue |
|---|---|---|
| Industrial Technology | 2 | $29B |
|
||
| Insurance | 2 | $17B |
|
||
| Retail | 1 | $60B |
|
||
| Technology Distribution | 1 | $58B |
|
||
| Homebuilding | 1 | $35B |
|
||
| Technology Manufacturing | 1 | $35B |
|
||
Price history
+529.7% since first listed9 events — show timeline
- 2026-05-29 Listed $249,999 SCMLS
- 2017-03-01 Sold (Public Records) $115,000 Public Records
- 2017-02-17 Sold (MLS) $115,000 SCMLS
- 2017-01-27 Listed $119,000 SCMLS
- 2013-07-03 Sold (Public Records) $73,000 Public Records
- 2013-06-19 Sold (MLS) $73,000 SCMLS
- 2013-05-12 Listed $73,500 SCMLS
- 1996-08-30 Sold (Public Records) $60,000 Public Records
- 1977-09-01 Sold (Public Records) $39,700 Public Records
Property tax history
+8.9%/yrLatest (2025): $1,449 · +3.1% YoY. Source: county tax records.
Cash-flow waterfall
monthlySold comps — $/sqft
last 12 mo · ≤1 miLoading sold comps…