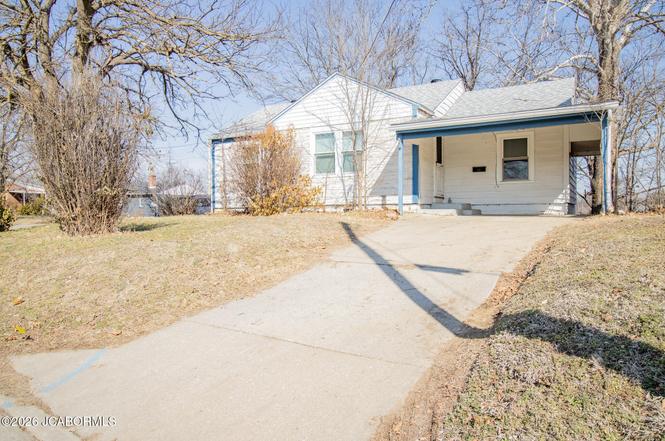
1510 St. Marys Blvd · Jefferson City, MO
Flood risk 1/10 · Minimal
- FEMA flood zone
- X (unshaded)
- Chance of flooding over 30 yrs
- 0.0%
- Est. flood insurance / yr
- $473 – $860
Fire risk 1/10 · Minimal
- Est. fire insurance / yr
- $1,054 – $1,958
Heat risk 4/10 · Minor
- Hot days now (above 106°F)
- 7 days/yr
- Hot days in 30 yrs
- 19 days/yr
Wind risk 2/10 · Minimal
- Chance of severe wind over 30 yrs
- —
Air-quality risk 2/10 · Minimal
- Unhealthy air days now
- 0 days/yr
- Unhealthy air days in 30 yrs
- 1 days/yr
Risk factors via First Street. Map © Google.
Why this score? — see what drove the C grade
The composite is a weighted blend of 9 inputs, each scored 0–100. Each bar is that input's sub-score; the figure is the points it added to the 100-point composite (weight × sub-score).
- Cash flow +18.3/30.0
- ARV discount +13.6/15.0
- DSCR +5.7/10.0
- Rent growth +5.0/5.0
- Livability +4.2/5.0
- 1% rule +3.9/10.0
- Schools +3.5/10.0
- Condition / age +2.5/5.0
- Appreciation +0.0/10.0
$160,000
🖨 Deal sheet (PDF) 📄 Offer letter ✓ Due diligence
Listing remarks MLS
Check out this opportunity in Jefferson City! This 3 bedroom, 1 bath home has been partially updated and is ready for you to finish it with your own style. You'll have extra room in the partial basement to finish or use for storage too! Located near Hwy 50 and Dix Road, this would be a great starter home or investment opportunity and has a nice back yard with wooden patio area for entertaining. Schedule your appointment today!
Key facts
- Large lot
- Built 1947
- Listed 115 days
Tags
Property features AI
Exterior
- Utilities: Public water; Public sewer
- Home design: Single-family residence; Residential property
- Construction: Above-grade finished area: 1,171
- Exterior features: Deck; Shed(s)
Interior
- Kitchen: Dishwasher; Range; Range hood; Refrigerator
- Flooring: Wood flooring
- Bathrooms: 1 full bathroom
- Heating & cooling: Natural gas heating; Central cooling
- Interior features: Pantry; Walk-out/partial basement with crawl space
- Laundry & utility: Main-level laundry
Neighborhood map
What this means for you Summary
Snapshot
- This is a 3-bed/1.0-bath single-family listed at $160k.
Deal economics
- At list price, monthly cash flow is $146 ($2k/yr) — positive.
- The deal already cash-flows at list — no discount required.
- To meet the 1% rule (rent ≥ 1% of price), the offer needs to be $142k (11.5% below list).
- Recommended offer: $142k (11.5% below list) — sets the bar for 1% rule.
- Cap rate 7.4% vs local median 3.8% in Jefferson City — top-decile yield for the area; either an underpriced asset or a hidden risk that comps aren't pricing in. Stress-test before assuming the spread holds.
Location & tenants
- Location reads 83/100 on livability (#7 in MO, #838 nationally) — a professional / high-income tenant draw. Strengths: cost of living A+, housing A+, health & safety A+; Watch: crime C-.
- Jefferson City (urban): math 34% / reading 48% proficiency, ranked #121 of 324 in MO (top 37%) — families likely to look elsewhere, expect single-tenant / working-renter base with shorter leases.
- Zoned schools: West Elem. (math 32% / reading 37%, grade F, #676 of 1,115 statewide, top 66%, 307 students, 52% FRL); Thomas Jefferson Middle (math 33% / reading 44%, grade F, #202 of 391 statewide, top 54%, 957 students, 52% FRL); Jefferson City High (math 46% / reading 63%, grade C-, #69 of 521 statewide, top 15%, 1,296 students, 48% FRL).
- Market conditions: Rents rising fast (+10.2%/yr); 253 active listings in the ZIP; 173 units permitted in Cole County in 2024 (0 in 5+ unit buildings).
Forward outlook
- Local home prices are declining (-3.0%/yr); year-one equity from $1k of loan paydown is wiped out by about $5k of value loss. Plan a longer hold.
- Cole County population projected to shrink 5% by 2050 — rents likely to lag national; underwrite the cash flow, not the appreciation.
- At projected returns (-3.0% appreciation + 8.0% rent growth), your $45k cash investment doubles in ~10 years — after that, you're playing with house money.
Negotiation context
- It's been on market 116 days — a 9% lower offer ($146k) is reasonable based on typical stale-listing flexibility.
- 4 sale attempts since 5y ago; this cycle's ask has dropped $30k (16%) from the opening price — seller is motivated, your offer sets the floor, not the list.
Risks & watch-outs
- Watch-outs: built in 1947 — expect roof / HVAC / electrical / plumbing capex.
Questions for the listing agent
- It's been on market 116 days. Have you received any prior offers? Is the seller open to a 11% concession, seller financing, or rate buy-down credit?
- Built in 1947 — when were the roof, HVAC, electrical panel, plumbing, and water heater last replaced?
- Why hasn't it sold? Are there any deal-killer items the seller is aware of (foundation, flood, title, zoning, code violations)?
- Is there a deadline driving the sale (1031 exchange, divorce, estate, relocation)? That informs how much negotiation room exists.
- Schools are B-rated — typically a magnet for longer-tenancy family renters. What's the average tenant stay here, and is there a school-zone premium baked into asking?
- What's the average days-on-market for RENTAL listings here right now (not sales)? A rising rental-DOM trend means longer vacancies and softer asking-rent achievability than the comps imply.
- What's the recent tenant-quality profile in this submarket — average credit score on applications, eviction rate, late-payment / NSF rate, and stable-employment percentage? A property-management company in the area should have these aggregated.
- How much new for-sale + rental construction is in the pipeline within 1–3 miles? Heavy new supply typically softens prices + rents 12–24 months out; constrained supply supports both.
Investment metrics
- 1% rule
- 0.89% ✗
- Cap rate
- 7.39%
- Cash-on-cash
- 3.91%
- DSCR
- 1.17
- GRM
- 9.4
CMA / ARV
- ARV (on-the-fly)
- $185,018
- Comps found
- 4
Show comp detail 4 sales within ~0.75 mi
| Address | Dist | Beds/Ba | Sqft | Sold | Price | $/sf | Match |
|---|---|---|---|---|---|---|---|
| 304 Vista Rd | 0.31mi | 3/2.0 | 1,283 (+10%) | 10mo | $225,000 | $175 | 58 |
| 1802 Ella St | 0.42mi | 3/2.0 | 1,330 (+14%) | 4mo | $209,999 | $158 | 50 |
| 809 ST Marys Blvd | 0.49mi | 2/1.0 (-1) | 1,106 (-6%) | 19mo | $146,000 | $132 | 47 |
| 1511 Edmonds St | 0.61mi | 3/2.0 | 1,278 (+9%) | 13mo | $165,000 | $129 | 41 |
Match score weights: distance 35% · size 25% · config 20% · recency 20%. Top-matched comps best support the ARV.
Projected returns pro-forma
-3.0% appreciation · 8.0% rent growth · sell at horizon
- IRR
- -5.3%
- Equity multiple
- 0.79×
- Total profit
- $-9,209
- Equity at exit
- $23,857
- IRR
- 9.1%
- Equity multiple
- 1.84×
- Total profit
- $37,777
- Equity at exit
- $13,834
Cash invested: $44,800 (down + closing). Projections, not guarantees.
Landlord ↔ Tenant lean methodology
- Overall (STATE)
- 81 Strongly Landlord-Friendly
- State Missouri
- 81 Strongly Landlord-Friendly · R+10
- County
- — inherits STATE
- City
- — inherits STATE
ZIP-level market 65109
- Home prices YoY
- -29.2%
- Rents YoY
- 10.2%
- Active inventory
- 253
- Price-to-rent
- 9.4×
Monthly cashflow live
- Estimated rent
- $1,417 medium interval (Pro) →
- Mortgage (P&I)
- −$839
- Tax from tax record
- −$68 /mo · $811/yr
- Insurance
- −$67
- HOA
- −$0
- Vacancy / Maint / Mgmt
- −$298
- Net cashflow
- $146
Break-even live
Sensitivity live
| Price | -10% $236 | -5% $191 | +0% $146 | +5% $101 | +10% $55 |
|---|---|---|---|---|---|
| Rent | -10% $34 | -5% $90 | +0% $146 | +5% $202 | +10% $258 |
| Rate | -1.0pp $226 | -0.5pp $187 | base $146 | +0.5pp $104 | +1.0pp $62 |
UW: 25.0% down · 7.5% · 30yr · 1.5% tax · 5.0% vac · 8.0% maint · 8.0% mgmt
Financing live
Cash to close
- Down payment
- $40,000
- Closing costs
- $4,800
- Reserves months
- —
- Total cash needed
- —
Loan-product check · same deal, 3 products live
Conventional
25% down · 7.5% · 30yr
- Down + closing
- —
- Monthly P&I
- —
- Monthly cashflow
- —
- DSCR
- —
- Eligible?
- —
Personal DTI + credit; lowest rate.
DSCR
20% down · 8.5% · 30yr
- Down + closing
- —
- Monthly P&I
- —
- Monthly cashflow
- —
- DSCR
- —
- Eligible?
- —
No personal income docs; deal must DSCR.
Hard money
10% down · 12.0% · 12mo
- Down + closing
- —
- Monthly P&I
- —
- Monthly cashflow
- —
- DSCR
- —
- Eligible?
- —
Short-term bridge; refi at stabilization.
Listing history 28 events
-
2026-06-22days on market $160,000 Active 116 DOM
-
2026-06-19days on market $160,000 Active 113 DOM
-
2026-06-18days on market $160,000 Active 112 DOM
-
2026-06-17days on market $160,000 Active 111 DOM
-
2026-06-16days on market $160,000 Active 110 DOM
-
2026-06-15days on market $160,000 Active 109 DOM
-
2026-06-14days on market $160,000 Active 107 DOM
-
2026-06-13days on market $160,000 Active 106 DOM
-
2026-06-10days on market $160,000 Active 104 DOM
-
2026-06-09days on market $160,000 Active 103 DOM
-
2026-06-08days on market $160,000 Active 102 DOM
-
2026-06-07days on market $160,000 Active 101 DOM
-
2026-06-05days on market $160,000 Active 98 DOM
-
2026-06-03days on market $160,000 Active 97 DOM
-
2026-06-02days on market $160,000 Active 96 DOM
-
2026-06-01days on market $160,000 Active 95 DOM
-
2026-05-31days on market $160,000 Active 94 DOM
-
2026-05-30days on market $160,000 Active 93 DOM
-
2026-04-21status Active
-
2026-04-18status Pending
-
2026-04-13price $160,000
-
2026-03-18status Active
-
2026-03-11status Pending
-
2026-03-03price $180,000
-
2026-02-16$190,000 Active
-
2021-09-08soldstatus
-
2021-09-02soldstatus 433-char remark
Show marketing remark (433 chars)
Check out this opportunity in Jefferson City! This 3 bedroom, 1 bath home has been partially updated and is ready for you to finish it with your own style. You'll have extra room in the partial basement to finish or use for storage too! Located near Hwy 50 and Dix Road, this would be a great starter home or investment opportunity and has a nice back yard with wooden patio area for entertaining. Schedule your appointment today!
-
2021-07-12$94,000 433-char remark
Show marketing remark (433 chars)
Check out this opportunity in Jefferson City! This 3 bedroom, 1 bath home has been partially updated and is ready for you to finish it with your own style. You'll have extra room in the partial basement to finish or use for storage too! Located near Hwy 50 and Dix Road, this would be a great starter home or investment opportunity and has a nice back yard with wooden patio area for entertaining. Schedule your appointment today!
ⓘ Source: listings_history table (triggers on properties + properties_extension) + one-shot
backfill from property_details.listing_events for pre-trigger history.
Tax reassessment forecast MO · Resets to sale price
- Current annual tax
- $811 · $68/mo
- Projected year-2 tax
- $1,552 · $129/mo
- Expected delta
- +$741/yr (+$62/mo · 91.3%)
ⓘ Screening estimate from a state-policy table — verify with the county assessor before closing.
Climate risk First Street
- Flood 1/10 Low FEMA zone X (unshaded) · 0% chance over 30 yrs
- Wildfire 1/10 Low
- Heat 4/10 Moderate 7 d/yr ≥106°F today · 19 d/yr by 30 yrs out
- Wind 2/10 Low
- Air quality 2/10 Low 0 unhealthy d/yr today · 1 by 30 yrs out
Nearby sold comps map
Loading sold comps map…
Walkable amenities ~0.75 mi
Loading nearby amenities…
Taxation est. · year 1
- Rental income
- $17,001
- − Mortgage interest
- −$8,962
- − Property taxes
- −$811
- − Insurance
- −$800
- − Repairs & maintenance
- −$1,360
- − Management
- −$1,360
- − Depreciation
- −$4,655
- Taxable loss
- −$948
- Est. tax savings @ 24.0%
- +$227
- After-tax cash flow
- $1,978/yr
For passive investors: Depreciation is non-cash, so a rental often shows a tax loss while cash-flowing — sheltering income. Rental losses are passive: they offset passive income freely, and up to $25,000/yr can offset ordinary (W-2) income if you actively participate and your MAGI is under $100k (phasing out to $0 by $150k); unused losses carry forward. On sale, claimed depreciation is recaptured at up to 25%, and gains may owe capital-gains tax (a 1031 exchange can defer both). Figures are a year-1 estimate at your 24.0% rate — not tax advice; consult a CPA.
Schools (NCES district)
- District
- Jefferson City
- NCES district ID
- 2916190
- Math proficiency
- 34% ▼ -1.00%
- Reading proficiency
- 48% ▲ 5.00%
- Median HH income
- $51,903
- Composite
- 35.45/100
- National rank
- #4930
- State rank
- #121 of 324 in MO
Livability — Jefferson City
- Score
- 83/100
- State rank
- #7
- US rank
- #838
Category grades
Schools grade is shown separately in the Schools card above.
Census & demographics
- Census place
- Jefferson City, MO
- County
- Cole County · 41,145 people
- City population
- 41,145
- Metro
- Jefferson City, MO
- Population (ZIP)
- 41,145
- Household income
- $74,694
- Rent vs Own
- Severe rent burden
- 984.0
Population outlook (Cole County) Hauer SSP2
- Today (2025)
- 78,107 people
- By 2030
- 78,089 · +-0.0%
- By 2040
- 76,814 · -1.7%
- By 2050
- 74,515 · -4.6%
- By 2075
- 67,687 · -13.3%
- By 2100
- 55,023 · -29.6%
Race, ethnicity, and origin ACS 2023
- Neighborhood character
- Predominantly White (82%)
- Race & ethnicity
- White 82% Black 7% Two or more races 5% Hispanic / Latino 4% Asian 3%
- Common ancestry
- Lithuanian 3% Italian 2% Slovak 2%
- Foreign-born
- 3% · Canada, China
- Languages at home
- 95% English-only · Spanish 1% Other Indo-European 1% Other Asian/Pacific 1%
Political lean MEDSL · Cole
- 2024 margin
- Solid R (+34.4) · D 32.1% · R 66.5% · Other 1.4%
- 2008→2024 swing
- -7.5pp toward R · 2008: -26.9pp · 2024: -34.4pp
- All cycles
- 2024: R+34.4 2020: R+33.9 2016: R+36.8 2012: R+33.7 2008: R+26.9
Not yet ingested
- Civics
- —
Market trends
- HPI YoY
- ▼ -83.14%
- Current HPI
- 202.01
- Rent YoY
- ▲ 10.19%
- Metro
- Jefferson City, MO
- State GDP YoY
- ▲ 1.84%
- F500 in state
- 20
Industry mix (Fortune 500 HQ in MO)
| Industry | F500 HQs | Revenue |
|---|---|---|
| Healthcare | 1 | $163B |
|
||
| Insurance | 1 | $21B |
|
||
| Industrial Technology | 1 | $17B |
|
||
| Retail | 1 | $16B |
|
||
| Industrial Distribution | 1 | $10B |
|
||
| Utilities | 1 | $9B |
|
||
Price history
+70.2% since first listed10 events — show timeline
- 2026-04-21 Relisted — JCMLS
- 2026-04-18 Pending — JCMLS
- 2026-04-13 Price Changed $160,000 JCMLS
- 2026-03-18 Relisted — JCMLS
- 2026-03-11 Pending — JCMLS
- 2026-03-03 Price Changed $180,000 JCMLS
- 2026-02-16 Listed $190,000 JCMLS
- 2021-09-08 Sold (Public Records) — Public Records
- 2021-09-02 Sold (MLS) — JCMLS
- 2021-07-12 Listed $94,000 JCMLS
Property tax history
+2.8%/yrLatest (2025): $811 · +11.9% YoY. Source: county tax records.
Cash-flow waterfall
monthlySold comps — $/sqft
last 12 mo · ≤1 miLoading sold comps…