905 3rd St St SE #406 · Cedar Rapids, IA
Flood risk No data
- FEMA flood zone
- —
- Chance of flooding over 30 yrs
- —
- Est. flood insurance / yr
- —
Fire risk No data
- Est. fire insurance / yr
- —
Heat risk No data
- Hot days now (above threshold)
- —
- Hot days in 30 yrs
- —
Wind risk No data
- Chance of severe wind over 30 yrs
- —
Air-quality risk No data
- Unhealthy air days now
- —
- Unhealthy air days in 30 yrs
- —
Risk factors via First Street. Map © Google.
Why this score? — see what drove the F grade
The composite is a weighted blend of 9 inputs, each scored 0–100. Each bar is that input's sub-score; the figure is the points it added to the 100-point composite (weight × sub-score).
- ARV discount +8.9/15.0
- Appreciation +7.1/10.0
- Schools +4.7/10.0
- Livability +3.9/5.0
- Rent growth +2.5/5.0
- Condition / age +2.5/5.0
- 1% rule +0.6/10.0
- Cash flow +0.0/30.0
- DSCR +0.0/10.0
$205,000
🖨 Deal sheet 📄 Offer letter ✓ Due diligence
Listing remarks MLS
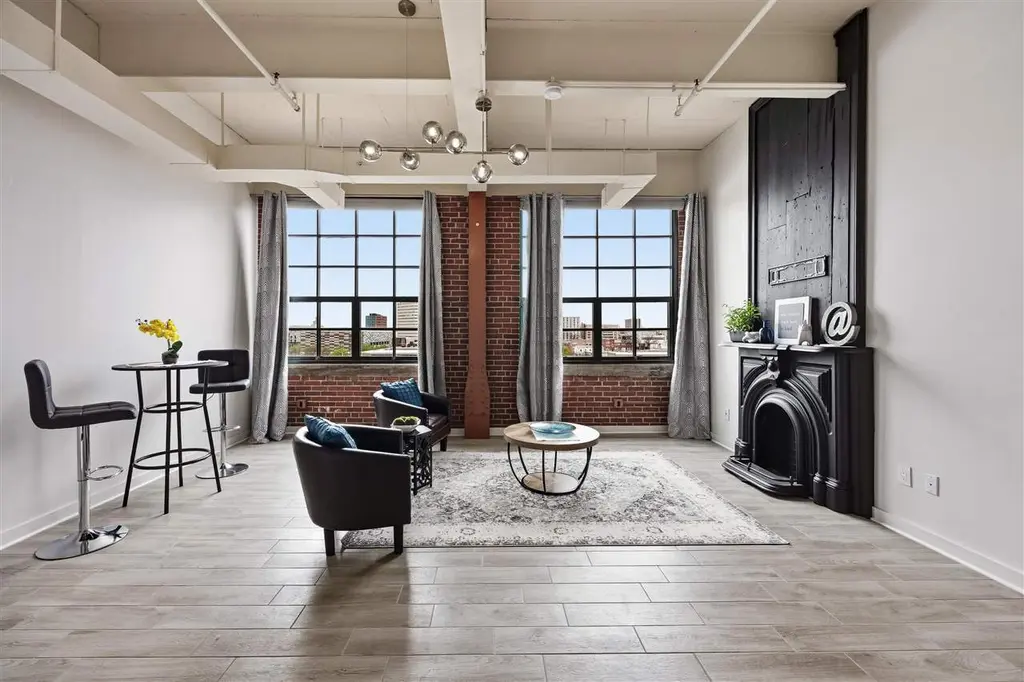
Experience downtown living at its finest in this thoughtfully designed 1-bedroom, 2 full-bath condo offering 1,045 sq. ft. of comfortable living space. Perfectly situated in the heart of Cedar Rapids, this home places you just steps away from incredible restaurants, local shopping, and everyday conveniences, with quick and easy access to I-380 for commuting. Inside, you’ll find a bright and open layout. Residents can enjoy both rooftop and main-level common areas, perfect for relaxing or entertaining while taking in the vibrant downtown atmosphere. There is also an elevator, making this ideal for those who do not desire stairs. This condo also includes two designated parking spots, a valuable perk in a downtown location. Just south of the building, you’ll find a welcoming grassy area, adding a touch of green space. Best of all, the building is pet-friendly, making it a perfect fit for you and your furry companions. .
Key facts
- Elevator
- Rooftop common areas
- Downtown living
Tags
Neighborhood map
What this means for you Summary
Snapshot
- This is a 1-bed/2.0-bath condo listed at $205k.
Deal economics
- At list price, monthly cash flow is $-1k ($-12k/yr) — negative.
- To cash-flow at today's rent, offer at most $117k (43.1% below list).
- To meet the 1% rule (rent ≥ 1% of price), the offer needs to be $115k (44.0% below list).
- Recommended offer: $115k (44.0% below list) — sets the bar for 1% rule.
- Cap rate 0.3% vs local median 3.5% in Cedar Rapids — below-typical yield; the buyer is paying a premium for something (appreciation thesis, condition, location) that the cap rate doesn't capture.
Location & tenants
- Location reads 78/100 on livability (#134 in IA, #2,474 nationally) — a middle-class / working-renter tenant base. Strengths: cost of living A+, housing A+, health & safety A+; Watch: crime C-, commute F.
- Cedar Rapids Community School District (urban): math 50% / reading 59% proficiency, ranked #265 of 289 in IA (top 92%) — acceptable for families but not a draw, mixed tenant base, ~2y average lease.
- Market conditions: 13 active listings in the ZIP; 2 comparable units currently listed for rent nearby; lower-income renter base — watch delinquency; 1,023 units permitted in Linn County in 2024 (456 in 5+ unit buildings).
- This rent runs 39% of the median local income ($35k/yr) — at the standard rent-burdened threshold; future hikes will face affordability resistance.
Forward outlook
- In year one you build about $10k of equity ($1k loan paydown + $8k appreciation (4.1% local appreciation)).
- Linn County population projected at +16% by 2050 — long-run rental-demand tailwind backs the buy-and-hold thesis.
- By year 4, paydown + projected appreciation supports a ~$33k cash-out refi (75% LTV) — recoverable capital for the next deal without selling this one.
Negotiation context
- It's been on market 24 days — a 2% lower offer ($202k) is reasonable based on typical stale-listing flexibility.
- 7 sale attempts since 9y ago with the ask held roughly flat each time — persistent listings suggest the price (not the market) is what's stuck; bring a comps-based counter.
Risks & watch-outs
- Watch-outs: HOA is 45% of rent; built in 1946 — expect roof / HVAC / electrical / plumbing capex.
Questions for the listing agent
- What do current leases actually rent for vs. the listed asking? Can we see a recent rent roll and the last 12 months of T-12 income?
- Built in 1946 — when were the roof, HVAC, electrical panel, plumbing, and water heater last replaced?
- What does the HOA fee cover, when was the last increase, and are there any pending special assessments or reserve-fund shortfalls?
- Any open or pending special assessments — roof, HVAC, plumbing, elevator, façade? What's the per-unit balance and payoff schedule, and is the seller paying it off at close or rolling it to the buyer?
- Is there a deadline driving the sale (1031 exchange, divorce, estate, relocation)? That informs how much negotiation room exists.
- Schools are B-rated — typically a magnet for longer-tenancy family renters. What's the average tenant stay here, and is there a school-zone premium baked into asking?
- The area grade is low — what's the realistic commute time and amenity access for the typical tenant pool here? Any planned neighborhood developments (good or bad) we should know about?
- What's the average days-on-market for RENTAL listings here right now (not sales)? A rising rental-DOM trend means longer vacancies and softer asking-rent achievability than the comps imply.
- What's the recent tenant-quality profile in this submarket — average credit score on applications, eviction rate, late-payment / NSF rate, and stable-employment percentage? A property-management company in the area should have these aggregated.
- How much new apartment / multifamily construction is in the pipeline within 1–3 miles? Heavy new supply (>2% of stock underway) typically softens rents 12–24 months out; light construction supports rent growth.
Investment metrics
- 1% rule
- 0.56% ✗
- Cap rate
- 0.34%
- Cash-on-cash
- -21.25%
- DSCR
- 0.05
- GRM
- 14.9
CMA / ARV
- ARV (median comp)
- $211,403
- List price
- $205,000
- Delta
- -3.03%
- Verdict
- FAIR
- Comps
- 20 within 1.0 mi
Projected returns pro-forma
4.14% appreciation · 3.0% rent growth · sell at horizon
- IRR
- -7.5%
- Equity multiple
- 0.53×
- Total profit
- $-27,011
- Equity at exit
- $105,682
- IRR
- -1.9%
- Equity multiple
- 0.65×
- Total profit
- $-19,881
- Equity at exit
- $174,257
Cash invested: $57,400 (down + closing). Projections, not guarantees.
Landlord ↔ Tenant lean methodology
- Overall (STATE)
- 83 Strongly Landlord-Friendly
- State Iowa
- 83 Strongly Landlord-Friendly · R+6
- County
- — inherits STATE
- City
- — inherits STATE
ZIP-level market 52401
- Home prices YoY
- 2.2%
- Active inventory
- 13
- Price-to-rent
- 14.9×
Monthly cashflow live
- Estimated rent
- $1,147 medium interval (Pro) →
- Mortgage (P&I)
- −$1,075
- Tax from tax record
- −$246 /mo · $2,952/yr
- Insurance
- −$85
- HOA est. from 16 same-building comps
- −$516
- Vacancy / Maint / Mgmt
- −$241
- Net cashflow
- $-1,016
Break-even live
UW: 25.0% down · 7.5% · 30yr · 1.5% tax · 5.0% vac · 8.0% maint · 8.0% mgmt
Financing live
Cash to close
- Down payment
- $51,250
- Closing costs
- $6,150
- Reserves months
- —
- Total cash needed
- —
Loan-product check · same deal, 3 products live
Conventional
25% down · 7.5% · 30yr
- Down + closing
- —
- Monthly P&I
- —
- Monthly cashflow
- —
- DSCR
- —
- Eligible?
- —
Personal DTI + credit; lowest rate.
DSCR
20% down · 8.5% · 30yr
- Down + closing
- —
- Monthly P&I
- —
- Monthly cashflow
- —
- DSCR
- —
- Eligible?
- —
No personal income docs; deal must DSCR.
Hard money
10% down · 12.0% · 12mo
- Down + closing
- —
- Monthly P&I
- —
- Monthly cashflow
- —
- DSCR
- —
- Eligible?
- —
Short-term bridge; refi at stabilization.
Rent comps 2 comps
| Address | Beds | Baths | Sqft | Rent | $/sqft | DOM | Units | Dist |
|---|---|---|---|---|---|---|---|---|
| 906 10th St SE Cedar Rapids, IA | 1.0–2.0 | 1.0–2.0 | 890 | $1,100 | $1.24 | 13d | 6 | 0.56mi |
| 206 3rd Ave SW Cedar Rapids, IA | 1.0 | 1.5 | 1400 | $1,495 | $1.07 | 13d | 1 | 0.68mi |
HOA detail condo
- Monthly dues
- $0 · $0/yr
- Assessments
- None detected in remarks — confirm with the listing agent.
Listing history 21 events
-
2026-05-08status Pending 942-char remark
Show marketing remark (940 chars)
Experience downtown living at its finest in this thoughtfully designed 1-bedroom, 2 full-bath condo offering 1,045 sq. ft. of comfortable living space. Perfectly situated in the heart of Cedar Rapids, this home places you just steps away from incredible restaurants, local shopping, and everyday conveniences, with quick and easy access to I-380 for commuting. Inside, you’ll find a bright and open layout. Residents can enjoy both rooftop and main-level common areas, perfect for relaxing or entertaining while taking in the vibrant downtown atmosphere. There is also an elevator, making this ideal for those who do not desire stairs. This condo also includes two designated parking spots, a valuable perk in a downtown location. Just south of the building, you’ll find a welcoming grassy area, adding a touch of green space. Best of all, the building is pet-friendly, making it a perfect fit for you and your furry companions.
-
2026-05-08status Pending 940-char remark
Show marketing remark (940 chars)
Experience downtown living at its finest in this thoughtfully designed 1-bedroom, 2 full-bath condo offering 1,045 sq. ft. of comfortable living space. Perfectly situated in the heart of Cedar Rapids, this home places you just steps away from incredible restaurants, local shopping, and everyday conveniences, with quick and easy access to I-380 for commuting. Inside, you’ll find a bright and open layout. Residents can enjoy both rooftop and main-level common areas, perfect for relaxing or entertaining while taking in the vibrant downtown atmosphere. There is also an elevator, making this ideal for those who do not desire stairs. This condo also includes two designated parking spots, a valuable perk in a downtown location. Just south of the building, you’ll find a welcoming grassy area, adding a touch of green space. Best of all, the building is pet-friendly, making it a perfect fit for you and your furry companions.
-
2026-04-14$205,000 Active 942-char remark
Show marketing remark (940 chars)
Experience downtown living at its finest in this thoughtfully designed 1-bedroom, 2 full-bath condo offering 1,045 sq. ft. of comfortable living space. Perfectly situated in the heart of Cedar Rapids, this home places you just steps away from incredible restaurants, local shopping, and everyday conveniences, with quick and easy access to I-380 for commuting. Inside, you’ll find a bright and open layout. Residents can enjoy both rooftop and main-level common areas, perfect for relaxing or entertaining while taking in the vibrant downtown atmosphere. There is also an elevator, making this ideal for those who do not desire stairs. This condo also includes two designated parking spots, a valuable perk in a downtown location. Just south of the building, you’ll find a welcoming grassy area, adding a touch of green space. Best of all, the building is pet-friendly, making it a perfect fit for you and your furry companions.
-
2026-04-14$205,000 Active 940-char remark
Show marketing remark (940 chars)
Experience downtown living at its finest in this thoughtfully designed 1-bedroom, 2 full-bath condo offering 1,045 sq. ft. of comfortable living space. Perfectly situated in the heart of Cedar Rapids, this home places you just steps away from incredible restaurants, local shopping, and everyday conveniences, with quick and easy access to I-380 for commuting. Inside, you’ll find a bright and open layout. Residents can enjoy both rooftop and main-level common areas, perfect for relaxing or entertaining while taking in the vibrant downtown atmosphere. There is also an elevator, making this ideal for those who do not desire stairs. This condo also includes two designated parking spots, a valuable perk in a downtown location. Just south of the building, you’ll find a welcoming grassy area, adding a touch of green space. Best of all, the building is pet-friendly, making it a perfect fit for you and your furry companions.
-
2025-05-27soldstatus $180,000 Closed
-
2025-05-27soldstatus $180,000 Closed
-
2025-04-26status Pending
-
2025-04-26historical Active Under Contract
-
2025-04-15price $182,500
-
2025-04-15price $182,500
-
2025-03-12$189,900 Active
-
2025-03-12$189,900 Active
-
2024-01-11soldstatus $178,500 Closed
-
2023-11-20status Pending
-
2023-10-06$179,900 Active
-
2021-06-23soldstatus $169,000
-
2021-06-21soldstatus $169,000
-
2021-04-13$179,950
-
2018-05-30soldstatus $165,000
-
2018-05-21soldstatus $165,000
-
2017-12-15$167,000
ⓘ Source: listings_history table (triggers on properties + properties_extension) + one-shot
backfill from property_details.listing_events for pre-trigger history.
Tax reassessment forecast IA · Partial reset (capped growth)
- Current annual tax
- $2,952 · $246/mo
- Projected year-2 tax
- $3,085 · $257/mo
- Expected delta
- +$133/yr (+$11/mo · 4.5%)
ⓘ Screening estimate from a state-policy table — verify with the county assessor before closing.
Nearby sold comps map
Loading sold comps map…
Walkable amenities ~0.75 mi
Loading nearby amenities…
Taxation est. · year 1
- Rental income
- $13,764
- − Mortgage interest
- −$11,483
- − Property taxes
- −$2,952
- − Insurance
- −$1,025
- − Repairs & maintenance
- −$1,101
- − Management
- −$1,101
- − HOA
- −$6,192
- − Depreciation
- −$5,964
- Taxable loss
- −$16,054
- Est. tax savings @ 24.0%
- +$3,853
- After-tax cash flow
- $-8,343/yr
For passive investors: Depreciation is non-cash, so a rental often shows a tax loss while cash-flowing — sheltering income. Rental losses are passive: they offset passive income freely, and up to $25,000/yr can offset ordinary (W-2) income if you actively participate and your MAGI is under $100k (phasing out to $0 by $150k); unused losses carry forward. On sale, claimed depreciation is recaptured at up to 25%, and gains may owe capital-gains tax (a 1031 exchange can defer both). Figures are a year-1 estimate at your 24.0% rate — not tax advice; consult a CPA.
Schools (NCES district)
- District
- Cedar Rapids Community School District
- NCES district ID
- 1906540
- Math proficiency
- 50% ▼ -12.00%
- Reading proficiency
- 59% ▼ -6.00%
- Median HH income
- $53,568
- Composite
- 46.82/100
- National rank
- #2378
- State rank
- #265 of 289 in IA
Livability — Cedar Rapids
- Score
- 78/100
- State rank
- #134
- US rank
- #2474
Category grades
Schools grade is shown separately in the Schools card above.
Census & demographics
- Census place
- Cedar Rapids, IA
- County
- Linn County · 179,860 people
- City population
- 137,154
- Metro
- Cedar Rapids, IA
- Population (ZIP)
- 2,181
- Household income
- $35,060
- Rent vs Own
- Severe rent burden
- 324.0
Population outlook (Linn County) Hauer SSP2
- Today (2025)
- 239,589 people
- By 2030
- 248,587 · +3.8%
- By 2040
- 264,817 · +10.5%
- By 2050
- 278,685 · +16.3%
- By 2075
- 311,754 · +30.1%
- By 2100
- 336,773 · +40.6%
Race, ethnicity, and origin ACS 2023
- Neighborhood character
- Predominantly White (66%)
- Race & ethnicity
- White 66% Black 19% Hispanic / Latino 7% Two or more races 6% Asian 3%
- Hispanic origin (detail)
- Mexican 5%
- Common ancestry
- Slovak 3% Portuguese 2% Lithuanian 2%
- Foreign-born
- 12% · Canada, China
- Languages at home
- 85% English-only · Spanish 4% Other Indo-European 3% French/Haitian/Cajun 2%
Political lean MEDSL · Linn
- 2024 margin
- Lean D (+9.9) · D 54.2% · R 44.3% · Other 1.4%
- 2008→2024 swing
- -11.6pp toward R · 2008: 21.5pp · 2024: 9.9pp
- All cycles
- 2024: D+9.9 2020: D+13.7 2016: D+9.0 2012: D+17.6 2008: D+21.5
Not yet ingested
- Civics
- —
Market trends
- HPI YoY
- ▲ 4.14%
- Current HPI
- 194.6053
- Rent YoY
- —
- Metro
- Cedar Rapids, IA
- State GDP YoY
- ▲ 2.48%
- F500 in state
- 4
Industry mix (Fortune 500 HQ in IA)
| Industry | F500 HQs | Revenue |
|---|---|---|
| Financial Services | 1 | $16B |
|
||
| Retail / Convenience | 1 | $15B |
|
||
Price history
+22.8% since first listed21 events — show timeline
- 2026-05-08 Pending — ICAARMLS
- 2026-05-08 Pending — CRAAR, CDRMLS
- 2026-04-14 Listed $205,000 CRAAR, CDRMLS
- 2026-04-14 Listed $205,000 ICAARMLS
- 2025-05-27 Sold (MLS) $180,000 CRAAR, CDRMLS
- 2025-05-27 Sold (MLS) $180,000 ICAARMLS
- 2025-04-26 Pending — CRAAR, CDRMLS
- 2025-04-26 Contingent — ICAARMLS
- 2025-04-15 Price Changed $182,500 ICAARMLS
- 2025-04-15 Price Changed $182,500 CRAAR, CDRMLS
- 2025-03-12 Listed $189,900 CRAAR, CDRMLS
- 2025-03-12 Listed $189,900 ICAARMLS
- 2024-01-11 Sold (MLS) $178,500 CRAAR, CDRMLS
- 2023-11-20 Pending — CRAAR, CDRMLS
- 2023-10-06 Listed $179,900 CRAAR, CDRMLS
- 2021-06-23 Sold (Public Records) $169,000 Public Records
- 2021-06-21 Sold (MLS) $169,000 CRAAR, CDRMLS
- 2021-04-13 Listed $179,950 CRAAR, CDRMLS
- 2018-05-30 Sold (Public Records) $165,000 Public Records
- 2018-05-21 Sold (MLS) $165,000 CRAAR, CDRMLS
- 2017-12-15 Listed $167,000 CRAAR, CDRMLS
Property tax history
-2.5%/yrLatest (2022): $2,952 · -16.3% YoY. Source: county tax records.
Cash-flow waterfall
monthlySold comps — $/sqft
last 12 mo · ≤1 miLoading sold comps…