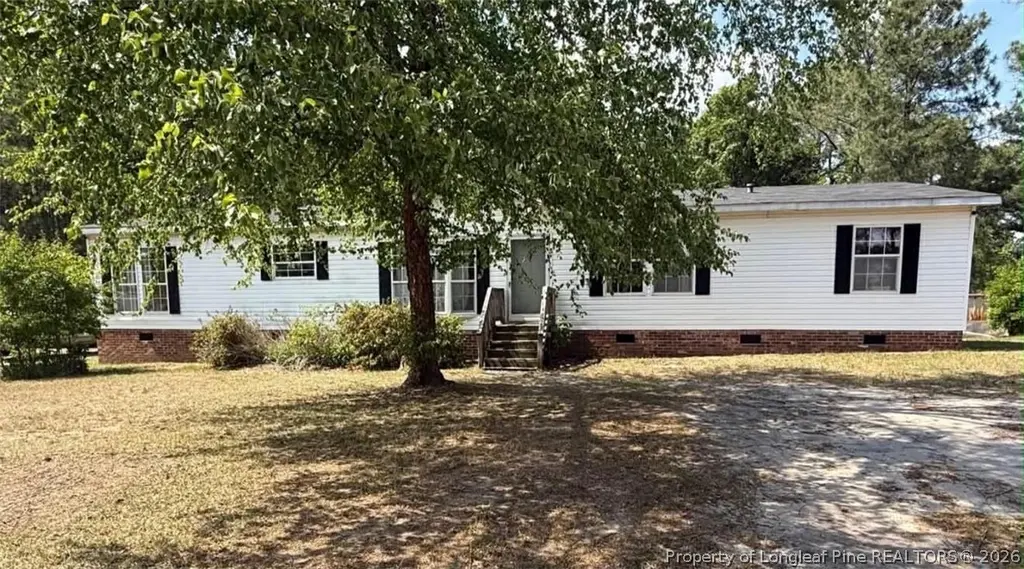
6322 Aladdin Dr · Hope Mills, NC
Flood risk 1/10 · Minimal
- FEMA flood zone
- X (unshaded)
- Chance of flooding over 30 yrs
- 0.0%
- Est. flood insurance / yr
- $507 – $1,088
Fire risk 7/10 · Major
- Est. fire insurance / yr
- $906 – $1,684
Heat risk 7/10 · Major
- Hot days now (above 106°F)
- 7 days/yr
- Hot days in 30 yrs
- 16 days/yr
Wind risk 8/10 · Major
- Chance of severe wind over 30 yrs
- 80.0%
Air-quality risk 1/10 · Minimal
- Unhealthy air days now
- 0 days/yr
- Unhealthy air days in 30 yrs
- 0 days/yr
Risk factors via First Street. Map © Google.
Why this score? — see what drove the B- grade
The composite is a weighted blend of 9 inputs, each scored 0–100. Each bar is that input's sub-score; the figure is the points it added to the 100-point composite (weight × sub-score).
- Cash flow +29.8/30.0
- DSCR +10.0/10.0
- 1% rule +8.0/10.0
- ARV discount +7.5/15.0
- Rent growth +3.6/5.0
- Livability +3.4/5.0
- Schools +3.1/10.0
- Condition / age +2.5/5.0
- Appreciation +0.0/10.0
$130,000
🖨 Deal sheet 📄 Offer letter ✓ Due diligence
Listing remarks
Come live in Grays creek. When you enter the front door of this home you instantly know you have room to grow. This beautiful home offers 3 bedrooms 2 full baths. Open floor plan to allow for entertaining. Closed in porch just off the living room. Eat-in Kitchen, Formal Dining and Living Room. Situated on a corner lot. The home is equipped with a Reverse Osmosis. Home is being sold AS IS.
Key facts
- Open floor plan
- Formal dining
- Closed in porch
Tags
Property features AI
Finance
- Other: Located in the Twin Oaks subdivision
Exterior
- Parking: No garage
- Utilities: Water from spring and well; Septic and holding tank for sewer
- Home design: Single-family residence; Residential zoning (A1A - Residential District)
- Construction: Vinyl siding; Home warranty included
- Exterior features: Porch with screened area; Corner lot
Interior
- Kitchen: Electric range
- Flooring: Laminate
- Bathrooms: 2 full bathrooms
- Heating & cooling: Heat pump; Heating present
- Interior features: Eat-in kitchen; Kitchen island; Open floorplan; Storage; Factory-built fireplace (1)
- Laundry & utility: Washer hookup on main level; In-unit laundry
Neighborhood map
What this means for you Summary
Snapshot
- This is a 3-bed/2.0-bath manufactured listed at $130k.
Deal economics
- At list price, monthly cash flow is $477 ($6k/yr) — positive.
- The deal already cash-flows at list — no discount required.
- Meets the 1% rule at list price ($2k rent vs $130k).
- Recommended offer: $128k (1.5% below list) — sets the bar for market timing.
- Cap rate 10.7% vs local median 4.8% in Hope Mills — top-decile yield for the area; either an underpriced asset or a hidden risk that comps aren't pricing in. Stress-test before assuming the spread holds.
Location & tenants
- Location reads 67/100 on livability (#234 in NC) — a middle-class / working-renter tenant base. Strengths: cost of living A+, housing A+, health & safety B+; Watch: crime D-, amenities F, commute F.
- Cumberland County Schools (urban): math 32% / reading 41% proficiency, ranked #126 of 178 in NC (top 71%) — families likely to look elsewhere, expect single-tenant / working-renter base with shorter leases.
- Zoned schools: Alderman Road Elementary (math 33% / reading 36%, grade F, #835 of 1,410 statewide, top 62%, 628 students, 100% FRL); Gray'S Creek Middle (math 33% / reading 48%, grade F, #215 of 475 statewide, top 46%, 1,126 students, 50% FRL); Gray'S Creek High (math 61% / reading 58%, grade C+, #216 of 535 statewide, top 43%, 1,395 students, 44% FRL).
- Market conditions: Rents rising fast (+4.3%/yr); 317 active listings in the ZIP; 1,125 units permitted in Cumberland County in 2024 (104 in 5+ unit buildings).
- This rent runs 31% of the median local income ($66k/yr) — at the standard rent-burdened threshold; future hikes will face affordability resistance.
Forward outlook
- Local home prices are declining (-3.0%/yr); year-one equity from $899 of loan paydown is wiped out by about $4k of value loss. Plan a longer hold.
- At projected returns (-3.0% appreciation + 4.3% rent growth), your $36k cash investment doubles in ~7 years — after that, you're playing with house money.
Negotiation context
- It's been on market 19 days — a 2% lower offer ($128k) is reasonable based on typical stale-listing flexibility.
- 4 sale attempts since 19y ago; this cycle's ask has dropped $10k (7%) from the opening price — seller is motivated, your offer sets the floor, not the list.
Risks & watch-outs
- Climate carrying-cost: severe wind risk, 80% chance of damaging wind over 30y; major wildfire risk; extreme-heat days projected 7→16/yr by 2055 (HVAC capex compounding) — expect insurance premiums to compound above CPI over the hold.
Questions for the listing agent
- Is there a deadline driving the sale (1031 exchange, divorce, estate, relocation)? That informs how much negotiation room exists.
- Schools are D-rated, which usually means shorter tenancies and higher turnover. Who's the typical renter profile here, and what's been the actual vacancy rate?
- Crime grade is D in this area — have there been break-ins, vandalism, or insurance claims at this property in the last 3 years? What carrier currently insures it and at what premium?
- What's the average days-on-market for RENTAL listings here right now (not sales)? A rising rental-DOM trend means longer vacancies and softer asking-rent achievability than the comps imply.
- What's the recent tenant-quality profile in this submarket — average credit score on applications, eviction rate, late-payment / NSF rate, and stable-employment percentage? A property-management company in the area should have these aggregated.
- How much new for-sale + rental construction is in the pipeline within 1–3 miles? Heavy new supply typically softens prices + rents 12–24 months out; constrained supply supports both.
Investment metrics
- 1% rule
- 1.30% ✓
- Cap rate
- 10.69%
- Cash-on-cash
- 15.71%
- DSCR
- 1.70
- GRM
- 6.4
CMA / ARV
- ARV (on-the-fly)
- $27,712
- Comps found
- 1
Show comp detail 1 sale within ~0.75 mi
| Address | Dist | Beds/Ba | Sqft | Sold | Price | $/sf | Match |
|---|---|---|---|---|---|---|---|
| 1619 Barmack Ct | 0.09mi | 3/2.0 | 1,608 (-7%) | 21mo | $25,500 | $16 | 67 |
Match score weights: distance 35% · size 25% · config 20% · recency 20%. Top-matched comps best support the ARV.
Projected returns pro-forma
-3.0% appreciation · 4.28% rent growth · sell at horizon
- IRR
- 7.9%
- Equity multiple
- 1.32×
- Total profit
- $11,491
- Equity at exit
- $19,383
- IRR
- 18.3%
- Equity multiple
- 2.60×
- Total profit
- $58,381
- Equity at exit
- $11,240
Cash invested: $36,400 (down + closing). Projections, not guarantees.
Landlord ↔ Tenant lean methodology
- Overall (STATE)
- 85 Strongly Landlord-Friendly
- State North Carolina
- 85 Strongly Landlord-Friendly · R+3
- County
- — inherits STATE
- City
- — inherits STATE
ZIP-level market 28348
- Home prices YoY
- -14.0%
- Rents YoY
- 4.3%
- Active inventory
- 317
- Price-to-rent
- 6.4×
Monthly cashflow live
- Estimated rent
- $1,691 medium interval (Pro) →
- Mortgage (P&I)
- −$682
- Tax from tax record
- −$123 /mo · $1,478/yr
- Insurance
- −$54
- HOA
- −$0
- Vacancy / Maint / Mgmt
- −$355
- Net cashflow
- $477
Break-even live
UW: 25.0% down · 7.5% · 30yr · 1.5% tax · 5.0% vac · 8.0% maint · 8.0% mgmt
Financing live
Cash to close
- Down payment
- $32,500
- Closing costs
- $3,900
- Reserves months
- —
- Total cash needed
- —
Loan-product check · same deal, 3 products live
Conventional
25% down · 7.5% · 30yr
- Down + closing
- —
- Monthly P&I
- —
- Monthly cashflow
- —
- DSCR
- —
- Eligible?
- —
Personal DTI + credit; lowest rate.
DSCR
20% down · 8.5% · 30yr
- Down + closing
- —
- Monthly P&I
- —
- Monthly cashflow
- —
- DSCR
- —
- Eligible?
- —
No personal income docs; deal must DSCR.
Hard money
10% down · 12.0% · 12mo
- Down + closing
- —
- Monthly P&I
- —
- Monthly cashflow
- —
- DSCR
- —
- Eligible?
- —
Short-term bridge; refi at stabilization.
Listing history 23 events
-
2026-06-13status $130,000 Pending 19 DOM
-
2026-06-10days on market $130,000 Active 19 DOM
-
2026-06-09days on market $130,000 Active 18 DOM
-
2026-06-09price $130,000 Active 17 DOM
-
2026-06-08days on market $139,900 Active 17 DOM
-
2026-06-07remarks 391-char remark
-
2026-06-07days on market $139,900 Active 16 DOM
-
2026-06-03days on market $139,900 Active 12 DOM
-
2026-06-02days on market $139,900 Active 11 DOM
-
2026-06-01days on market $139,900 Active 10 DOM
-
2026-05-31days on market $139,900 Active 9 DOM
-
2026-05-30days on market $139,900 Active 8 DOM
-
2026-05-19$139,900 Active
-
2021-09-10soldstatus $116,000
-
2009-01-23soldstatus $48,000
-
2008-05-18historical
-
2008-04-23historical
-
2008-04-22$55,000
-
2008-01-23$55,000
-
2008-01-02historical
-
2007-08-21$60,000
-
1995-04-07soldstatus $12,000
-
1994-04-19soldstatus $12,000
ⓘ Source: listings_history table (triggers on properties + properties_extension) + one-shot
backfill from property_details.listing_events for pre-trigger history.
Tax reassessment forecast NC · Resets to sale price
- Current annual tax
- $1,478 · $123/mo
- Projected year-2 tax
- $1,478 · $123/mo
- Expected delta
- $0/yr ($0/mo · 0.0%)
ⓘ Screening estimate from a state-policy table — verify with the county assessor before closing.
Climate risk First Street
- Flood 1/10 Low FEMA zone X (unshaded) · 0% chance over 30 yrs
- Wildfire 7/10 Severe
- Heat 7/10 Severe 7 d/yr ≥106°F today · 16 d/yr by 30 yrs out
- Wind 8/10 Severe 80% chance of damaging wind over 30 yrs
- Air quality 1/10 Low 0 unhealthy d/yr today · 0 by 30 yrs out
Nearby sold comps map
Loading sold comps map…
Walkable amenities ~0.75 mi
Loading nearby amenities…
Taxation est. · year 1
- Rental income
- $20,287
- − Mortgage interest
- −$7,282
- − Property taxes
- −$1,478
- − Insurance
- −$650
- − Repairs & maintenance
- −$1,623
- − Management
- −$1,623
- − Depreciation
- −$3,782
- Taxable income
- $3,850
- Est. tax owed @ 24.0%
- −$924
- After-tax cash flow
- $4,794/yr
For passive investors: Depreciation is non-cash, so a rental often shows a tax loss while cash-flowing — sheltering income. Rental losses are passive: they offset passive income freely, and up to $25,000/yr can offset ordinary (W-2) income if you actively participate and your MAGI is under $100k (phasing out to $0 by $150k); unused losses carry forward. On sale, claimed depreciation is recaptured at up to 25%, and gains may owe capital-gains tax (a 1031 exchange can defer both). Figures are a year-1 estimate at your 24.0% rate — not tax advice; consult a CPA.
Schools (NCES district)
- District
- Cumberland County Schools
- NCES district ID
- 3700011
- Math proficiency
- 32% ▼ -2.00%
- Reading proficiency
- 41% ▼ -1.00%
- Median HH income
- $44,168
- Composite
- 31.0/100
- National rank
- #6096
- State rank
- #126 of 178 in NC
Livability — Hope Mills
- Score
- 67/100
- State rank
- #234
- US rank
- #10761
Category grades
Schools grade is shown separately in the Schools card above.
Census & demographics
- County
- Cumberland County · 265,314 people
- City population
- 39,196
- Metro
- Fayetteville, NC
- Population (ZIP)
- 39,196
- Household income
- $66,129
- Rent vs Own
- Severe rent burden
- 746.0
Population outlook (Cumberland County) Hauer SSP2
- Today (2025)
- 330,855 people
- By 2030
- 333,523 · +0.8%
- By 2040
- 335,583 · +1.4%
- By 2050
- 335,325 · +1.4%
- By 2075
- 342,853 · +3.6%
- By 2100
- 340,698 · +3.0%
Race, ethnicity, and origin ACS 2023
- Neighborhood character
- Diverse neighborhood (Simpson 0.67)
- Race & ethnicity
- White 49% Black 27% Hispanic / Latino 13% Two or more races 11% Asian 2% Native American 2%
- Hispanic origin (detail)
- Mexican 4% Puerto Rican 5%
- Common ancestry
- Romanian 2% Lithuanian 1% Serbian 1%
- Foreign-born
- 5% · Canada, South Korea, Vietnam
- Languages at home
- 90% English-only · Spanish 8% Other Indo-European 1%
Political lean MEDSL · Cumberland
- 2024 margin
- D (+13.4) · D 56.1% · R 42.7% · Other 1.2%
- 2008→2024 swing
- -4.3pp toward R · 2008: 17.7pp · 2024: 13.4pp
- All cycles
- 2024: D+13.4 2020: D+16.6 2016: D+16.0 2012: D+19.7 2008: D+17.7
Not yet ingested
- Civics
- —
Market trends
- HPI YoY
- ▼ -37.14%
- Current HPI
- 228.3122
- Rent YoY
- ▲ 4.28%
- Metro
- Fayetteville, NC
- State GDP YoY
- ▲ 3.28%
- F500 in state
- 26
Industry mix (Fortune 500 HQ in NC)
| Industry | F500 HQs | Revenue |
|---|---|---|
| Financial Services | 2 | $213B |
|
||
| Retail | 2 | $95B |
|
||
| Industrial Conglomerate | 1 | $38B |
|
||
| Metals / Steel | 1 | $35B |
|
||
| Utilities | 1 | $30B |
|
||
| Industrial Machinery | 1 | $19B |
|
||
Price history
+1065.8% since first listed11 events — show timeline
- 2026-05-19 Listed $139,900 LPRMLS
- 2021-09-10 Sold (Public Records) $116,000 Public Records
- 2009-01-23 Sold (Public Records) $48,000 Public Records
- 2008-05-18 Listing Removed — TMLS
- 2008-04-23 Listing Removed — TMLS
- 2008-04-22 Listed $55,000 TMLS
- 2008-01-23 Listed $55,000 TMLS
- 2008-01-02 Listing Removed — TMLS
- 2007-08-21 Listed $60,000 TMLS
- 1995-04-07 Sold (Public Records) $12,000 Public Records
- 1994-04-19 Sold (Public Records) $12,000 Public Records
Property tax history
+5.1%/yrLatest (2025): $1,478 · +58.5% YoY. Source: county tax records.
Cash-flow waterfall
monthlySold comps — $/sqft
last 12 mo · ≤1 miLoading sold comps…