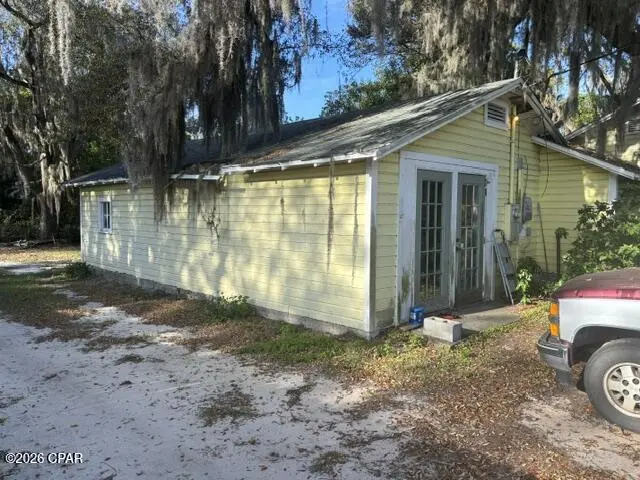
5026 E Highway 98 · Parker, FL
Flood risk 3/10 · Minor
- FEMA flood zone
- X (unshaded)
- Chance of flooding over 30 yrs
- 0.14%
- Est. flood insurance / yr
- $507 – $1,088
Fire risk 1/10 · Minimal
- Est. fire insurance / yr
- $947 – $1,759
Heat risk 10/10 · Severe
- Hot days now (above 104°F)
- 7 days/yr
- Hot days in 30 yrs
- 21 days/yr
Wind risk 9/10 · Severe
- Chance of severe wind over 30 yrs
- 99.0%
Air-quality risk 1/10 · Minimal
- Unhealthy air days now
- 0 days/yr
- Unhealthy air days in 30 yrs
- 0 days/yr
Risk factors via First Street. Map © Google.
Why this score? — see what drove the B+ grade
The composite is a weighted blend of 9 inputs, each scored 0–100. Each bar is that input's sub-score; the figure is the points it added to the 100-point composite (weight × sub-score).
- Cash flow +30.0/30.0
- ARV discount +15.0/15.0
- DSCR +10.0/10.0
- 1% rule +9.4/10.0
- Schools +4.3/10.0
- Livability +3.2/5.0
- Rent growth +2.8/5.0
- Condition / age +2.5/5.0
- Appreciation +0.0/10.0
$97,000
🖨 Deal sheet (PDF) 📄 Offer letter ✓ Due diligence
Listing remarks MLS
3 bedroom, 2 bathroom ''diamond in the rough'' home(in need of total renovation)on a little bit more than a half acre lot!! The zoning is both residential and commercial, so you could turn this home into a business as well. With some vision this property could become an incredible dream home or a great business on a highly traveled major road. All information is approximate and should be verified by buyers if important
Key facts
- Half acre lot
- 0.55 acre lot
- Built 1929
Tags
Neighborhood map
What this means for you Summary
Snapshot
- This is a 2-bed/2.0-bath single-family listed at $97k.
Deal economics
- At list price, monthly cash flow is $448 ($5k/yr) — positive.
- The deal already cash-flows at list — no discount required.
- Meets the 1% rule at list price ($1k rent vs $97k).
- Recommended offer: $91k (6.0% below list) — sets the bar for market timing.
- Cap rate 11.8% vs local median 4.3% in Parker — top-decile yield for the area; either an underpriced asset or a hidden risk that comps aren't pricing in. Stress-test before assuming the spread holds.
Location & tenants
- Location reads 63/100 on livability (#704 in FL) — a middle-class / working-renter tenant base. Strengths: cost of living A+, housing A+; Watch: crime C-, schools F, amenities F.
- Bay (suburban): math 51% / reading 51% proficiency, ranked #29 of 73 in FL (top 40%) — acceptable for families but not a draw, mixed tenant base, ~2y average lease.
- Market conditions: Rents rising (+1.1%/yr); 969 active listings in the ZIP; 15 comparable units currently listed for rent nearby; rentals at typical pace (median 22d on market — plan ~3-4 weeks tenant-placement turnaround); 2,473 units permitted in Bay County in 2024 (559 in 5+ unit buildings).
Forward outlook
- Local home prices are declining (-3.0%/yr); year-one equity from $671 of loan paydown is wiped out by about $3k of value loss. Plan a longer hold.
- Bay County population projected at +24% by 2050 — long-run rental-demand tailwind backs the buy-and-hold thesis.
- At projected returns (-3.0% appreciation + 1.1% rent growth), your $27k cash investment doubles in ~8 years — after that, you're playing with house money.
Negotiation context
- It's been on market 77 days — a 6% lower offer ($91k) is reasonable based on typical stale-listing flexibility.
- 2 sale attempts since 25y ago; this cycle's ask has dropped $32k (25%) from the opening price — seller is motivated, your offer sets the floor, not the list.
Risks & watch-outs
- Watch-outs: built in 1929 — expect roof / HVAC / electrical / plumbing capex.
- Climate carrying-cost: severe wind risk, 99% chance of damaging wind over 30y; extreme-heat days projected 7→21/yr by 2055 (HVAC capex compounding) — expect insurance premiums to compound above CPI over the hold.
Questions for the listing agent
- It's been on market 77 days. Have you received any prior offers? Is the seller open to a 6% concession, seller financing, or rate buy-down credit?
- Built in 1929 — when were the roof, HVAC, electrical panel, plumbing, and water heater last replaced?
- Why hasn't it sold? Are there any deal-killer items the seller is aware of (foundation, flood, title, zoning, code violations)?
- Is there a deadline driving the sale (1031 exchange, divorce, estate, relocation)? That informs how much negotiation room exists.
- Schools are F-rated, which usually means shorter tenancies and higher turnover. Who's the typical renter profile here, and what's been the actual vacancy rate?
- What's the average days-on-market for RENTAL listings here right now (not sales)? A rising rental-DOM trend means longer vacancies and softer asking-rent achievability than the comps imply.
- What's the recent tenant-quality profile in this submarket — average credit score on applications, eviction rate, late-payment / NSF rate, and stable-employment percentage? A property-management company in the area should have these aggregated.
- How much new for-sale + rental construction is in the pipeline within 1–3 miles? Heavy new supply typically softens prices + rents 12–24 months out; constrained supply supports both.
Investment metrics
- 1% rule
- 1.44% ✓
- Cap rate
- 11.83%
- Cash-on-cash
- 19.79%
- DSCR
- 1.88
- GRM
- 5.8
CMA / ARV
- ARV (median comp)
- $189,278
- List price
- $97,000
- Delta
- -48.75%
- Verdict
- UNDERPRICED
- Comps
- 20 within 1.0 mi
Show comp detail 6 sales within ~0.75 mi
| Address | Dist | Beds/Ba | Sqft | Sold | Price | $/sf | Match |
|---|---|---|---|---|---|---|---|
| 4932 E Highway 98 | 0.12mi | 3/2.0 (+1) | 1,043 (+5%) | 1mo | $157,200 | $151 | 80 |
| 651 S Highway 22A | 0.29mi | 3/1.0 (+1) | 964 (-3%) | 18mo | $69,000 | $72 | 58 |
| 5206 Tiffany Ln | 0.36mi | 3/2.0 (+1) | 1,012 (+2%) | 22mo | $180,000 | $178 | 57 |
| 632 N 11th St | 0.33mi | 2/1.0 | 871 (-12%) | 5mo | $140,000 | $161 | 56 |
| 523 Highline Dr | 0.74mi | 3/2.0 (+1) | 1,058 (+7%) | 3mo | $160,000 | $151 | 46 |
| 4837 S Lakewood Dr | 0.65mi | 2/1.5 | 1,116 (+13%) | 15mo | $166,000 | $149 | 34 |
Match score weights: distance 35% · size 25% · config 20% · recency 20%. Top-matched comps best support the ARV.
Projected returns pro-forma
-3.0% appreciation · 1.12% rent growth · sell at horizon
- IRR
- 9.8%
- Equity multiple
- 1.38×
- Total profit
- $10,231
- Equity at exit
- $14,463
- IRR
- 17.3%
- Equity multiple
- 2.31×
- Total profit
- $35,448
- Equity at exit
- $8,387
Cash invested: $27,160 (down + closing). Projections, not guarantees.
Landlord ↔ Tenant lean methodology
- Overall (STATE)
- 87 Strongly Landlord-Friendly
- State Florida
- 87 Strongly Landlord-Friendly · R+3
- County
- — inherits STATE
- City
- — inherits STATE
ZIP-level market 32404
- Home prices YoY
- -16.1%
- Rents YoY
- 1.1%
- Active inventory
- 969
- Price-to-rent
- 5.8×
Monthly cashflow live
- Estimated rent
- $1,397 high interval (Pro) →
- Mortgage (P&I)
- −$509
- Tax from tax record
- −$106 /mo · $1,276/yr
- Insurance
- −$40
- HOA
- −$0
- Vacancy / Maint / Mgmt
- −$293
- Net cashflow
- $448
Break-even live
Sensitivity live
| Price | -10% $503 | -5% $475 | +0% $448 | +5% $421 | +10% $393 |
|---|---|---|---|---|---|
| Rent | -10% $338 | -5% $393 | +0% $448 | +5% $503 | +10% $558 |
| Rate | -1.0pp $497 | -0.5pp $473 | base $448 | +0.5pp $423 | +1.0pp $397 |
UW: 25.0% down · 7.5% · 30yr · 1.5% tax · 5.0% vac · 8.0% maint · 8.0% mgmt
Financing live
Cash to close
- Down payment
- $24,250
- Closing costs
- $2,910
- Reserves months
- —
- Total cash needed
- —
Loan-product check · same deal, 3 products live
Conventional
25% down · 7.5% · 30yr
- Down + closing
- —
- Monthly P&I
- —
- Monthly cashflow
- —
- DSCR
- —
- Eligible?
- —
Personal DTI + credit; lowest rate.
DSCR
20% down · 8.5% · 30yr
- Down + closing
- —
- Monthly P&I
- —
- Monthly cashflow
- —
- DSCR
- —
- Eligible?
- —
No personal income docs; deal must DSCR.
Hard money
10% down · 12.0% · 12mo
- Down + closing
- —
- Monthly P&I
- —
- Monthly cashflow
- —
- DSCR
- —
- Eligible?
- —
Short-term bridge; refi at stabilization.
Rent comps 15 comps
| Address | Beds | Baths | Sqft | Rent | $/sqft | DOM | Units | Dist |
|---|---|---|---|---|---|---|---|---|
| 543 N 9th St Unit 543 Panama City, FL | 2.0 | 1.0 | 850 | $1,195 | $1.41 | 14d | 1 | 0.45mi |
| 4828 Grimes St #3 Panama City, FL | 2.0 | 1.0 | 850 | $1,150 | $1.35 | 22d | 1 | 0.46mi |
| 4837 S Lakewood Dr Panama City, FL | 2.0 | 1.5 | 1116 | $1,500 | $1.34 | 22d | 1 | 0.64mi |
| 1128 S Gay Ave Lot N Panama City, FL | 3.0 | 2.0 | 924 | $40,000 | $43.29 | 22d | 1 | 0.71mi |
| 4480 East Highway 98 Unit 1 Panama City, FL | 2.0 | 1.5 | 972 | $1,250 | $1.29 | 22d | 1 | 0.77mi |
| 4480 E Highway 98 Panama City, FL | 2.0 | 1.0 | 972 | $1,250 | $1.29 | 22d | 1 | 0.77mi |
| 322 S Burkett Dr Panama City, FL | 1.0–2.0 | 1.0–2.0 | 600 | $1,519 | $2.53 | 14d | 13 | 0.84mi |
| 149 North Highway 22 A Unit 5 Panama City, FL | 2.0 | 1.0 | 900 | $1,140 | $1.27 | 14d | 1 | 1.15mi |
| 108 N Anita Dr Callaway, FL | 1.0 | 1.0 | 700 | $1,200 | $1.71 | 22d | 1 | 1.18mi |
| 5805 Cherry St Panama City, FL | 2.0 | 1.0 | 1025 | $1,200 | $1.17 | 14d | 1 | 1.19mi |
| 208 North Highway 22 A Unit 33 Panama City, FL | 3.0 | 2.0 | 1080 | $1,350 | $1.25 | 22d | 1 | 1.29mi |
| 6600 Oakshore Dr Panama City, FL | 1.0–3.0 | 1.0–2.0 | 1002 | $1,938 | $1.93 | 14d | 57 | 1.40mi |
| 5101 Willow St Panama City, FL | 3.0 | 2.0 | 1099 | $1,500 | $1.36 | 14d | 1 | 1.42mi |
| 719 S Berthe Ave Unit 8 Panama City, FL | 2.0 | 1.0 | 910 | $1,000 | $1.10 | 22d | 1 | 1.43mi |
| 4905 Alameda St Unit 1 Panama City, FL | 3.0 | 2.0 | 942 | $1,295 | $1.37 | 22d | 1 | 1.47mi |
Listing history 23 events
-
2026-06-19days on market $97,000 Active 77 DOM
-
2026-06-18remarks 469-char remark
-
2026-06-18price $97,000 Active 76 DOM
-
2026-06-18days on market $99,900 Active 76 DOM
-
2026-06-17days on market $99,900 Active 75 DOM
-
2026-06-16days on market $99,900 Active 74 DOM
-
2026-06-15days on market $99,900 Active 73 DOM
-
2026-06-14days on market $99,900 Active 71 DOM
-
2026-06-13days on market $99,900 Active 70 DOM
-
2026-06-10days on market $99,900 Active 68 DOM
-
2026-06-09days on market $99,900 Active 67 DOM
-
2026-06-08days on market $99,900 Active 66 DOM
-
2026-06-07days on market $99,900 Active 65 DOM
-
2026-06-05days on market $99,900 Active 62 DOM
-
2026-06-03days on market $99,900 Active 61 DOM
-
2026-06-02days on market $99,900 Active 60 DOM
-
2026-06-01days on market $99,900 Active 59 DOM
-
2026-05-31days on market $99,900 Active 58 DOM
-
2026-05-30days on market $99,900 Active 57 DOM
-
2026-04-03$129,000 Active 423-char remark
Show marketing remark (423 chars)
3 bedroom, 2 bathroom ''diamond in the rough'' home(in need of total renovation)on a little bit more than a half acre lot!! The zoning is both residential and commercial, so you could turn this home into a business as well. With some vision this property could become an incredible dream home or a great business on a highly traveled major road. All information is approximate and should be verified by buyers if important
-
2008-02-15soldstatus $120,000
-
2001-09-03soldstatus $36,000 184-char remark
Show marketing remark (184 chars)
HOUSE SOLD AS IS!FIXER UPPER, NEEDS SOME WORK ON INSIDE BUT OUTSIDE IS IN GOOD CONDITION, ROOF ONLY 4 YEARS AND BEEN REPAINTED RECENTLY. HUGE WORKSHOP, CAN BE USED FOR COMMERCIAL ALSO.
-
2001-02-16$43,000 184-char remark
Show marketing remark (184 chars)
HOUSE SOLD AS IS!FIXER UPPER, NEEDS SOME WORK ON INSIDE BUT OUTSIDE IS IN GOOD CONDITION, ROOF ONLY 4 YEARS AND BEEN REPAINTED RECENTLY. HUGE WORKSHOP, CAN BE USED FOR COMMERCIAL ALSO.
ⓘ Source: listings_history table (triggers on properties + properties_extension) + one-shot
backfill from property_details.listing_events for pre-trigger history.
Tax reassessment forecast FL · Resets to sale price
- Current annual tax
- $1,276 · $106/mo
- Projected year-2 tax
- $1,276 · $106/mo
- Expected delta
- $0/yr ($0/mo · 0.0%)
ⓘ Screening estimate from a state-policy table — verify with the county assessor before closing.
Climate risk First Street
- Flood 3/10 Moderate FEMA zone X (unshaded) · 14% chance over 30 yrs
- Wildfire 1/10 Low
- Heat 10/10 Extreme 7 d/yr ≥104°F today · 21 d/yr by 30 yrs out
- Wind 9/10 Extreme 99% chance of damaging wind over 30 yrs
- Air quality 1/10 Low 0 unhealthy d/yr today · 0 by 30 yrs out
Nearby sold comps map
Loading sold comps map…
Walkable amenities ~0.75 mi
Loading nearby amenities…
Taxation est. · year 1
- Rental income
- $16,760
- − Mortgage interest
- −$5,434
- − Property taxes
- −$1,276
- − Insurance
- −$485
- − Repairs & maintenance
- −$1,341
- − Management
- −$1,341
- − Depreciation
- −$2,822
- Taxable income
- $4,062
- Est. tax owed @ 24.0%
- −$975
- After-tax cash flow
- $4,401/yr
For passive investors: Depreciation is non-cash, so a rental often shows a tax loss while cash-flowing — sheltering income. Rental losses are passive: they offset passive income freely, and up to $25,000/yr can offset ordinary (W-2) income if you actively participate and your MAGI is under $100k (phasing out to $0 by $150k); unused losses carry forward. On sale, claimed depreciation is recaptured at up to 25%, and gains may owe capital-gains tax (a 1031 exchange can defer both). Figures are a year-1 estimate at your 24.0% rate — not tax advice; consult a CPA.
Schools (NCES district)
- District
- Bay
- NCES district ID
- 1200090
- Math proficiency
- 51% ▼ -8.00%
- Reading proficiency
- 51% ▼ -7.00%
- Median HH income
- $47,740
- Composite
- 43.41/100
- National rank
- #3014
- State rank
- #29 of 73 in FL
Livability — Parker
- Score
- 63/100
- State rank
- #704
- US rank
- #14956
Category grades
Schools grade is shown separately in the Schools card above.
Census & demographics
- Census place
- Parker, FL
- County
- Bay County · 163,593 people
- Metro
- Panama City, FL
- Population (ZIP)
- 42,514
- Household income
- $74,708
- Rent vs Own
- Severe rent burden
- 1218.0
Population outlook (Bay County) Hauer SSP2
- Today (2025)
- 206,264 people
- By 2030
- 217,740 · +5.6%
- By 2040
- 238,738 · +15.7%
- By 2050
- 255,545 · +23.9%
- By 2075
- 288,295 · +39.8%
- By 2100
- 288,638 · +39.9%
Race, ethnicity, and origin ACS 2023
- Neighborhood character
- Predominantly White (69%)
- Race & ethnicity
- White 69% Black 12% Two or more races 10% Hispanic / Latino 9% Asian 3%
- Hispanic origin (detail)
- Mexican 2% Puerto Rican 3%
- Common ancestry
- Lithuanian 3% Slovak 2% Italian 2%
- Foreign-born
- 7% · Canada, Vietnam, Mexico
- Languages at home
- 90% English-only · Spanish 6% Vietnamese 1% Other Asian/Pacific 1%
Political lean MEDSL · Bay
- 2024 margin
- Solid R (+47.4) · D 25.8% · R 73.1% · Other 1.1%
- 2008→2024 swing
- -6.6pp toward R · 2008: -40.7pp · 2024: -47.4pp
- All cycles
- 2024: R+47.4 2020: R+43.5 2016: R+46.3 2012: R+43.6 2008: R+40.7
Not yet ingested
- Civics
- —
Market trends
- HPI YoY
- ▼ -50.59%
- Current HPI
- 263.7178
- Rent YoY
- ▲ 1.12%
- Metro
- Panama City, FL
- State GDP YoY
- ▲ 3.28%
- F500 in state
- 36
Industry mix (Fortune 500 HQ in FL)
| Industry | F500 HQs | Revenue |
|---|---|---|
| Industrial Technology | 2 | $29B |
|
||
| Insurance | 2 | $17B |
|
||
| Retail | 1 | $60B |
|
||
| Technology Distribution | 1 | $58B |
|
||
| Homebuilding | 1 | $35B |
|
||
| Technology Manufacturing | 1 | $35B |
|
||
Price history
+200.0% since first listed4 events — show timeline
- 2026-04-03 Listed $129,000 CPARMLS
- 2008-02-15 Sold (Public Records) $120,000 Public Records
- 2001-09-03 Sold (MLS) $36,000 CPARMLS
- 2001-02-16 Listed $43,000 CPARMLS
Property tax history
+8.8%/yrLatest (2025): $1,276 · +8.3% YoY. Source: county tax records.
Cash-flow waterfall
monthlySold comps — $/sqft
last 12 mo · ≤1 miLoading sold comps…