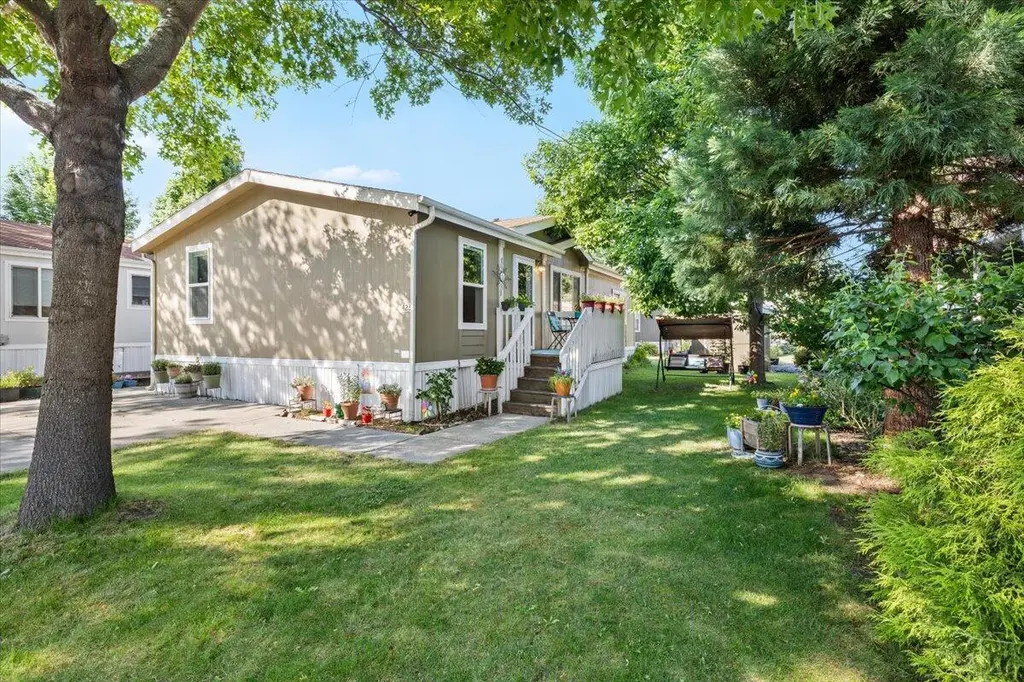
10 E South Stage Rd Spc 423 · Medford, OR
Flood risk 1/10 · Minimal
- FEMA flood zone
- X (unshaded)
- Chance of flooding over 30 yrs
- 0.0%
- Est. flood insurance / yr
- $507 – $1,088
Fire risk 7/10 · Major
- Est. fire insurance / yr
- $498 – $926
Heat risk 6/10 · Moderate
- Hot days now (above 97°F)
- 7 days/yr
- Hot days in 30 yrs
- 15 days/yr
Wind risk 1/10 · Minimal
- Chance of severe wind over 30 yrs
- —
Air-quality risk 10/10 · Severe
- Unhealthy air days now
- 27 days/yr
- Unhealthy air days in 30 yrs
- 30 days/yr
Risk factors via First Street. Map © Google.
Why this score? — see what drove the C+ grade
The composite is a weighted blend of 9 inputs, each scored 0–100. Each bar is that input's sub-score; the figure is the points it added to the 100-point composite (weight × sub-score).
- Cash flow +30.0/30.0
- 1% rule +10.0/10.0
- DSCR +10.0/10.0
- Livability +3.8/5.0
- Rent growth +3.1/5.0
- Condition / age +2.5/5.0
- Schools +1.9/10.0
- ARV discount +0.0/15.0
- Appreciation +0.0/10.0
$119,000
🖨 Deal sheet 📄 Offer letter ✓ Due diligence
Listing remarks MLS
Beautiful 3 bedroom home in the desirable San George Estates. Pride of ownership shines throughout this home. Enter into a spacious open floorplan with warm colors and custom stone feature wall. The large Master Bedroom features a walk in closet and private bath. The kitchen is spacious with plenty of storage and counter top space. Updated vinyl windows throughout allow plenty of natural light. The low maintenance yard features a well constructed shed for extra storage. San George Estates is meticulously maintained and offers a Beautiful pool as well a recreation/community room. Just minutes from shopping and walking distance to the Bear Creek Greenway. Includes 1 year First American Home Warranty!
Key facts
- Master suite
- Walk-in closet
- Big open kitchen
Tags
Property features AI
Finance
- Other: Flood status: unknown; Short-term rentals not permitted; Not rented
- Financial info: Monthly land lease of 920
- HOA & community: Playground in the community
Exterior
- Parking: Driveway
- Security: No audio or video surveillance on premises
- Utilities: Public water; Public sewer; Electricity connected
- Home design: Mobile home in park; Double wide; One level; May remain in park; Located on leased land
- Construction: Built in 2003; Block or other/unknown foundation; Vinyl skirting; Manufactured by Redman/Champion
- Exterior features: Composition roof; Shed(s); Vinyl window frames; Carbon monoxide detector(s); Smoke detector(s)
Interior
- Kitchen: Cooktop; Oven; Range; Dishwasher; Disposal; Refrigerator; Laminate counters; Breakfast nook
- Bedrooms: 3 bedrooms (includes primary bedroom)
- Flooring: Laminate flooring; Vinyl flooring
- Bathrooms: 2 full bathrooms
- Heating & cooling: Electric heating; Central air
- Interior features: Open floor plan; Primary bedroom on main level; Shower/tub combo; Walk-in closet(s); Electric fireplace
- Laundry & utility: Washer; Dryer; Water heater; Laundry room
Neighborhood map
What this means for you Summary
Snapshot
- This is a 3-bed/1.0-bath land listed at $119k.
Deal economics
- At list price, monthly cash flow is $701 ($8k/yr) — positive.
- The deal already cash-flows at list — no discount required.
- Meets the 1% rule at list price ($2k rent vs $119k).
- Recommended offer: $115k (3.0% below list) — sets the bar for market timing.
- Cap rate 13.4% vs local median 2.8% in Medford — top-decile yield for the area; either an underpriced asset or a hidden risk that comps aren't pricing in. Stress-test before assuming the spread holds.
Location & tenants
- Location reads 76/100 on livability (#78 in OR, #3,467 nationally) — a middle-class / working-renter tenant base. Strengths: commute A+, health & safety A+, amenities A-; Watch: employment D+, crime F.
- Phoenix-Talent SD 4 (suburban): math 14% / reading 32% proficiency, ranked #58 of 58 in OR (top 100%) — low school quality limits family demand, transient renter base, plan for 1-2y turnover.
- Zoned schools: Orchard Hill Elementary School (math 24% / reading 24%, grade F, #320 of 412 statewide, top 82%, 345 students, 78% FRL); Talent Middle School (math 10% / reading 33%, grade F, #122 of 128 statewide, top 95%, 473 students, 79% FRL); Phoenix High School (math 24% / reading 70%, grade D-, #56 of 143 statewide, top 41%, 700 students, 79% FRL) — zoned schools average 79% FRL vs 60% district-wide (19 pts higher); higher-poverty schools than district average — tighter screening recommended.
- Market conditions: Rents rising (+2.5%/yr); 70 active listings in the ZIP; 7 comparable units currently listed for rent nearby; rentals at typical pace (median 21d on market — plan ~3-4 weeks tenant-placement turnaround); 43% of comp listings sitting > 30 days — soft ceiling on asking rent; 904 units permitted in Jackson County in 2024 (212 in 5+ unit buildings).
- This rent runs 34% of the median local income ($64k/yr) — at the standard rent-burdened threshold; future hikes will face affordability resistance.
Forward outlook
- Local home prices are declining (-3.0%/yr); year-one equity from $823 of loan paydown is wiped out by about $4k of value loss. Plan a longer hold.
- Jackson County population projected at +17% by 2050 — long-run rental-demand tailwind backs the buy-and-hold thesis.
- At projected returns (-3.0% appreciation + 2.5% rent growth), your $33k cash investment doubles in ~5 years — after that, you're playing with house money.
Negotiation context
- It's been on market 56 days — a 3% lower offer ($115k) is reasonable based on typical stale-listing flexibility.
- 7 sale attempts since 20y ago with the ask held roughly flat each time — persistent listings suggest the price (not the market) is what's stuck; bring a comps-based counter.
- Current owner paid $81k; 47% above their basis — modest negotiation headroom, anchor on the comps not their cost.
Risks & watch-outs
- Climate carrying-cost: major wildfire risk; extreme-heat days projected 7→15/yr by 2055 (HVAC capex compounding) — expect insurance premiums to compound above CPI over the hold.
Questions for the listing agent
- It's been on market 56 days. Have you received any prior offers? Is the seller open to a 3% concession, seller financing, or rate buy-down credit?
- Is there a deadline driving the sale (1031 exchange, divorce, estate, relocation)? That informs how much negotiation room exists.
- Crime grade is F in this area — have there been break-ins, vandalism, or insurance claims at this property in the last 3 years? What carrier currently insures it and at what premium?
- What's the average days-on-market for RENTAL listings here right now (not sales)? A rising rental-DOM trend means longer vacancies and softer asking-rent achievability than the comps imply.
- What's the recent tenant-quality profile in this submarket — average credit score on applications, eviction rate, late-payment / NSF rate, and stable-employment percentage? A property-management company in the area should have these aggregated.
- How much new for-sale + rental construction is in the pipeline within 1–3 miles? Heavy new supply typically softens prices + rents 12–24 months out; constrained supply supports both.
Investment metrics
- 1% rule
- 1.51% ✓
- Cap rate
- 13.36%
- Cash-on-cash
- 25.24%
- DSCR
- 2.12
- GRM
- 5.5
CMA / ARV
- ARV (median comp)
- $95,575
- List price
- $119,000
- Delta
- 24.51%
- Verdict
- OVERPRICED
- Comps
- 17 within 1.0 mi
Projected returns pro-forma
-3.0% appreciation · 2.53% rent growth · sell at horizon
- IRR
- 18.2%
- Equity multiple
- 1.73×
- Total profit
- $24,475
- Equity at exit
- $17,743
- IRR
- 26.3%
- Equity multiple
- 3.26×
- Total profit
- $75,206
- Equity at exit
- $10,289
Cash invested: $33,320 (down + closing). Projections, not guarantees.
Landlord ↔ Tenant lean methodology
- Overall (STATE)
- 28 Tenant-Leaning
- State Oregon
- 28 Tenant-Leaning · D+6
- County
- — inherits STATE
- City
- — inherits STATE
ZIP-level market 97501
- Rents YoY
- 2.5%
- Active inventory
- 70
- Price-to-rent
- 5.5×
Monthly cashflow live
- Estimated rent
- $1,791 high interval (Pro) →
- Mortgage (P&I)
- −$624
- Tax from tax record
- −$41 /mo · $489/yr
- Insurance
- −$50
- HOA
- −$0
- Vacancy / Maint / Mgmt
- −$376
- Net cashflow
- $701
Break-even live
UW: 25.0% down · 7.5% · 30yr · 1.5% tax · 5.0% vac · 8.0% maint · 8.0% mgmt
Financing live
Cash to close
- Down payment
- $29,750
- Closing costs
- $3,570
- Reserves months
- —
- Total cash needed
- —
Loan-product check · same deal, 3 products live
Conventional
25% down · 7.5% · 30yr
- Down + closing
- —
- Monthly P&I
- —
- Monthly cashflow
- —
- DSCR
- —
- Eligible?
- —
Personal DTI + credit; lowest rate.
DSCR
20% down · 8.5% · 30yr
- Down + closing
- —
- Monthly P&I
- —
- Monthly cashflow
- —
- DSCR
- —
- Eligible?
- —
No personal income docs; deal must DSCR.
Hard money
10% down · 12.0% · 12mo
- Down + closing
- —
- Monthly P&I
- —
- Monthly cashflow
- —
- DSCR
- —
- Eligible?
- —
Short-term bridge; refi at stabilization.
Rent comps 7 comps
| Address | Beds | Baths | Sqft | Rent | $/sqft | DOM | Units | Dist |
|---|---|---|---|---|---|---|---|---|
| 168 Northridge Ter Medford, OR | 2.0 | 1.5 | 950 | $1,600 | $1.68 | 21d | 1 | 0.69mi |
| 204 Cheryl Ln Unit J Phoenix, OR | 2.0 | 1.5 | 1008 | $1,350 | $1.34 | 43d | 1 | 1.08mi |
| 310 Independence Cir Apt D Phoenix, OR | 2.0 | 1.0 | 850 | $1,595 | $1.88 | 13d | 1 | 1.32mi |
| 110 6th St Phoenix, OR | 3.0 | 1.0 | 1040 | $1,895 | $1.82 | 21d | 1 | 1.36mi |
| 110 6th St Phoenix, OR | 3.0 | 1.0 | 1040 | $1,895 | $1.82 | 13d | 1 | 1.36mi |
| 1001 Olympic Ave Medford, OR | 3.0 | 1.0 | 1100 | $1,795 | $1.63 | 43d | 1 | 1.39mi |
| 3007 Juanipero Way Unit 3007 Medford, OR | 3.0 | 1.0 | 988 | $1,595 | $1.61 | 43d | 1 | 1.41mi |
Listing history 29 events
-
2026-06-19days on market $119,000 Active 56 DOM
-
2026-06-18days on market $119,000 Active 55 DOM
-
2026-06-17days on market $119,000 Active 54 DOM
-
2026-06-16days on market $119,000 Active 53 DOM
-
2026-06-15days on market $119,000 Active 52 DOM
-
2026-06-14days on market $119,000 Active 50 DOM
-
2026-06-13days on market $119,000 Active 49 DOM
-
2026-06-10days on market $119,000 Active 47 DOM
-
2026-06-09days on market $119,000 Active 46 DOM
-
2026-06-08days on market $119,000 Active 45 DOM
-
2026-06-07pricedays on market $119,000 Active 44 DOM
-
2026-06-02days on market $122,000 Active 39 DOM
-
2026-06-01days on market $122,000 Active 38 DOM
-
2026-05-31days on market $122,000 Active 37 DOM
-
2026-05-30days on market $122,000 Active 36 DOM
-
2026-04-22$122,000 Active 957-char remark
-
2025-12-19historical
-
2025-06-27historical Active Under Contract
-
2025-06-27$125,000 Active
-
2020-08-28soldstatus $81,000
Show marketing remark (707 chars)
Beautiful 3 bedroom home in the desirable San George Estates. Pride of ownership shines throughout this home. Enter into a spacious open floorplan with warm colors and custom stone feature wall. The large Master Bedroom features a walk in closet and private bath. The kitchen is spacious with plenty of storage and counter top space. Updated vinyl windows throughout allow plenty of natural light. The low maintenance yard features a well constructed shed for extra storage. San George Estates is meticulously maintained and offers a Beautiful pool as well a recreation/community room. Just minutes from shopping and walking distance to the Bear Creek Greenway. Includes 1 year First American Home Warranty!
-
2020-06-19$82,500
Show marketing remark (707 chars)
Beautiful 3 bedroom home in the desirable San George Estates. Pride of ownership shines throughout this home. Enter into a spacious open floorplan with warm colors and custom stone feature wall. The large Master Bedroom features a walk in closet and private bath. The kitchen is spacious with plenty of storage and counter top space. Updated vinyl windows throughout allow plenty of natural light. The low maintenance yard features a well constructed shed for extra storage. San George Estates is meticulously maintained and offers a Beautiful pool as well a recreation/community room. Just minutes from shopping and walking distance to the Bear Creek Greenway. Includes 1 year First American Home Warranty!
-
2020-04-27historical
-
2020-04-25historical
-
2020-03-31historical
-
2019-12-26$80,000
-
2011-07-29historical
-
2011-03-02$42,000
-
2009-09-28$54,900
-
2006-09-05$59,500
ⓘ Source: listings_history table (triggers on properties + properties_extension) + one-shot
backfill from property_details.listing_events for pre-trigger history.
Tax reassessment forecast OR · Resets to sale price
- Current annual tax
- $489 · $41/mo
- Projected year-2 tax
- $1,154 · $96/mo
- Expected delta
- +$665/yr (+$55/mo · 136.0%)
ⓘ Screening estimate from a state-policy table — verify with the county assessor before closing.
Climate risk First Street
- Flood 1/10 Low FEMA zone X (unshaded) · 0% chance over 30 yrs
- Wildfire 7/10 Severe
- Heat 6/10 Major 7 d/yr ≥97°F today · 15 d/yr by 30 yrs out
- Wind 1/10 Low
- Air quality 10/10 Extreme 27 unhealthy d/yr today · 30 by 30 yrs out
Nearby sold comps map
Loading sold comps map…
Walkable amenities ~0.75 mi
Loading nearby amenities…
Taxation est. · year 1
- Rental income
- $21,498
- − Mortgage interest
- −$6,666
- − Property taxes
- −$489
- − Insurance
- −$595
- − Repairs & maintenance
- −$1,720
- − Management
- −$1,720
- − Depreciation
- −$3,462
- Taxable income
- $6,847
- Est. tax owed @ 24.0%
- −$1,643
- After-tax cash flow
- $6,768/yr
For passive investors: Depreciation is non-cash, so a rental often shows a tax loss while cash-flowing — sheltering income. Rental losses are passive: they offset passive income freely, and up to $25,000/yr can offset ordinary (W-2) income if you actively participate and your MAGI is under $100k (phasing out to $0 by $150k); unused losses carry forward. On sale, claimed depreciation is recaptured at up to 25%, and gains may owe capital-gains tax (a 1031 exchange can defer both). Figures are a year-1 estimate at your 24.0% rate — not tax advice; consult a CPA.
Schools (NCES district)
- District
- Phoenix-Talent SD 4
- NCES district ID
- 4109630
- Math proficiency
- 14% ▼ -9.00%
- Reading proficiency
- 32% ▼ -8.00%
- Median HH income
- $38,625
- Composite
- 19.24/100
- National rank
- #8809
- State rank
- #58 of 58 in OR
Livability — Medford
- Score
- 76/100
- State rank
- #78
- US rank
- #3467
Category grades
Schools grade is shown separately in the Schools card above.
Census & demographics
- Census place
- Medford, OR
- County
- Jackson County · 159,661 people
- City population
- 95,759
- Metro
- Medford, OR
- Population (ZIP)
- 44,670
- Household income
- $63,977
- Rent vs Own
- Severe rent burden
- 1799.0
Population outlook (Jackson County) Hauer SSP2
- Today (2025)
- 234,433 people
- By 2030
- 243,834 · +4.0%
- By 2040
- 259,717 · +10.8%
- By 2050
- 273,269 · +16.6%
- By 2075
- 300,624 · +28.2%
- By 2100
- 305,256 · +30.2%
Race, ethnicity, and origin ACS 2023
- Neighborhood character
- Predominantly White (72%)
- Race & ethnicity
- White 72% Hispanic / Latino 18% Two or more races 16% Black 1%
- Hispanic origin (detail)
- Mexican 15%
- Common ancestry
- Slovak 2% Portuguese 2% Italian 2%
- Foreign-born
- 6% · Canada
- Languages at home
- 88% English-only · Spanish 10%
Political lean MEDSL · Jackson
- 2024 margin
- Lean R (+6.4) · D 45.5% · R 51.9% · Other 2.6%
- 2008→2024 swing
- -6.5pp toward R · 2008: 0.1pp · 2024: -6.4pp
- All cycles
- 2024: R+6.4 2020: R+3.5 2016: R+9.2 2012: R+5.0 2008: D+0.1
Not yet ingested
- Civics
- —
Market trends
- HPI YoY
- ▼ -428.31%
- Current HPI
- 248.6495
- Rent YoY
- ▲ 2.53%
- Metro
- Medford, OR
- State GDP YoY
- ▲ 2.05%
- F500 in state
- 2
Industry mix (Fortune 500 HQ in OR)
| Industry | F500 HQs | Revenue |
|---|---|---|
| Consumer Goods | 1 | $51B |
|
||
Price history
+100.0% since first listed15 events — show timeline
- 2026-06-04 Price Changed $119,000 MLSCO
- 2026-04-22 Listed $122,000 MLSCO
- 2025-12-19 Listing Removed — MLSCO
- 2025-06-27 Contingent — MLSCO
- 2025-06-27 Listed $125,000 MLSCO
- 2020-08-28 Sold (MLS) $81,000 MLSCO
- 2020-06-19 Listed $82,500 MLSCO
- 2020-04-27 Listing Removed — MLSCO
- 2020-04-25 Listing Removed — MLSCO
- 2020-03-31 Listing Removed — MLSCO
- 2019-12-26 Listed $80,000 MLSCO
- 2011-07-29 Listing Removed — MLSCO
- 2011-03-02 Listed $42,000 MLSCO
- 2009-09-28 Listed $54,900 MLSCO
- 2006-09-05 Listed $59,500 MLSCO
Property tax history
-6.2%/yrLatest (2022): $489 · +2.3% YoY. Source: county tax records.
Cash-flow waterfall
monthlySold comps — $/sqft
last 12 mo · ≤1 miLoading sold comps…