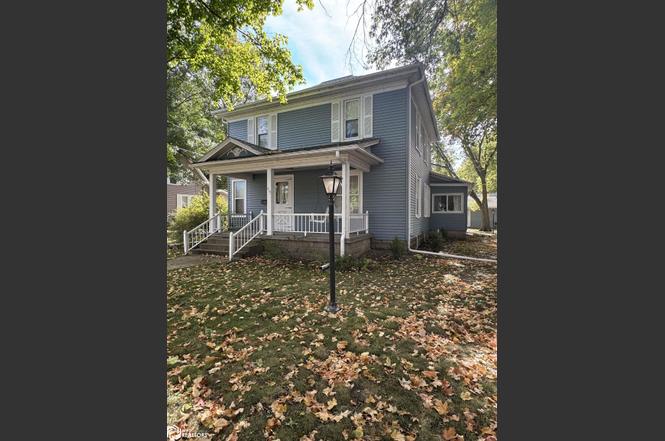
419 Van Buren Street St · Wapello, IA
Flood risk 1/10 · Minimal
- FEMA flood zone
- X (unshaded)
- Chance of flooding over 30 yrs
- 0.0%
- Est. flood insurance / yr
- $473 – $860
Fire risk 2/10 · Minimal
- Est. fire insurance / yr
- $902 – $1,676
Heat risk 3/10 · Minor
- Hot days now (above 106°F)
- 7 days/yr
- Hot days in 30 yrs
- 15 days/yr
Wind risk 2/10 · Minimal
- Chance of severe wind over 30 yrs
- —
Air-quality risk 2/10 · Minimal
- Unhealthy air days now
- 1 days/yr
- Unhealthy air days in 30 yrs
- 2 days/yr
Risk factors via First Street. Map © Google.
Why this score? — see what drove the C- grade
The composite is a weighted blend of 9 inputs, each scored 0–100. Each bar is that input's sub-score; the figure is the points it added to the 100-point composite (weight × sub-score).
- ARV discount +15.0/15.0
- Appreciation +10.0/10.0
- Cash flow +8.1/30.0
- Schools +4.6/10.0
- Livability +3.8/5.0
- 1% rule +2.5/10.0
- Rent growth +2.5/5.0
- Condition / age +2.5/5.0
- DSCR +2.1/10.0
$169,900
🖨 Deal sheet (PDF) 📄 Offer letter ✓ Due diligence
Listing remarks
Very well maintained 2 story house sitting on a corner lot with mature trees to keep you shaded and cool on them hot summer days. 4 bed 2 bath home that has plenty of space for a growing family or just room to get away and get some quite space of your own. this home also has a screened in back porch along with a wood workers hideaway in the detached garage. Wait till you see the size of the storage basement!
Key facts
- Storage basement
- Corner lot
- Mature trees
Tags
Property features AI
Exterior
- Parking: Detached gravel garage with 1 garage space
- Utilities: Public water; Public sewer
- Home design: Two-story single family residence; Metal siding
- Construction: Metal siding construction
- Exterior features: Lot approximately 63 x 149
Interior
- Bathrooms: 2 full bathrooms
- Heating & cooling: Central air conditioning; Forced air heating
- Interior features: Basement
Neighborhood map
What this means for you Summary
Snapshot
- This is a 4-bed/2.0-bath single-family listed at $170k.
Deal economics
- At list price, monthly cash flow is $-167 ($-2k/yr) — negative.
- To cash-flow at today's rent, offer at most $146k (14.2% below list).
- To meet the 1% rule (rent ≥ 1% of price), the offer needs to be $127k (25.0% below list).
- Recommended offer: $127k (25.0% below list) — sets the bar for 1% rule.
Location & tenants
- Location reads 75/100 on livability (#211 in IA, #3,881 nationally) — a middle-class / working-renter tenant base. Strengths: crime A+, cost of living A+, housing A+; Watch: amenities F, commute F.
- Wapello Community School District (rural): math 52% / reading 56% proficiency, ranked #267 of 289 in IA (top 92%) — acceptable for families but not a draw, mixed tenant base, ~2y average lease.
- Zoned schools: Wapello Elementary School (math 62% / reading 57%, grade B-, #390 of 616 statewide, top 69%, 239 students, 28% FRL); Wapello Junior High School (math 42% / reading 52%, grade D+, #228 of 246 statewide, top 93%, 109 students, 42% FRL); Wapello Senior High School (math 57% / reading 57%, grade C, #279 of 336 statewide, top 85%, 193 students, 38% FRL).
- Market conditions: 27 active listings in the ZIP; 9 units permitted in Louisa County in 2024 (0 in 5+ unit buildings).
Forward outlook
- In year one you build about $18k of equity ($1k loan paydown + $17k appreciation (10.0% local appreciation)).
- Louisa County population projected at -11% by 2050 — secular population decline; favor cash flow + early exit over multi-decade hold.
- By year 3, paydown + projected appreciation supports a ~$46k cash-out refi (75% LTV) — recoverable capital for the next deal without selling this one.
Negotiation context
- It's been on market 219 days — a 12% lower offer ($150k) is reasonable based on typical stale-listing flexibility.
Risks & watch-outs
- Watch-outs: built in 1906 — expect roof / HVAC / electrical / plumbing capex.
Questions for the listing agent
- What do current leases actually rent for vs. the listed asking? Can we see a recent rent roll and the last 12 months of T-12 income?
- It's been on market 219 days. Have you received any prior offers? Is the seller open to a 25% concession, seller financing, or rate buy-down credit?
- Built in 1906 — when were the roof, HVAC, electrical panel, plumbing, and water heater last replaced?
- Why hasn't it sold? Are there any deal-killer items the seller is aware of (foundation, flood, title, zoning, code violations)?
- Is there a deadline driving the sale (1031 exchange, divorce, estate, relocation)? That informs how much negotiation room exists.
- What's the average days-on-market for RENTAL listings here right now (not sales)? A rising rental-DOM trend means longer vacancies and softer asking-rent achievability than the comps imply.
- What's the recent tenant-quality profile in this submarket — average credit score on applications, eviction rate, late-payment / NSF rate, and stable-employment percentage? A property-management company in the area should have these aggregated.
- How much new for-sale + rental construction is in the pipeline within 1–3 miles? Heavy new supply typically softens prices + rents 12–24 months out; constrained supply supports both.
Investment metrics
- 1% rule
- 0.75% ✗
- Cap rate
- 5.11%
- Cash-on-cash
- -4.21%
- DSCR
- 0.81
- GRM
- 11.1
CMA / ARV
- ARV (on-the-fly)
- $209,757
- Comps found
- 6
Show comp detail 6 sales within ~0.75 mi
| Address | Dist | Beds/Ba | Sqft | Sold | Price | $/sf | Match |
|---|---|---|---|---|---|---|---|
| 418 S 2nd St | 0.41mi | 3/1.5 (-1) | 2,392 (-1%) | 12mo | $190,000 | $79 | 63 |
| 327 S 2nd St | 0.34mi | 3/3.0 (-1) | 2,181 (-10%) | 2mo | $290,000 | $133 | 58 |
| 745 S 5th St | 0.61mi | 3/1.0 (-1) | 2,550 (+6%) | 3mo | $171,500 | $67 | 50 |
| 304 S Cedar St | 0.36mi | 3/2.0 (-1) | 2,154 (-11%) | 13mo | $187,500 | $87 | 50 |
| 319 S 5th St | 0.35mi | 3/2.0 (-1) | 2,164 (-10%) | 15mo | $154,000 | $71 | 49 |
| 14123 County Road G62 | 0.60mi | 3/2.0 (-1) | 2,494 (+3%) | 19mo | $290,000 | $116 | 46 |
Match score weights: distance 35% · size 25% · config 20% · recency 20%. Top-matched comps best support the ARV.
Projected returns pro-forma
10.0% appreciation · 3.0% rent growth · sell at horizon
- IRR
- 21.3%
- Equity multiple
- 2.72×
- Total profit
- $81,911
- Equity at exit
- $153,059
- IRR
- 19.3%
- Equity multiple
- 6.25×
- Total profit
- $249,621
- Equity at exit
- $330,078
Cash invested: $47,572 (down + closing). Projections, not guarantees.
Landlord ↔ Tenant lean methodology
- Overall (STATE)
- 83 Strongly Landlord-Friendly
- State Iowa
- 83 Strongly Landlord-Friendly · R+6
- County
- — inherits STATE
- City
- — inherits STATE
ZIP-level market 52653
- Home prices YoY
- 13.8%
- Active inventory
- 27
- Price-to-rent
- 11.1×
Monthly cashflow live
- Estimated rent
- $1,275 medium interval (Pro) →
- Mortgage (P&I)
- −$891
- Tax est. 1.5%
- −$212 /mo · $2,548/yr
- Insurance
- −$71
- HOA
- −$0
- Lot rent
- −$0
- Vacancy / Maint / Mgmt
- −$268
- Net cashflow
- $-167
Break-even live
Sensitivity live
| Price | -10% $-50 | -5% $-108 | +0% $-167 | +5% $-226 | +10% $-284 |
|---|---|---|---|---|---|
| Rent | -10% $-268 | -5% $-217 | +0% $-167 | +5% $-117 | +10% $-66 |
| Rate | -1.0pp $-81 | -0.5pp $-124 | base $-167 | +0.5pp $-211 | +1.0pp $-256 |
UW: 25.0% down · 7.5% · 30yr · 1.5% tax · 5.0% vac · 8.0% maint · 8.0% mgmt
Financing live
Cash to close
- Down payment
- $42,475
- Closing costs
- $5,097
- Reserves months
- —
- Total cash needed
- —
Loan-product check · same deal, 3 products live
Conventional
25% down · 7.5% · 30yr
- Down + closing
- —
- Monthly P&I
- —
- Monthly cashflow
- —
- DSCR
- —
- Eligible?
- —
Personal DTI + credit; lowest rate.
DSCR
20% down · 8.5% · 30yr
- Down + closing
- —
- Monthly P&I
- —
- Monthly cashflow
- —
- DSCR
- —
- Eligible?
- —
No personal income docs; deal must DSCR.
Hard money
10% down · 12.0% · 12mo
- Down + closing
- —
- Monthly P&I
- —
- Monthly cashflow
- —
- DSCR
- —
- Eligible?
- —
Short-term bridge; refi at stabilization.
Listing history 5 events
-
2026-05-15status Pending
-
2026-05-01historical Active Under Contract
-
2026-04-05price $169,900
-
2025-11-01price $199,000
-
2025-10-06$224,900 Active
ⓘ Source: listings_history table (triggers on properties + properties_extension) + one-shot
backfill from property_details.listing_events for pre-trigger history.
Climate risk First Street
- Flood 1/10 Low FEMA zone X (unshaded) · 0% chance over 30 yrs
- Wildfire 2/10 Low
- Heat 3/10 Moderate 7 d/yr ≥106°F today · 15 d/yr by 30 yrs out
- Wind 2/10 Low
- Air quality 2/10 Low 1 unhealthy d/yr today · 2 by 30 yrs out
Nearby sold comps map
Loading sold comps map…
Walkable amenities ~0.75 mi
Loading nearby amenities…
Taxation est. · year 1
- Rental income
- $15,297
- − Mortgage interest
- −$9,517
- − Property taxes
- −$2,548
- − Insurance
- −$850
- − Repairs & maintenance
- −$1,224
- − Management
- −$1,224
- − Depreciation
- −$4,943
- Taxable loss
- −$5,008
- Est. tax savings @ 24.0%
- +$1,202
- After-tax cash flow
- $-803/yr
For passive investors: Depreciation is non-cash, so a rental often shows a tax loss while cash-flowing — sheltering income. Rental losses are passive: they offset passive income freely, and up to $25,000/yr can offset ordinary (W-2) income if you actively participate and your MAGI is under $100k (phasing out to $0 by $150k); unused losses carry forward. On sale, claimed depreciation is recaptured at up to 25%, and gains may owe capital-gains tax (a 1031 exchange can defer both). Figures are a year-1 estimate at your 24.0% rate — not tax advice; consult a CPA.
Schools (NCES district)
- District
- Wapello Community School District
- NCES district ID
- 1929730
- Math proficiency
- 52% ▲ 2.00%
- Reading proficiency
- 56% ▼ -2.00%
- Median HH income
- $49,857
- Composite
- 46.08/100
- National rank
- #2515
- State rank
- #267 of 289 in IA
Livability — Wapello
- Score
- 75/100
- State rank
- #211
- US rank
- #3881
Category grades
Schools grade is shown separately in the Schools card above.
Census & demographics
- Census place
- Wapello, IA
- Population (ZIP)
- 3,203
Population outlook (Louisa County) Hauer SSP2
- Today (2025)
- 11,061 people
- By 2030
- 10,869 · -1.7%
- By 2040
- 10,400 · -6.0%
- By 2050
- 9,878 · -10.7%
- By 2075
- 9,425 · -14.8%
- By 2100
- 9,584 · -13.4%
Race, ethnicity, and origin ACS 2023
- Neighborhood character
- Predominantly White (85%)
- Race & ethnicity
- White 85% Hispanic / Latino 9% Two or more races 6%
- Hispanic origin (detail)
- Mexican 9%
- Common ancestry
- Slovak 4% Lithuanian 2% Iranian 2%
- Foreign-born
- 3% · Canada
- Languages at home
- 94% English-only · Spanish 6%
Political lean MEDSL · Louisa
- 2024 margin
- Solid R (+41.0) · D 28.8% · R 69.8% · Other 1.4%
- 2008→2024 swing
- -45.2pp toward R · 2008: 4.2pp · 2024: -41.0pp
- All cycles
- 2024: R+41.0 2020: R+33.3 2016: R+28.7 2012: D+0.7 2008: D+4.2
Not yet ingested
- Civics
- —
Market trends
- HPI YoY
- ▲ 23.33%
- Current HPI
- 192.9
- Rent YoY
- —
- Metro
- —
- State GDP YoY
- ▲ 2.48%
- F500 in state
- 4
Industry mix (Fortune 500 HQ in IA)
| Industry | F500 HQs | Revenue |
|---|---|---|
| Financial Services | 1 | $16B |
|
||
| Retail / Convenience | 1 | $15B |
|
||
Price history
-24.5% since first listed5 events — show timeline
- 2026-05-15 Pending — IAR
- 2026-05-01 Contingent — IAR
- 2026-04-05 Price Changed $169,900 IAR
- 2025-11-01 Price Changed $199,000 IAR
- 2025-10-06 Listed $224,900 IAR
Cash-flow waterfall
monthlySold comps — $/sqft
last 12 mo · ≤1 miLoading sold comps…