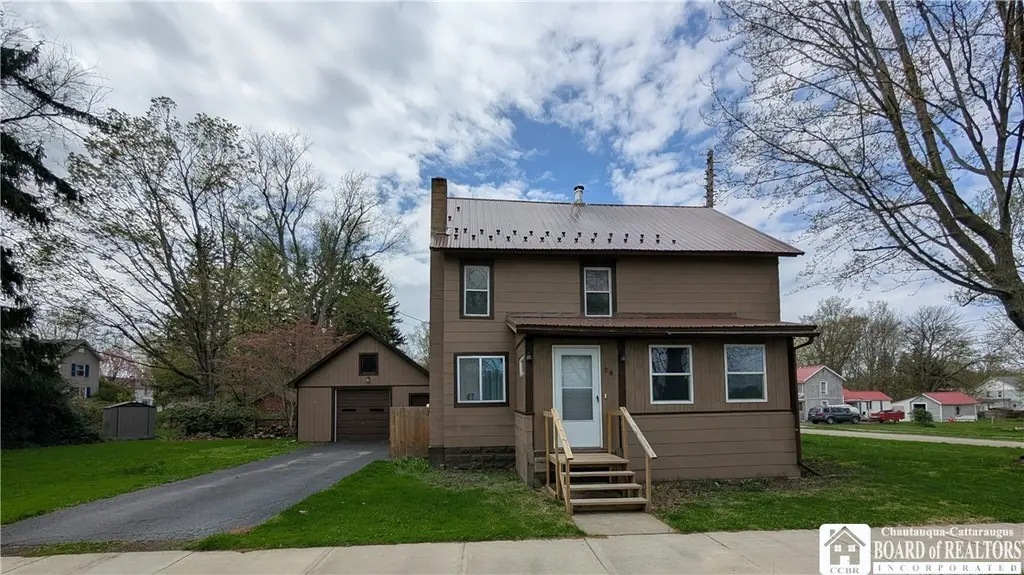
36 Fay St · Brocton, NY
Flood risk 1/10 · Minimal
- FEMA flood zone
- —
- Chance of flooding over 30 yrs
- 0.0%
- Est. flood insurance / yr
- —
Fire risk 1/10 · Minimal
- Est. fire insurance / yr
- $691 – $1,283
Heat risk 2/10 · Minimal
- Hot days now (above 92°F)
- 7 days/yr
- Hot days in 30 yrs
- 16 days/yr
Wind risk 1/10 · Minimal
- Chance of severe wind over 30 yrs
- —
Air-quality risk 2/10 · Minimal
- Unhealthy air days now
- 1 days/yr
- Unhealthy air days in 30 yrs
- 2 days/yr
Risk factors via First Street. Map © Google.
Why this score? — see what drove the D grade
The composite is a weighted blend of 9 inputs, each scored 0–100. Each bar is that input's sub-score; the figure is the points it added to the 100-point composite (weight × sub-score).
- ARV discount +15.0/15.0
- Cash flow +7.8/30.0
- Appreciation +4.0/10.0
- Livability +3.2/5.0
- 1% rule +2.9/10.0
- Rent growth +2.5/5.0
- Condition / age +2.5/5.0
- Schools +2.3/10.0
- DSCR +1.9/10.0
$149,900
🖨 Deal sheet (PDF) 📄 Offer letter ✓ Due diligence
Listing remarks MLS
Very nice home on a corner lot. Three bedroom 1 1/2 with laundry in the basement and on the first floor. This home is Move-In ready. Enclosed front porch off of dining room, with an open living room, laminate flooring throughout. The garage has an upstairs loft with plenty of extra storage.
Key facts
- Ductwork
- New furnace
- Sump pump
Tags
Property features AI
Exterior
- Parking: Detached garage (1 car)
- Utilities: Electricity connected; Public water connected; Sewer connected
- Home design: 2 stories; Existing construction
- Construction: Shake siding; Metal roof; Stone foundation
- Exterior features: Blacktop driveway; Corner lot; Rectangular lot
Interior
- Kitchen: Appliances negotiable
- Bedrooms: Total rooms: 8
- Flooring: Vinyl; Varies
- Bathrooms: 1 full bathroom; 1 half bathroom; One main-level bathroom
- Heating & cooling: Gas forced-air heating; Central air conditioning
- Interior features: Entrance foyer; Sunroom; Sitting room; See remarks / other
- Laundry & utility: Laundry on main level; Laundry in basement; Gas water heater
Neighborhood map
What this means for you Summary
Snapshot
- This is a 3-bed/1.5-bath single-family listed at $150k.
Deal economics
- At list price, monthly cash flow is $-164 ($-2k/yr) — negative.
- To cash-flow at today's rent, offer at most $121k (19.3% below list).
- To meet the 1% rule (rent ≥ 1% of price), the offer needs to be $119k (20.9% below list).
- Recommended offer: $119k (20.9% below list) — sets the bar for 1% rule.
Location & tenants
- Location reads 63/100 on livability (#805 in NY) — a middle-class / working-renter tenant base. Strengths: cost of living A+, housing A+, crime A-; Watch: schools F, amenities F, commute F.
- Brocton Central School District (rural): math 24% / reading 30% proficiency, ranked #584 of 590 in NY (top 99%) — low school quality limits family demand, transient renter base, plan for 1-2y turnover.
- Market conditions: 12 active listings in the ZIP; 127 units permitted in Chautauqua County in 2024 (0 in 5+ unit buildings).
Forward outlook
- Local home prices are declining (-1.9%/yr); year-one equity from $1k of loan paydown is wiped out by about $3k of value loss. Plan a longer hold.
- Chautauqua County population projected at -22% by 2050 — secular population decline; favor cash flow + early exit over multi-decade hold.
Negotiation context
- It's been on market 37 days — a 3% lower offer ($145k) is reasonable based on typical stale-listing flexibility.
- 2 sale attempts since 4y ago with the ask held roughly flat each time — persistent listings suggest the price (not the market) is what's stuck; bring a comps-based counter.
- Current owner paid $90k; list at $150k implies a 67% gain — meaningful room to come down on a strong offer.
Risks & watch-outs
- Watch-outs: built in 1900 — expect roof / HVAC / electrical / plumbing capex.
Questions for the listing agent
- What do current leases actually rent for vs. the listed asking? Can we see a recent rent roll and the last 12 months of T-12 income?
- It's been on market 37 days. Have you received any prior offers? Is the seller open to a 21% concession, seller financing, or rate buy-down credit?
- Built in 1900 — when were the roof, HVAC, electrical panel, plumbing, and water heater last replaced?
- Is there a deadline driving the sale (1031 exchange, divorce, estate, relocation)? That informs how much negotiation room exists.
- Schools are F-rated, which usually means shorter tenancies and higher turnover. Who's the typical renter profile here, and what's been the actual vacancy rate?
- The area grade is low — what's the realistic commute time and amenity access for the typical tenant pool here? Any planned neighborhood developments (good or bad) we should know about?
- What's the average days-on-market for RENTAL listings here right now (not sales)? A rising rental-DOM trend means longer vacancies and softer asking-rent achievability than the comps imply.
- What's the recent tenant-quality profile in this submarket — average credit score on applications, eviction rate, late-payment / NSF rate, and stable-employment percentage? A property-management company in the area should have these aggregated.
- How much new for-sale + rental construction is in the pipeline within 1–3 miles? Heavy new supply typically softens prices + rents 12–24 months out; constrained supply supports both.
Investment metrics
- 1% rule
- 0.79% ✗
- Cap rate
- 4.98%
- Cash-on-cash
- -4.68%
- DSCR
- 0.79
- GRM
- 10.5
CMA / ARV
- ARV (median comp)
- $196,470
- List price
- $149,900
- Delta
- -23.70%
- Verdict
- UNDERPRICED
- Comps
- 18 within 1.0 mi
Show comp detail 6 sales within ~0.75 mi
| Address | Dist | Beds/Ba | Sqft | Sold | Price | $/sf | Match |
|---|---|---|---|---|---|---|---|
| 46 Smith St | 0.15mi | 3/1.0 | 1,394 (-3%) | 5mo | $135,000 | $97 | 82 |
| 54 Kinney St | 0.19mi | 3/1.5 | 1,521 (+6%) | 4mo | $104,940 | $69 | 79 |
| 24 Park St | 0.05mi | 3/1.0 | 1,633 (+13%) | 7mo | $162,500 | $100 | 68 |
| 31 Central Ave | 0.18mi | 3/1.0 | 1,590 (+10%) | 9mo | $127,500 | $80 | 65 |
| 136 E Main St | 0.56mi | 3/2.0 | 1,476 (+2%) | 11mo | $195,000 | $132 | 59 |
| 28 Kinney St | 0.10mi | 4/1.0 (+1) | 1,630 (+13%) | 10mo | $77,250 | $47 | 58 |
Match score weights: distance 35% · size 25% · config 20% · recency 20%. Top-matched comps best support the ARV.
Projected returns pro-forma
-1.93% appreciation · 3.0% rent growth · sell at horizon
- IRR
- -16.9%
- Equity multiple
- 0.34×
- Total profit
- $-27,807
- Equity at exit
- $29,629
- IRR
- -9.8%
- Equity multiple
- 0.26×
- Total profit
- $-31,266
- Equity at exit
- $25,815
Cash invested: $41,972 (down + closing). Projections, not guarantees.
Landlord ↔ Tenant lean methodology
- Overall (STATE)
- 15 Strongly Tenant-Friendly
- State New York
- 15 Strongly Tenant-Friendly · D+10
- County
- — inherits STATE
- City
- — inherits STATE
ZIP-level market 14716
- Home prices YoY
- -0.6%
- Active inventory
- 12
- Price-to-rent
- 10.5×
Monthly cashflow live
- Estimated rent
- $1,186 medium interval (Pro) →
- Mortgage (P&I)
- −$786
- Tax from tax record
- −$252 /mo · $3,026/yr
- Insurance
- −$62
- HOA
- −$0
- Vacancy / Maint / Mgmt
- −$249
- Net cashflow
- $-164
Break-even live
Sensitivity live
| Price | -10% $-79 | -5% $-121 | +0% $-164 | +5% $-206 | +10% $-248 |
|---|---|---|---|---|---|
| Rent | -10% $-257 | -5% $-210 | +0% $-164 | +5% $-117 | +10% $-70 |
| Rate | -1.0pp $-88 | -0.5pp $-125 | base $-164 | +0.5pp $-202 | +1.0pp $-242 |
UW: 25.0% down · 7.5% · 30yr · 1.5% tax · 5.0% vac · 8.0% maint · 8.0% mgmt
Financing live
Cash to close
- Down payment
- $37,475
- Closing costs
- $4,497
- Reserves months
- —
- Total cash needed
- —
Loan-product check · same deal, 3 products live
Conventional
25% down · 7.5% · 30yr
- Down + closing
- —
- Monthly P&I
- —
- Monthly cashflow
- —
- DSCR
- —
- Eligible?
- —
Personal DTI + credit; lowest rate.
DSCR
20% down · 8.5% · 30yr
- Down + closing
- —
- Monthly P&I
- —
- Monthly cashflow
- —
- DSCR
- —
- Eligible?
- —
No personal income docs; deal must DSCR.
Hard money
10% down · 12.0% · 12mo
- Down + closing
- —
- Monthly P&I
- —
- Monthly cashflow
- —
- DSCR
- —
- Eligible?
- —
Short-term bridge; refi at stabilization.
Listing history 10 events
-
2026-06-04statusdays on market $149,900 Pending 37 DOM
-
2026-06-02days on market $149,900 Active Under Contract 36 DOM
-
2026-06-01days on market $149,900 Active Under Contract 35 DOM
-
2026-05-31days on market $149,900 Active Under Contract 34 DOM
-
2026-05-04historical Active Under Contract 1181-char remark
-
2026-04-27$149,900 Active 1181-char remark
-
2022-12-19soldstatus $90,000
-
2022-12-16soldstatus $90,000 Closed Sale or Rented 291-char remark
Show marketing remark (291 chars)
Very nice home on a corner lot. Three bedroom 1 1/2 with laundry in the basement and on the first floor. This home is Move-In ready. Enclosed front porch off of dining room, with an open living room, laminate flooring throughout. The garage has an upstairs loft with plenty of extra storage.
-
2022-10-03status Under Contract- Do Not Show 291-char remark
Show marketing remark (291 chars)
Very nice home on a corner lot. Three bedroom 1 1/2 with laundry in the basement and on the first floor. This home is Move-In ready. Enclosed front porch off of dining room, with an open living room, laminate flooring throughout. The garage has an upstairs loft with plenty of extra storage.
-
2022-09-30$89,900 Active 291-char remark
Show marketing remark (291 chars)
Very nice home on a corner lot. Three bedroom 1 1/2 with laundry in the basement and on the first floor. This home is Move-In ready. Enclosed front porch off of dining room, with an open living room, laminate flooring throughout. The garage has an upstairs loft with plenty of extra storage.
ⓘ Source: listings_history table (triggers on properties + properties_extension) + one-shot
backfill from property_details.listing_events for pre-trigger history.
Tax reassessment forecast NY · Partial reset (capped growth)
- Current annual tax
- $3,026 · $252/mo
- Projected year-2 tax
- $3,026 · $252/mo
- Expected delta
- $0/yr ($0/mo · 0.0%)
ⓘ Screening estimate from a state-policy table — verify with the county assessor before closing.
Climate risk First Street
- Flood 1/10 Low 0% chance over 30 yrs
- Wildfire 1/10 Low
- Heat 2/10 Low 7 d/yr ≥92°F today · 16 d/yr by 30 yrs out
- Wind 1/10 Low
- Air quality 2/10 Low 1 unhealthy d/yr today · 2 by 30 yrs out
Nearby sold comps map
Loading sold comps map…
Walkable amenities ~0.75 mi
Loading nearby amenities…
Taxation est. · year 1
- Rental income
- $14,235
- − Mortgage interest
- −$8,397
- − Property taxes
- −$3,026
- − Insurance
- −$750
- − Repairs & maintenance
- −$1,139
- − Management
- −$1,139
- − Depreciation
- −$4,361
- Taxable loss
- −$4,575
- Est. tax savings @ 24.0%
- +$1,098
- After-tax cash flow
- $-864/yr
For passive investors: Depreciation is non-cash, so a rental often shows a tax loss while cash-flowing — sheltering income. Rental losses are passive: they offset passive income freely, and up to $25,000/yr can offset ordinary (W-2) income if you actively participate and your MAGI is under $100k (phasing out to $0 by $150k); unused losses carry forward. On sale, claimed depreciation is recaptured at up to 25%, and gains may owe capital-gains tax (a 1031 exchange can defer both). Figures are a year-1 estimate at your 24.0% rate — not tax advice; consult a CPA.
Schools (NCES district)
- District
- Brocton Central School District
- NCES district ID
- 3605610
- Math proficiency
- 24% ▼ -11.00%
- Reading proficiency
- 30% ▬ 0.00%
- Median HH income
- $39,147
- Composite
- 22.66/100
- National rank
- #8051
- State rank
- #584 of 590 in NY
Livability — Brocton
- Score
- 63/100
- State rank
- #805
- US rank
- #15577
Category grades
Schools grade is shown separately in the Schools card above.
Census & demographics
- Census place
- Brocton, NY
- City population
- 2,343
- Population (ZIP)
- 2,343
Population outlook (Chautauqua County) Hauer SSP2
- Today (2025)
- 123,454 people
- By 2030
- 118,509 · -4.0%
- By 2040
- 107,311 · -13.1%
- By 2050
- 96,703 · -21.7%
- By 2075
- 76,757 · -37.8%
- By 2100
- 60,984 · -50.6%
Race, ethnicity, and origin ACS 2023
- Neighborhood character
- Predominantly White (69%)
- Race & ethnicity
- White 69% Hispanic / Latino 15% Black 10% Two or more races 9% Native American 1%
- Hispanic origin (detail)
- Puerto Rican 12%
- Common ancestry
- Romanian 7% Lithuanian 2% Scotch-Irish 1%
- Foreign-born
- 4% · South Korea, Canada
- Languages at home
- 91% English-only · Spanish 5% Russian/Polish/Slavic 2% German/W. Germanic 1%
Political lean MEDSL · Chautauqua
- 2024 margin
- Strong R (+22.0) · D 39.0% · R 61.0%
- 2008→2024 swing
- -22.9pp toward R · 2008: 0.9pp · 2024: -22.0pp
- All cycles
- 2024: R+22.0 2020: R+19.8 2016: R+24.6 2012: R+8.2 2008: D+0.9
Not yet ingested
- Civics
- —
Market trends
- HPI YoY
- ▼ -1.93%
- Current HPI
- 333.6367
- Rent YoY
- —
- Metro
- —
- State GDP YoY
- ▲ 2.60%
- F500 in state
- 92
Industry mix (Fortune 500 HQ in NY)
| Industry | F500 HQs | Revenue |
|---|---|---|
| Financial Services | 10 | $950B |
|
||
| Consumer Goods | 9 | $162B |
|
||
| Insurance | 4 | $225B |
|
||
| Telecommunications | 2 | $144B |
|
||
| Pharmaceuticals | 2 | $112B |
|
||
| Media / Entertainment | 2 | $69B |
|
||
Price history
+66.7% since first listed7 events — show timeline
- 2026-06-04 Pending — UNYREIS
- 2026-05-04 Contingent — UNYREIS
- 2026-04-27 Listed $149,900 UNYREIS
- 2022-12-19 Sold (Public Records) $90,000 Public Records
- 2022-12-16 Sold (MLS) $90,000 UNYREIS
- 2022-10-03 Pending — UNYREIS
- 2022-09-30 Listed $89,900 UNYREIS
Property tax history
+8.0%/yrLatest (2025): $3,026 · +1.3% YoY. Source: county tax records.
Cash-flow waterfall
monthlySold comps — $/sqft
last 12 mo · ≤1 miLoading sold comps…