3390 Wayne Ave Unit B11 · New York, NY
Flood risk 1/10 · Minimal
- FEMA flood zone
- X (unshaded)
- Chance of flooding over 30 yrs
- 0.0%
- Est. flood insurance / yr
- $507 – $1,088
Fire risk 1/10 · Minimal
- Est. fire insurance / yr
- $691 – $1,283
Heat risk 6/10 · Moderate
- Hot days now (above 99°F)
- 6 days/yr
- Hot days in 30 yrs
- 13 days/yr
Wind risk 6/10 · Moderate
- Chance of severe wind over 30 yrs
- 27.0%
Air-quality risk 3/10 · Minor
- Unhealthy air days now
- 3 days/yr
- Unhealthy air days in 30 yrs
- 4 days/yr
Risk factors via First Street. Map © Google.
Why this score? — see what drove the D grade
The composite is a weighted blend of 9 inputs, each scored 0–100. Each bar is that input's sub-score; the figure is the points it added to the 100-point composite (weight × sub-score).
- Cash flow +11.9/30.0
- ARV discount +7.5/15.0
- Schools +5.0/10.0
- Rent growth +4.8/5.0
- Livability +3.8/5.0
- Condition / age +3.8/5.0
- DSCR +3.5/10.0
- 1% rule +3.4/10.0
- Appreciation +0.0/10.0
$358,000
🖨 Deal sheet 📄 Offer letter ✓ Due diligence
Listing remarks MLS
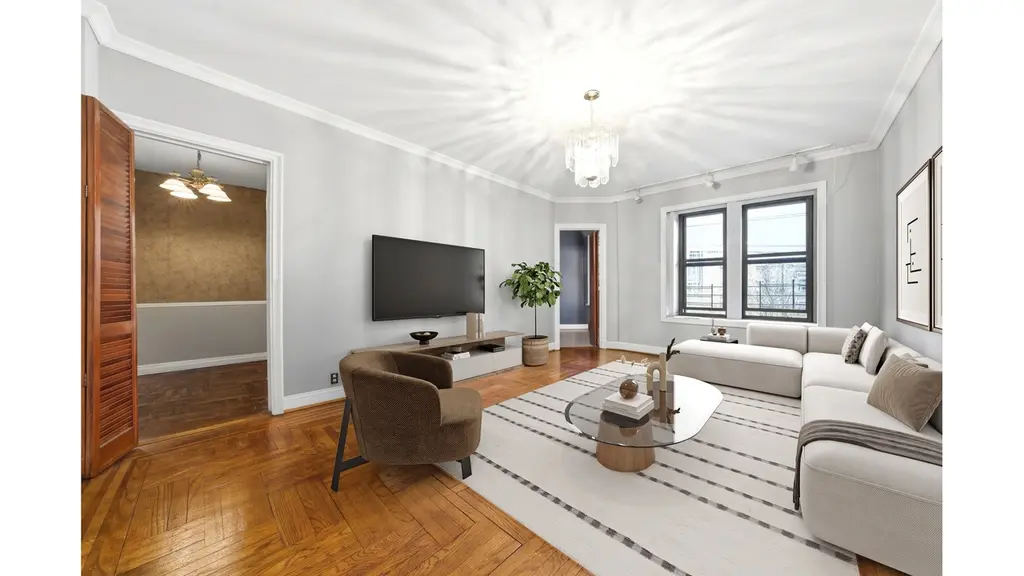
Classic Elegance Pre-War Three Bedroom Co Op. First floor huge 3-bedroom, 1.5-bath co-op in a private complex of pre-war buildings directly across from the park. Offering a rare combination of gracious proportion with original architectural details. High ceilings, original hardwood floors, crown molding, wooden doors preserve the pre-war character throughout. Primary bedroom has half bath. Updated eat in kitchen. Large entry foyer and abundant closets throughout the apartment. Additional amenities include on-site laundry, porter and full time super. Near all transportation, shopping and major highways. Images shown of living room, bedroom and dining area have been virtually staged, and some furniture has been removed.
Key facts
- Large entry foyer
- Wooden doors
- Crown molding
Tags
Property features AI
Finance
- HOA & community: Cats allowed
Exterior
- Parking: No carport
- Utilities: Public sewer; Trash collection (public)
- Home design: Stock cooperative; 5 stories total; Entry level on 1
- Construction: Brick construction
- Exterior features: Brick construction; Not waterfront
Interior
- Kitchen: Cooktop (gas); Oven; Microwave; Refrigerator
- Bedrooms: 7 rooms total (includes bedrooms and living spaces)
- Flooring: Hardwood floors
- Bathrooms: 2 full bathrooms
- Heating & cooling: Oil heating; Wall/window air conditioning unit(s)
- Interior features: Eat-in kitchen; Elevator; Entrance foyer; High ceilings; Original details; Primary bathroom
- Laundry & utility: No basement
Neighborhood map
What this means for you Summary
Snapshot
- This is a 3-bed/2.0-bath condo listed at $358k. Condition is rated good.
Deal economics
- At list price, monthly cash flow is $-94 ($-1k/yr) — negative.
- To cash-flow at today's rent, offer at most $344k (3.8% below list).
- To meet the 1% rule (rent ≥ 1% of price), the offer needs to be $301k (15.8% below list).
- Recommended offer: $301k (15.8% below list) — sets the bar for 1% rule.
- Cap rate 6.0% vs local median 2.6% in New York — top-decile yield for the area; either an underpriced asset or a hidden risk that comps aren't pricing in. Stress-test before assuming the spread holds.
Location & tenants
- Location reads 75/100 on livability (#268 in NY, #4,188 nationally) — a middle-class / working-renter tenant base. Strengths: amenities A+, commute A+, health & safety A; Watch: crime F, cost of living F.
- Market conditions: Rents rising fast (+9.2%/yr); 129 active listings in the ZIP; 6,929 units permitted in Bronx County in 2024 (6,829 in 5+ unit buildings).
- At $3,013/mo this rent would consume 73% of the median local household income ($49k/yr) (locally 10930% of renters already pay >50% of income on rent) — very limited rent-growth headroom before tenants either downsize or default.
Forward outlook
- Local home prices are declining (-3.0%/yr); year-one equity from $2k of loan paydown is wiped out by about $11k of value loss. Plan a longer hold.
- Bronx County population projected at +21% by 2050 — long-run rental-demand tailwind backs the buy-and-hold thesis.
Negotiation context
- It's been on market 77 days — a 6% lower offer ($337k) is reasonable based on typical stale-listing flexibility.
- 2 sale attempts; this cycle's ask has dropped $22k (6%) from the opening price — seller is motivated, your offer sets the floor, not the list.
Risks & watch-outs
- Watch-outs: built in 1928 — expect roof / HVAC / electrical / plumbing capex.
- Climate carrying-cost: major wind risk, 27% chance of damaging wind over 30y; extreme-heat days projected 6→13/yr by 2055 (HVAC capex compounding) — expect insurance premiums to compound above CPI over the hold.
Questions for the listing agent
- What do current leases actually rent for vs. the listed asking? Can we see a recent rent roll and the last 12 months of T-12 income?
- It's been on market 77 days. Have you received any prior offers? Is the seller open to a 16% concession, seller financing, or rate buy-down credit?
- Built in 1928 — when were the roof, HVAC, electrical panel, plumbing, and water heater last replaced?
- Any open or pending special assessments — roof, HVAC, plumbing, elevator, façade? What's the per-unit balance and payoff schedule, and is the seller paying it off at close or rolling it to the buyer?
- Why hasn't it sold? Are there any deal-killer items the seller is aware of (foundation, flood, title, zoning, code violations)?
- Is there a deadline driving the sale (1031 exchange, divorce, estate, relocation)? That informs how much negotiation room exists.
- Schools are B-rated — typically a magnet for longer-tenancy family renters. What's the average tenant stay here, and is there a school-zone premium baked into asking?
- Crime grade is F in this area — have there been break-ins, vandalism, or insurance claims at this property in the last 3 years? What carrier currently insures it and at what premium?
- The area grade is low — what's the realistic commute time and amenity access for the typical tenant pool here? Any planned neighborhood developments (good or bad) we should know about?
- What's the average days-on-market for RENTAL listings here right now (not sales)? A rising rental-DOM trend means longer vacancies and softer asking-rent achievability than the comps imply.
- What's the recent tenant-quality profile in this submarket — average credit score on applications, eviction rate, late-payment / NSF rate, and stable-employment percentage? A property-management company in the area should have these aggregated.
- How much new apartment / multifamily construction is in the pipeline within 1–3 miles? Heavy new supply (>2% of stock underway) typically softens rents 12–24 months out; light construction supports rent growth.
Investment metrics
- 1% rule
- 0.84% ✗
- Cap rate
- 5.98%
- Cash-on-cash
- -1.13%
- DSCR
- 0.95
- GRM
- 9.9
CMA / ARV
No comps found within radius.
Projected returns pro-forma
-3.0% appreciation · 8.0% rent growth · sell at horizon
- IRR
- -12.7%
- Equity multiple
- 0.52×
- Total profit
- $-48,035
- Equity at exit
- $53,379
- IRR
- 2.6%
- Equity multiple
- 1.23×
- Total profit
- $23,107
- Equity at exit
- $30,953
Cash invested: $100,240 (down + closing). Projections, not guarantees.
Landlord ↔ Tenant lean methodology
- Overall (CITY)
- 0 Strongly Tenant-Friendly
- State New York
- 15 Strongly Tenant-Friendly · D+10
- County
- — inherits STATE
- City New York
- 0 Strongly Tenant-Friendly · D+34
ZIP-level market 10467
- Home prices YoY
- -32.8%
- Rents YoY
- 9.2%
- Active inventory
- 129
- Price-to-rent
- 9.9×
Monthly cashflow live
- Estimated rent
- $3,013 medium interval (Pro) →
- Mortgage (P&I)
- −$1,877
- Tax est. 1.5%
- −$448 /mo · $5,370/yr
- Insurance
- −$149
- HOA
- −$0
- Vacancy / Maint / Mgmt
- −$633
- Net cashflow
- $-94
Break-even live
UW: 25.0% down · 7.5% · 30yr · 1.5% tax · 5.0% vac · 8.0% maint · 8.0% mgmt
Financing live
Cash to close
- Down payment
- $89,500
- Closing costs
- $10,740
- Reserves months
- —
- Total cash needed
- —
Loan-product check · same deal, 3 products live
Conventional
25% down · 7.5% · 30yr
- Down + closing
- —
- Monthly P&I
- —
- Monthly cashflow
- —
- DSCR
- —
- Eligible?
- —
Personal DTI + credit; lowest rate.
DSCR
20% down · 8.5% · 30yr
- Down + closing
- —
- Monthly P&I
- —
- Monthly cashflow
- —
- DSCR
- —
- Eligible?
- —
No personal income docs; deal must DSCR.
Hard money
10% down · 12.0% · 12mo
- Down + closing
- —
- Monthly P&I
- —
- Monthly cashflow
- —
- DSCR
- —
- Eligible?
- —
Short-term bridge; refi at stabilization.
HOA detail condo
- Monthly dues
- $0 · $0/yr
- Assessments
- None detected in remarks — confirm with the listing agent.
Listing history 13 events
-
2026-06-18days on market $358,000 Active 77 DOM
-
2026-06-17days on market $358,000 Active 76 DOM
-
2026-06-15days on market $358,000 Active 74 DOM
-
2026-06-13days on market $358,000 Active 72 DOM
-
2026-06-10days on market $358,000 Active 68 DOM
-
2026-06-08days on market $358,000 Active 67 DOM
-
2026-06-08days on market $358,000 Active 66 DOM
-
2026-06-04days on market $358,000 Active 63 DOM
-
2026-06-03days on market $358,000 Active 62 DOM
-
2026-06-01days on market $358,000 Active 60 DOM
-
2026-05-31days on market $358,000 Active 59 DOM
-
2026-04-03$380,005 Active 727-char remark
Show marketing remark (727 chars)
Classic Elegance Pre-War Three Bedroom Co Op. First floor huge 3-bedroom, 1.5-bath co-op in a private complex of pre-war buildings directly across from the park. Offering a rare combination of gracious proportion with original architectural details. High ceilings, original hardwood floors, crown molding, wooden doors preserve the pre-war character throughout. Primary bedroom has half bath. Updated eat in kitchen. Large entry foyer and abundant closets throughout the apartment. Additional amenities include on-site laundry, porter and full time super. Near all transportation, shopping and major highways. Images shown of living room, bedroom and dining area have been virtually staged, and some furniture has been removed.
-
2026-03-11$358,000 Active
ⓘ Source: listings_history table (triggers on properties + properties_extension) + one-shot
backfill from property_details.listing_events for pre-trigger history.
Climate risk First Street
- Flood 1/10 Low FEMA zone X (unshaded) · 0% chance over 30 yrs
- Wildfire 1/10 Low
- Heat 6/10 Major 6 d/yr ≥99°F today · 13 d/yr by 30 yrs out
- Wind 6/10 Major 27% chance of damaging wind over 30 yrs
- Air quality 3/10 Moderate 3 unhealthy d/yr today · 4 by 30 yrs out
Nearby sold comps map
Loading sold comps map…
Walkable amenities ~0.75 mi
Loading nearby amenities…
Taxation est. · year 1
- Rental income
- $36,152
- − Mortgage interest
- −$20,054
- − Property taxes
- −$5,370
- − Insurance
- −$1,790
- − Repairs & maintenance
- −$2,892
- − Management
- −$2,892
- − Depreciation
- −$10,415
- Taxable loss
- −$7,260
- Est. tax savings @ 24.0%
- +$1,743
- After-tax cash flow
- $614/yr
For passive investors: Depreciation is non-cash, so a rental often shows a tax loss while cash-flowing — sheltering income. Rental losses are passive: they offset passive income freely, and up to $25,000/yr can offset ordinary (W-2) income if you actively participate and your MAGI is under $100k (phasing out to $0 by $150k); unused losses carry forward. On sale, claimed depreciation is recaptured at up to 25%, and gains may owe capital-gains tax (a 1031 exchange can defer both). Figures are a year-1 estimate at your 24.0% rate — not tax advice; consult a CPA.
Condition & rehab AI · 12 photos
This pre-war three-bedroom co-op is in good condition with original hardwood floors and high ceilings. It offers a good return on investment with minor updates to enhance its curb appeal and interior aesthetics.
Value-add opportunities
- Both Paint interior walls — Fresh paint enhances curb appeal and interior aesthetics
- Both Replace light fixtures — Modern light fixtures improve aesthetics and energy efficiency
- Both Install smart home devices — Smart home devices increase convenience and property value
Renovation cost estimate screening
Value-add ROI direction
- Both Paint interior walls — Fresh paint enhances curb appeal and interior aesthetics ↑
- Both Replace light fixtures — Modern light fixtures improve aesthetics and energy efficiency ↑
- Both Install smart home devices — Smart home devices increase convenience and property value ↑
ⓘ Cost ranges are severity-bucket heuristics (US national rule-of-thumb). Get contractor quotes + a written scope before underwriting a rehab budget.
Schools (NCES district)
No district data.
Livability — New York
- Score
- 75/100
- State rank
- #268
- US rank
- #4188
Category grades
Schools grade is shown separately in the Schools card above.
Census & demographics
- Census place
- New York, NY
- County
- Bronx County · 1,197,324 people
- City population
- 7,731,280
- Metro
- New York-Newark-Jersey City, NY-NJ-PA
- Population (ZIP)
- 96,421
- Household income
- $49,330
- Rent vs Own
- Severe rent burden
- 10930.0
Population outlook (Bronx County) Hauer SSP2
- Today (2025)
- 1,607,353 people
- By 2030
- 1,681,852 · +4.6%
- By 2040
- 1,824,421 · +13.5%
- By 2050
- 1,945,470 · +21.0%
- By 2075
- 2,187,887 · +36.1%
- By 2100
- 2,244,136 · +39.6%
Race, ethnicity, and origin ACS 2023
- Neighborhood character
- Diverse neighborhood (Simpson 0.62)
- Race & ethnicity
- Hispanic / Latino 53% Black 28% Two or more races 11% White 9% Asian 6% Native American 1%
- Hispanic origin (detail)
- Mexican 7% Puerto Rican 16% Dominican 22%
- Foreign-born
- 39% · Canada, Jamaica
- Languages at home
- 41% English-only · Spanish 45% Other Indo-European 7% French/Haitian/Cajun 1%
Political lean MEDSL · Bronx
- 2024 margin
- Solid D (+45.4) · D 72.7% · R 27.3%
- 2008→2024 swing
- -32.3pp toward R · 2008: 77.8pp · 2024: 45.4pp
- All cycles
- 2024: D+45.4 2020: D+67.6 2016: D+79.1 2012: D+82.9 2008: D+77.8
Not yet ingested
- Civics
- —
Market trends
- HPI YoY
- ▼ -112.76%
- Current HPI
- 231.537
- Rent YoY
- ▲ 9.23%
- Metro
- New York-Newark-Jersey City, NY-NJ-PA
- State GDP YoY
- ▲ 2.60%
- F500 in state
- 92
Industry mix (Fortune 500 HQ in NY)
| Industry | F500 HQs | Revenue |
|---|---|---|
| Financial Services | 10 | $950B |
|
||
| Consumer Goods | 9 | $162B |
|
||
| Insurance | 4 | $225B |
|
||
| Telecommunications | 2 | $144B |
|
||
| Pharmaceuticals | 2 | $112B |
|
||
| Media / Entertainment | 2 | $69B |
|
||
Price history
+6.1% since first listed2 events — show timeline
- 2026-04-03 Listed $380,005 RLS at REBNY
- 2026-03-11 Listed $358,000 OneKey® MLS as Distributed by MLS Grid
Cash-flow waterfall
monthlySold comps — $/sqft
last 12 mo · ≤1 miLoading sold comps…