803 E 3rd Street St · Blue Earth, MN
Flood risk 1/10 · Minimal
- FEMA flood zone
- X (shaded)
- Chance of flooding over 30 yrs
- 0.0%
- Est. flood insurance / yr
- $507 – $1,088
Fire risk 1/10 · Minimal
- Est. fire insurance / yr
- $888 – $1,650
Heat risk 2/10 · Minimal
- Hot days now (above 99°F)
- 7 days/yr
- Hot days in 30 yrs
- 15 days/yr
Wind risk 2/10 · Minimal
- Chance of severe wind over 30 yrs
- —
Air-quality risk 1/10 · Minimal
- Unhealthy air days now
- 0 days/yr
- Unhealthy air days in 30 yrs
- 0 days/yr
Risk factors via First Street. Map © Google.
Why this score? — see what drove the C grade
The composite is a weighted blend of 9 inputs, each scored 0–100. Each bar is that input's sub-score; the figure is the points it added to the 100-point composite (weight × sub-score).
- Cash flow +15.5/30.0
- Appreciation +10.0/10.0
- ARV discount +7.5/15.0
- 1% rule +5.4/10.0
- DSCR +4.8/10.0
- Livability +3.7/5.0
- Schools +3.1/10.0
- Rent growth +2.5/5.0
- Condition / age +2.5/5.0
$55,000
🖨 Deal sheet 📄 Offer letter ✓ Due diligence
Listing remarks MLS
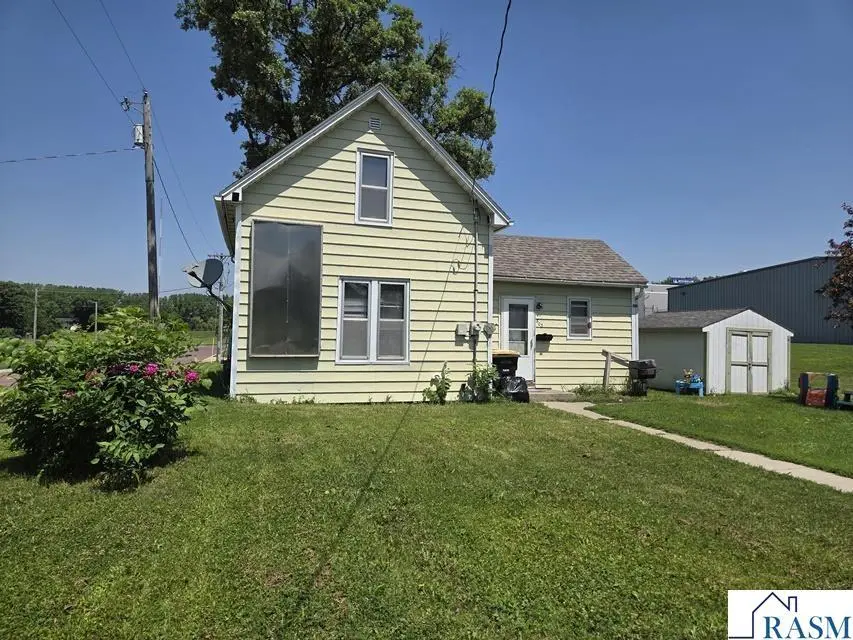
Why rent when you can own? This nicely maintained 2-3 bedroom features spacious kitchen and living room, bedroom, full bath, and laundry on the main floor. The upper level features a large bedroom, plus a landing area for additional living space.
Key facts
- 4,792 sq ft lot
- Built 1905
- Listed 8 days
Property features AI
Exterior
- Utilities: Public water; Public sewer
- Home design: Single family residence; Residential property
- Construction: Metal siding; Full unfinished basement with sump pump
- Exterior features: Asphalt roof; Shed(s)
Interior
- Kitchen: Cooktop; Range; Refrigerator
- Bathrooms: 1 full bathroom
- Heating & cooling: Central air conditioning; Natural gas heating with forced air
- Interior features: Cooktop, Range, Refrigerator
Neighborhood map
What this means for you Summary
Snapshot
- This is a 2-bed/1.0-bath other listed at $55k.
Deal economics
- At list price, monthly cash flow is $23 ($271/yr) — positive.
- The deal already cash-flows at list — no discount required.
- Meets the 1% rule at list price ($574 rent vs $55k).
Location & tenants
- Location reads 73/100 on livability (#259 in MN) — a middle-class / working-renter tenant base. Strengths: cost of living A+, housing A+, health & safety A+; Watch: employment C-, amenities F, commute F.
- Blue Earth Area Public School (town): math 29% / reading 44% proficiency, ranked #245 of 301 in MN (top 81%) — families likely to look elsewhere, expect single-tenant / working-renter base with shorter leases.
- Market conditions: 36 active listings in the ZIP; 2 comparable units currently listed for rent nearby; 4 units permitted in Faribault County in 2024 (0 in 5+ unit buildings).
Forward outlook
- In year one you build about $6k of equity ($380 loan paydown + $6k appreciation (10.0% local appreciation)).
- Faribault County population projected at -11% by 2050 — secular population decline; favor cash flow + early exit over multi-decade hold.
- At projected returns (10.0% appreciation + 3.0% rent growth), your $15k cash investment doubles in ~3 years — after that, you're playing with house money.
- By year 6, paydown + projected appreciation supports a ~$35k cash-out refi (75% LTV) — recoverable capital for the next deal without selling this one.
Negotiation context
- Only 8 days on market — expect competitive offers; lowballing is unlikely to land.
- 2 sale attempts since 16y ago with the ask held roughly flat each time — persistent listings suggest the price (not the market) is what's stuck; bring a comps-based counter.
- Current owner paid $19k; list at $55k implies a 193% gain — meaningful room to come down on a strong offer.
Risks & watch-outs
- Watch-outs: property tax is 2.6% of price; built in 1905 — expect roof / HVAC / electrical / plumbing capex.
Questions for the listing agent
- Built in 1905 — when were the roof, HVAC, electrical panel, plumbing, and water heater last replaced?
- Property tax is high relative to price — has the assessment been appealed recently, and will the sale trigger a re-assessment?
- Is there a deadline driving the sale (1031 exchange, divorce, estate, relocation)? That informs how much negotiation room exists.
- What's the average days-on-market for RENTAL listings here right now (not sales)? A rising rental-DOM trend means longer vacancies and softer asking-rent achievability than the comps imply.
- What's the recent tenant-quality profile in this submarket — average credit score on applications, eviction rate, late-payment / NSF rate, and stable-employment percentage? A property-management company in the area should have these aggregated.
- How much new for-sale + rental construction is in the pipeline within 1–3 miles? Heavy new supply typically softens prices + rents 12–24 months out; constrained supply supports both.
Investment metrics
- 1% rule
- 1.04% ✓
- Cap rate
- 6.79%
- Cash-on-cash
- 1.76%
- DSCR
- 1.08
- GRM
- 8.0
CMA / ARV
No comps found within radius.
Projected returns pro-forma
10.0% appreciation · 3.0% rent growth · sell at horizon
- IRR
- 25.6%
- Equity multiple
- 3.04×
- Total profit
- $31,431
- Equity at exit
- $49,548
- IRR
- 22.5%
- Equity multiple
- 6.94×
- Total profit
- $91,509
- Equity at exit
- $106,853
Cash invested: $15,400 (down + closing). Projections, not guarantees.
Landlord ↔ Tenant lean methodology
- Overall (STATE)
- 46 Balanced
- State Minnesota
- 46 Balanced · D+2
- County
- — inherits STATE
- City
- — inherits STATE
ZIP-level market 56013
- Home prices YoY
- 6.7%
- Active inventory
- 36
- Price-to-rent
- 8.0×
Monthly cashflow live
- Estimated rent
- $574 medium interval (Pro) →
- Mortgage (P&I)
- −$288
- Tax from tax record
- −$120 /mo · $1,434/yr
- Insurance
- −$23
- HOA
- −$0
- Vacancy / Maint / Mgmt
- −$121
- Net cashflow
- $23
Break-even live
UW: 25.0% down · 7.5% · 30yr · 1.5% tax · 5.0% vac · 8.0% maint · 8.0% mgmt
Financing live
Cash to close
- Down payment
- $13,750
- Closing costs
- $1,650
- Reserves months
- —
- Total cash needed
- —
Loan-product check · same deal, 3 products live
Conventional
25% down · 7.5% · 30yr
- Down + closing
- —
- Monthly P&I
- —
- Monthly cashflow
- —
- DSCR
- —
- Eligible?
- —
Personal DTI + credit; lowest rate.
DSCR
20% down · 8.5% · 30yr
- Down + closing
- —
- Monthly P&I
- —
- Monthly cashflow
- —
- DSCR
- —
- Eligible?
- —
No personal income docs; deal must DSCR.
Hard money
10% down · 12.0% · 12mo
- Down + closing
- —
- Monthly P&I
- —
- Monthly cashflow
- —
- DSCR
- —
- Eligible?
- —
Short-term bridge; refi at stabilization.
Rent comps 2 comps
| Address | Beds | Baths | Sqft | Rent | $/sqft | DOM | Units | Dist |
|---|---|---|---|---|---|---|---|---|
| 905 E 5th St Unit 1 Blue Earth, MN | 1.0 | 1.0 | 550 | $550 | $1.00 | 43d | 1 | 0.16mi |
| 528 N Grant St Blue Earth, MN | 1.0 | 1.0 | 575 | $724 | $1.26 | 43d | 1 | 1.02mi |
Listing history 7 events
-
2026-06-12statusdays on market $55,000 Pending 8 DOM
-
2026-06-09days on market $55,000 Active 7 DOM
-
2026-06-08days on market $55,000 Active 6 DOM
-
2026-06-07days on market $55,000 Active 5 DOM
-
2026-06-05days on market $55,000 Active 3 DOM
-
2026-06-02remarks 288-char remark
-
2026-06-02$55,000 Active 1 DOM
ⓘ Source: listings_history table (triggers on properties + properties_extension) + one-shot
backfill from property_details.listing_events for pre-trigger history.
Tax reassessment forecast MN · Partial reset (capped growth)
- Current annual tax
- $1,434 · $120/mo
- Projected year-2 tax
- $1,434 · $120/mo
- Expected delta
- $0/yr ($0/mo · 0.0%)
ⓘ Screening estimate from a state-policy table — verify with the county assessor before closing.
Climate risk First Street
- Flood 1/10 Low FEMA zone X (shaded) · 0% chance over 30 yrs
- Wildfire 1/10 Low
- Heat 2/10 Low 7 d/yr ≥99°F today · 15 d/yr by 30 yrs out
- Wind 2/10 Low
- Air quality 1/10 Low 0 unhealthy d/yr today · 0 by 30 yrs out
Nearby sold comps map
Loading sold comps map…
Walkable amenities ~0.75 mi
Loading nearby amenities…
Taxation est. · year 1
- Rental income
- $6,887
- − Mortgage interest
- −$3,081
- − Property taxes
- −$1,434
- − Insurance
- −$275
- − Repairs & maintenance
- −$551
- − Management
- −$551
- − Depreciation
- −$1,600
- Taxable loss
- −$605
- Est. tax savings @ 24.0%
- +$145
- After-tax cash flow
- $416/yr
For passive investors: Depreciation is non-cash, so a rental often shows a tax loss while cash-flowing — sheltering income. Rental losses are passive: they offset passive income freely, and up to $25,000/yr can offset ordinary (W-2) income if you actively participate and your MAGI is under $100k (phasing out to $0 by $150k); unused losses carry forward. On sale, claimed depreciation is recaptured at up to 25%, and gains may owe capital-gains tax (a 1031 exchange can defer both). Figures are a year-1 estimate at your 24.0% rate — not tax advice; consult a CPA.
Schools (NCES district)
- District
- Blue Earth Area Public School
- NCES district ID
- 2700130
- Math proficiency
- 29% ▼ -19.00%
- Reading proficiency
- 44% ▼ -10.00%
- Median HH income
- $44,434
- Composite
- 31.0/100
- National rank
- #6095
- State rank
- #245 of 301 in MN
Livability — Blue Earth
- Score
- 73/100
- State rank
- #259
- US rank
- #5617
Category grades
Schools grade is shown separately in the Schools card above.
Census & demographics
- Census place
- Blue Earth, MN
- Population (ZIP)
- 4,534
Population outlook (Faribault County) Hauer SSP2
- Today (2025)
- 13,474 people
- By 2030
- 13,112 · -2.7%
- By 2040
- 12,454 · -7.6%
- By 2050
- 11,973 · -11.1%
- By 2075
- 11,565 · -14.2%
- By 2100
- 10,844 · -19.5%
Race, ethnicity, and origin ACS 2023
- Neighborhood character
- Predominantly White (86%)
- Race & ethnicity
- White 86% Hispanic / Latino 10% Two or more races 7% Asian 1%
- Hispanic origin (detail)
- Mexican 10%
- Common ancestry
- Portuguese 23% Scottish 5% Iranian 3%
- Foreign-born
- 3% · Canada
- Languages at home
- 92% English-only · Spanish 6% Other Asian/Pacific 1%
Political lean MEDSL · Faribault
- 2024 margin
- Solid R (+37.4) · D 30.4% · R 67.8% · Other 1.8%
- 2008→2024 swing
- -31.8pp toward R · 2008: -5.6pp · 2024: -37.4pp
- All cycles
- 2024: R+37.4 2020: R+33.6 2016: R+34.1 2012: R+9.1 2008: R+5.6
Not yet ingested
- Civics
- —
Market trends
- HPI YoY
- ▲ 15.36%
- Current HPI
- 244.2912
- Rent YoY
- —
- Metro
- —
- State GDP YoY
- ▲ 2.41%
- F500 in state
- 34
Industry mix (Fortune 500 HQ in MN)
| Industry | F500 HQs | Revenue |
|---|---|---|
| Healthcare | 2 | $407B |
|
||
| Retail | 2 | $150B |
|
||
| Consumer Goods | 2 | $32B |
|
||
| Industrial Machinery | 2 | $6B |
|
||
| Agriculture | 1 | $40B |
|
||
| Healthcare / Medical Devices | 1 | $32B |
|
||
Price history
+130.1% since first listed3 events — show timeline
- 2026-06-02 Listed $55,000 RASM
- 2010-10-01 Sold (MLS) $18,750 NORTHSTARMLS as Distributed by MLS Grid
- 2010-08-03 Listed $23,900 NORTHSTARMLS as Distributed by MLS Grid
Property tax history
+13.6%/yrLatest (2025): $1,434 · +3.0% YoY. Source: county tax records.
Cash-flow waterfall
monthlySold comps — $/sqft
last 12 mo · ≤1 miLoading sold comps…