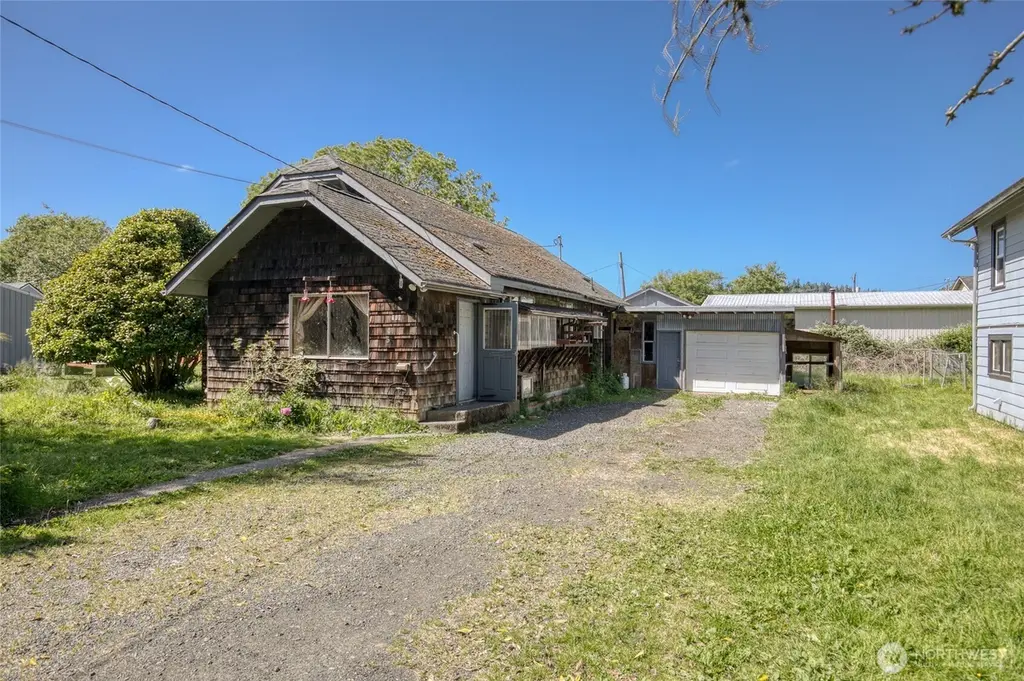
314 E Schley St · Aberdeen, WA
Flood risk 1/10 · Minimal
- FEMA flood zone
- X
- Chance of flooding over 30 yrs
- 0.0%
- Est. flood insurance / yr
- $507 – $1,088
Fire risk 1/10 · Minimal
- Est. fire insurance / yr
- $604 – $1,122
Heat risk 1/10 · Minimal
- Hot days now (above 78°F)
- 7 days/yr
- Hot days in 30 yrs
- 16 days/yr
Wind risk 1/10 · Minimal
- Chance of severe wind over 30 yrs
- —
Air-quality risk 6/10 · Moderate
- Unhealthy air days now
- 7 days/yr
- Unhealthy air days in 30 yrs
- 7 days/yr
Risk factors via First Street. Map © Google.
Why this score? — see what drove the B grade
The composite is a weighted blend of 9 inputs, each scored 0–100. Each bar is that input's sub-score; the figure is the points it added to the 100-point composite (weight × sub-score).
- Cash flow +30.0/30.0
- 1% rule +10.0/10.0
- DSCR +10.0/10.0
- ARV discount +7.5/15.0
- Livability +4.0/5.0
- Rent growth +3.6/5.0
- Schools +3.6/10.0
- Condition / age +2.5/5.0
- Appreciation +0.0/10.0
$119,000
🖨 Deal sheet 📄 Offer letter ✓ Due diligence
Listing remarks
Fixer South Aberdeen home located near Stevens Elementary. Built in 1928, this 1,720 +/- square foot home offers 3 bedrooms and 1.75 bathrooms on an approximately 9,000-square-foot lot. The main floor includes a living room, dining room, kitchen, utility room, two bedrooms, and a full bathroom. The upper level contains one bedroom and a storage area. The home has wall heat, a composition roof, and a post-and-block foundation. An attached one-car garage includes workspace/storage, a bonus room with ¾ bathroom, and green houses. Due to its condition, the property is not eligible for financing and is being offered for cash sale. Property sold as-is.
Key facts
- Green houses
- 9,000 sq ft lot
- Garage
Tags
Property features AI
Finance
- Other: Zoning: F-R; Lot size approximately 0.2066 acres; MLS living area reported as 1,720
- Financial info: Listing terms: Cash
Exterior
- Parking: Attached garage; Driveway; Off-street parking; 1 covered parking space; Garage about 618 sq ft
- Utilities: Public water (City of Aberdeen); Sewer connected (City of Aberdeen); Electric and propane energy sources; Power by Grays Harbor PUD #1
- Home design: Single-family residence; One and one-half story; Main entry level; South-facing
- Construction: Built on lot; Wood construction; Composition and flat roof; Pillar/post/pier foundation; Structure type: house; Property condition: fixer
- Exterior features: Wood exterior; Paved lot; Greenhouse; Cable TV and high-speed internet available; Level topography; Has a view
Interior
- Kitchen: Dishwasher; Stove/Range; Refrigerator
- Bedrooms: 3 bedrooms total — 2 on main level, 1 upper
- Flooring: Vinyl; Carpet
- Bathrooms: 1 full bath; 1 three-quarter bath; One bathtub and two showers
- Heating & cooling: Wall furnace heating; No central air / cooling
- Interior features: Dining room; Water heater (electric); Electric fireplace
- Laundry & utility: Washer; Dryer; Utility room with electric water heater
Neighborhood map
What this means for you Summary
Snapshot
- This is a 3-bed/2.0-bath single-family listed at $119k.
Deal economics
- At list price, monthly cash flow is $820 ($10k/yr) — positive.
- The deal already cash-flows at list — no discount required.
- Meets the 1% rule at list price ($2k rent vs $119k).
- Cap rate 14.6% vs local median 4.1% in Aberdeen — top-decile yield for the area; either an underpriced asset or a hidden risk that comps aren't pricing in. Stress-test before assuming the spread holds.
Location & tenants
- Location reads 81/100 on livability (#73 in WA, #1,320 nationally) — a professional / high-income tenant draw. Strengths: amenities A+, commute A+, cost of living A+; Watch: crime D-, employment F.
- Aberdeen School District (town): math 35% / reading 45% proficiency, ranked #222 of 291 in WA (top 76%) — families likely to look elsewhere, expect single-tenant / working-renter base with shorter leases; 61% free/reduced lunch — lower-income household profile, screen leases tightly.
- Zoned schools: Stevens Elementary School (345 students, 89% FRL); J M Weatherwax High School (916 students, 63% FRL) — zoned schools average 76% FRL vs 61% district-wide (15 pts higher); higher-poverty schools than district average — tighter screening recommended.
- Market conditions: Rents rising fast (+4.3%/yr); 257 active listings in the ZIP; 4 comparable units currently listed for rent nearby; rentals lingering (median 44d on market — plan ~5-8 weeks vacancy on turnover, expect pricing pressure); 100% of comp listings sitting > 30 days — soft ceiling on asking rent; 297 units permitted in Grays Harbor County in 2024 (17 in 5+ unit buildings).
- This rent runs 40% of the median local income ($58k/yr) — at the standard rent-burdened threshold; future hikes will face affordability resistance.
Forward outlook
- Local home prices are declining (-3.0%/yr); year-one equity from $823 of loan paydown is wiped out by about $4k of value loss. Plan a longer hold.
- Grays Harbor County population projected at -24% by 2050 — secular population decline; favor cash flow + early exit over multi-decade hold.
- At projected returns (-3.0% appreciation + 4.3% rent growth), your $33k cash investment doubles in ~4 years — after that, you're playing with house money.
Negotiation context
- Only 2 days on market — expect competitive offers; lowballing is unlikely to land.
Risks & watch-outs
- Watch-outs: built in 1928 — expect roof / HVAC / electrical / plumbing capex.
Questions for the listing agent
- Built in 1928 — when were the roof, HVAC, electrical panel, plumbing, and water heater last replaced?
- Is there a deadline driving the sale (1031 exchange, divorce, estate, relocation)? That informs how much negotiation room exists.
- Schools are D-rated, which usually means shorter tenancies and higher turnover. Who's the typical renter profile here, and what's been the actual vacancy rate?
- Crime grade is D in this area — have there been break-ins, vandalism, or insurance claims at this property in the last 3 years? What carrier currently insures it and at what premium?
- What's the average days-on-market for RENTAL listings here right now (not sales)? A rising rental-DOM trend means longer vacancies and softer asking-rent achievability than the comps imply.
- What's the recent tenant-quality profile in this submarket — average credit score on applications, eviction rate, late-payment / NSF rate, and stable-employment percentage? A property-management company in the area should have these aggregated.
- How much new for-sale + rental construction is in the pipeline within 1–3 miles? Heavy new supply typically softens prices + rents 12–24 months out; constrained supply supports both.
Investment metrics
- 1% rule
- 1.61% ✓
- Cap rate
- 14.57%
- Cash-on-cash
- 29.55%
- DSCR
- 2.31
- GRM
- 5.2
CMA / ARV
- ARV (on-the-fly)
- $317,604
- Comps found
- 9
Show comp detail 9 sales within ~0.75 mi
| Address | Dist | Beds/Ba | Sqft | Sold | Price | $/sf | Match |
|---|---|---|---|---|---|---|---|
| 421 E Marion St | 0.19mi | 3/2.0 | 1,704 (+7%) | 10mo | $395,000 | $232 | 71 |
| 300 E Perry St | 0.07mi | 2/1.0 (-1) | 1,449 (-9%) | 5mo | $200,000 | $138 | 68 |
| 430 E Curtis | 0.40mi | 3/2.0 | 1,472 (-8%) | 2mo | $325,000 | $221 | 67 |
| 111 E King St | 0.32mi | 3/1.0 | 1,520 (-5%) | 8mo | $302,500 | $199 | 66 |
| 502 W Marion St | 0.52mi | 3/2.5 | 1,578 (-1%) | 13mo | $340,000 | $215 | 61 |
| 414 W Scott St | 0.51mi | 4/1.5 (+1) | 1,531 (-4%) | 11mo | $330,000 | $216 | 53 |
| 107 E Holman St | 0.68mi | 3/2.0 | 1,499 (-6%) | 19mo | $259,900 | $173 | 42 |
| 103 E Scott St | 0.28mi | 3/2.0 | 1,356 (-15%) | 24mo | $175,000 | $129 | 42 |
| 819 W Perry St | 0.73mi | 3/0.5 | 1,356 (-15%) | 3mo | $225,000 | $166 | 33 |
Match score weights: distance 35% · size 25% · config 20% · recency 20%. Top-matched comps best support the ARV.
Projected returns pro-forma
-3.0% appreciation · 4.35% rent growth · sell at horizon
- IRR
- 25.4%
- Equity multiple
- 2.07×
- Total profit
- $35,570
- Equity at exit
- $17,743
- IRR
- 33.9%
- Equity multiple
- 4.28×
- Total profit
- $109,220
- Equity at exit
- $10,289
Cash invested: $33,320 (down + closing). Projections, not guarantees.
Landlord ↔ Tenant lean methodology
- Overall (STATE)
- 28 Tenant-Leaning
- State Washington
- 28 Tenant-Leaning · D+8
- County
- — inherits STATE
- City
- — inherits STATE
ZIP-level market 98520
- Rents YoY
- 4.3%
- Active inventory
- 257
- Price-to-rent
- 5.2×
Monthly cashflow live
- Estimated rent
- $1,921 medium interval (Pro) →
- Mortgage (P&I)
- −$624
- Tax from tax record
- −$23 /mo · $278/yr
- Insurance
- −$50
- HOA
- −$0
- Vacancy / Maint / Mgmt
- −$403
- Net cashflow
- $820
Break-even live
UW: 25.0% down · 7.5% · 30yr · 1.5% tax · 5.0% vac · 8.0% maint · 8.0% mgmt
Financing live
Cash to close
- Down payment
- $29,750
- Closing costs
- $3,570
- Reserves months
- —
- Total cash needed
- —
Loan-product check · same deal, 3 products live
Conventional
25% down · 7.5% · 30yr
- Down + closing
- —
- Monthly P&I
- —
- Monthly cashflow
- —
- DSCR
- —
- Eligible?
- —
Personal DTI + credit; lowest rate.
DSCR
20% down · 8.5% · 30yr
- Down + closing
- —
- Monthly P&I
- —
- Monthly cashflow
- —
- DSCR
- —
- Eligible?
- —
No personal income docs; deal must DSCR.
Hard money
10% down · 12.0% · 12mo
- Down + closing
- —
- Monthly P&I
- —
- Monthly cashflow
- —
- DSCR
- —
- Eligible?
- —
Short-term bridge; refi at stabilization.
Rent comps 4 comps
| Address | Beds | Baths | Sqft | Rent | $/sqft | DOM | Units | Dist |
|---|---|---|---|---|---|---|---|---|
| 912 Bell Dr Cosmopolis, WA | 3.0 | 2.0 | 1877 | $2,600 | $1.39 | 43d | 1 | 0.92mi |
| 810 Dewitt Dr Unit 810 Cosmopolis, WA | 3.0 | 1.0 | 1656 | $1,895 | $1.14 | 43d | 1 | 1.20mi |
| 1731 S Boone St Unit 303 Aberdeen, WA | 2.0 | 1.0 | 1100 | $1,250 | $1.14 | 43d | 1 | 1.25mi |
| 908 E 1st St Aberdeen, WA | 3.0 | 1.0 | 1608 | $2,100 | $1.31 | 43d | 1 | 1.49mi |
Listing history 3 events
-
2026-06-07statusdays on market $119,000 Pending 2 DOM
-
2026-06-03remarks 654-char remark
-
2026-06-03$119,000 Active 1 DOM
ⓘ Source: listings_history table (triggers on properties + properties_extension) + one-shot
backfill from property_details.listing_events for pre-trigger history.
Tax reassessment forecast WA · Resets to sale price
- Current annual tax
- $278 · $23/mo
- Projected year-2 tax
- $1,166 · $97/mo
- Expected delta
- +$888/yr (+$74/mo · 319.4%)
ⓘ Screening estimate from a state-policy table — verify with the county assessor before closing.
Climate risk First Street
- Flood 1/10 Low FEMA zone X · 0% chance over 30 yrs
- Wildfire 1/10 Low
- Heat 1/10 Low 7 d/yr ≥78°F today · 16 d/yr by 30 yrs out
- Wind 1/10 Low
- Air quality 6/10 Major 7 unhealthy d/yr today · 7 by 30 yrs out
Nearby sold comps map
Loading sold comps map…
Walkable amenities ~0.75 mi
Loading nearby amenities…
Taxation est. · year 1
- Rental income
- $23,048
- − Mortgage interest
- −$6,666
- − Property taxes
- −$278
- − Insurance
- −$595
- − Repairs & maintenance
- −$1,844
- − Management
- −$1,844
- − Depreciation
- −$3,462
- Taxable income
- $8,359
- Est. tax owed @ 24.0%
- −$2,006
- After-tax cash flow
- $7,840/yr
For passive investors: Depreciation is non-cash, so a rental often shows a tax loss while cash-flowing — sheltering income. Rental losses are passive: they offset passive income freely, and up to $25,000/yr can offset ordinary (W-2) income if you actively participate and your MAGI is under $100k (phasing out to $0 by $150k); unused losses carry forward. On sale, claimed depreciation is recaptured at up to 25%, and gains may owe capital-gains tax (a 1031 exchange can defer both). Figures are a year-1 estimate at your 24.0% rate — not tax advice; consult a CPA.
Schools (NCES district)
- District
- Aberdeen School District
- NCES district ID
- 5300030
- Math proficiency
- 35% ▼ -1.00%
- Reading proficiency
- 45% ▬ 0.00%
- Median HH income
- $41,896
- Composite
- 36.13/100
- National rank
- #9477
- State rank
- #222 of 291 in WA
Livability — Aberdeen
- Score
- 81/100
- State rank
- #73
- US rank
- #1320
Category grades
Schools grade is shown separately in the Schools card above.
Census & demographics
- Census place
- Aberdeen, WA
- County
- Grays Harbor County · 44,693 people
- City population
- 24,888
- Metro
- Aberdeen, WA
- Population (ZIP)
- 24,888
- Household income
- $58,153
- Rent vs Own
- Severe rent burden
- 635.0
Population outlook (Grays Harbor County) Hauer SSP2
- Today (2025)
- 66,443 people
- By 2030
- 63,255 · -4.8%
- By 2040
- 56,466 · -15.0%
- By 2050
- 50,516 · -24.0%
- By 2075
- 39,296 · -40.9%
- By 2100
- 31,142 · -53.1%
Race, ethnicity, and origin ACS 2023
- Neighborhood character
- Predominantly White (70%)
- Race & ethnicity
- White 70% Hispanic / Latino 16% Two or more races 9% Black 4% Native American 3% Asian 1% Pacific Islander 1%
- Hispanic origin (detail)
- Mexican 11%
- Common ancestry
- Portuguese 4% Italian 3% Lithuanian 2%
- Foreign-born
- 7% · Canada
- Languages at home
- 87% English-only · Spanish 10% Other Asian/Pacific 1% German/W. Germanic 1%
Political lean MEDSL · Grays Harbor
- 2024 margin
- Lean R (+6.0) · D 45.6% · R 51.6% · Other 2.8%
- 2008→2024 swing
- -20.6pp toward R · 2008: 14.6pp · 2024: -6.0pp
- All cycles
- 2024: R+6.0 2020: R+6.6 2016: R+7.1 2012: D+14.0 2008: D+14.6
Not yet ingested
- Civics
- —
Market trends
- HPI YoY
- ▼ -138.75%
- Current HPI
- 207.7393
- Rent YoY
- ▲ 4.35%
- Metro
- Aberdeen, WA
- State GDP YoY
- ▲ 4.65%
- F500 in state
- 22
Industry mix (Fortune 500 HQ in WA)
| Industry | F500 HQs | Revenue |
|---|---|---|
| Retail | 2 | $269B |
|
||
| Technology / Retail | 1 | $638B |
|
||
| Technology | 1 | $245B |
|
||
| Telecommunications | 1 | $38B |
|
||
| Food / Beverage | 1 | $36B |
|
||
| Automotive / Trucks | 1 | $34B |
|
||
Price history
1 event — show timeline
- 2026-06-02 Listed $119,000 NWMLS as Distributed by MLS Grid
Property tax history
-6.8%/yrLatest (2026): $278 · -4.7% YoY. Source: county tax records.
Cash-flow waterfall
monthlySold comps — $/sqft
last 12 mo · ≤1 miLoading sold comps…