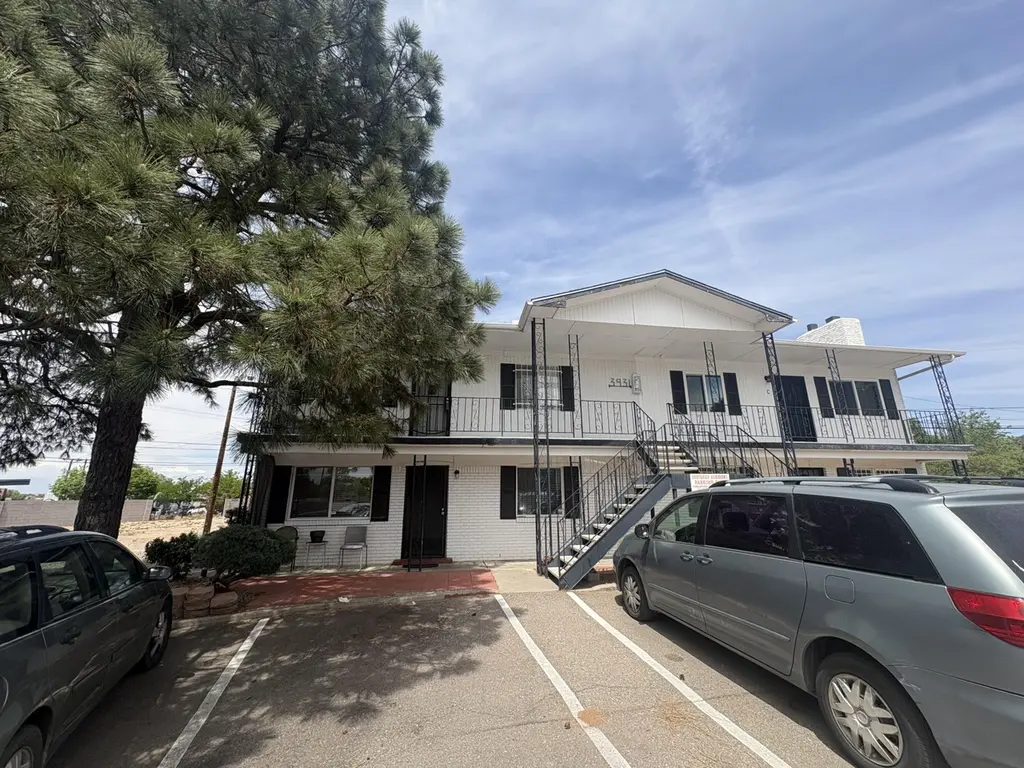
3931 Ortiz Ct NE Apt B · Albuquerque, NM
Flood risk 1/10 · Minimal
- FEMA flood zone
- X (unshaded)
- Chance of flooding over 30 yrs
- 0.0%
- Est. flood insurance / yr
- $507 – $1,088
Fire risk 1/10 · Minimal
- Est. fire insurance / yr
- $706 – $1,312
Heat risk 5/10 · Moderate
- Hot days now (above 95°F)
- 6 days/yr
- Hot days in 30 yrs
- 14 days/yr
Wind risk 1/10 · Minimal
- Chance of severe wind over 30 yrs
- —
Air-quality risk 2/10 · Minimal
- Unhealthy air days now
- 1 days/yr
- Unhealthy air days in 30 yrs
- 3 days/yr
Risk factors via First Street. Map © Google.
Why this score? — see what drove the B grade
The composite is a weighted blend of 9 inputs, each scored 0–100. Each bar is that input's sub-score; the figure is the points it added to the 100-point composite (weight × sub-score).
- Cash flow +25.0/30.0
- ARV discount +15.0/15.0
- 1% rule +8.8/10.0
- DSCR +8.1/10.0
- Schools +5.3/10.0
- Livability +3.6/5.0
- Rent growth +3.2/5.0
- Condition / age +2.5/5.0
- Appreciation +0.0/10.0
$100,000
🖨 Deal sheet (PDF) 📄 Offer letter ✓ Due diligence
Listing remarks MLS
Inviting first-floor condo featuring a thoughtfully designed layout that offers both comfort and functionality, along with the convenience of two dedicated parking spaces. Affordably priced, this home presents a great opportunity for first-time buyers or those looking to downsizes.
Key facts
- $235 HOA
- Built 1964
- Listed 57 days
Neighborhood map
What this means for you Summary
Snapshot
- This is a 2-bed/1.0-bath condo listed at $100k.
Deal economics
- At list price, monthly cash flow is $217 ($3k/yr) — positive.
- The deal already cash-flows at list — no discount required.
- Meets the 1% rule at list price ($1k rent vs $100k).
- Recommended offer: $97k (3.0% below list) — sets the bar for market timing.
- Cap rate 8.9% vs local median 3.7% in Albuquerque — top-decile yield for the area; either an underpriced asset or a hidden risk that comps aren't pricing in. Stress-test before assuming the spread holds.
Location & tenants
- Location reads 72/100 on livability (#13 in NM) — a middle-class / working-renter tenant base. Strengths: amenities A+, commute A+, cost of living A+; Watch: schools D-, crime F.
- Albuquerque Public Schools (urban): math 51% / reading 75% proficiency, ranked #3 of 29 in NM (top 10%) — acceptable for families but not a draw, mixed tenant base, ~2y average lease; 60% free/reduced lunch — lower-income household profile, screen leases tightly.
- Market conditions: Rents rising (+2.7%/yr); 192 active listings in the ZIP; 40 comparable units currently listed for rent nearby; rentals at typical pace (median 15d on market — plan ~3-4 weeks tenant-placement turnaround); 1,316 units permitted in Bernalillo County in 2024 (546 in 5+ unit buildings).
Forward outlook
- Local home prices are declining (-3.0%/yr); year-one equity from $691 of loan paydown is wiped out by about $3k of value loss. Plan a longer hold.
Negotiation context
- It's been on market 57 days — a 3% lower offer ($97k) is reasonable based on typical stale-listing flexibility.
Risks & watch-outs
- Climate carrying-cost: extreme-heat days projected 6→14/yr by 2055 (HVAC capex compounding) — expect insurance premiums to compound above CPI over the hold.
Questions for the listing agent
- It's been on market 57 days. Have you received any prior offers? Is the seller open to a 3% concession, seller financing, or rate buy-down credit?
- Built in 1964 — when were the roof, HVAC, electrical panel, plumbing, and water heater last replaced?
- What does the HOA fee cover, when was the last increase, and are there any pending special assessments or reserve-fund shortfalls?
- Any open or pending special assessments — roof, HVAC, plumbing, elevator, façade? What's the per-unit balance and payoff schedule, and is the seller paying it off at close or rolling it to the buyer?
- Is there a deadline driving the sale (1031 exchange, divorce, estate, relocation)? That informs how much negotiation room exists.
- Schools are D-rated, which usually means shorter tenancies and higher turnover. Who's the typical renter profile here, and what's been the actual vacancy rate?
- Crime grade is F in this area — have there been break-ins, vandalism, or insurance claims at this property in the last 3 years? What carrier currently insures it and at what premium?
- What's the average days-on-market for RENTAL listings here right now (not sales)? A rising rental-DOM trend means longer vacancies and softer asking-rent achievability than the comps imply.
- What's the recent tenant-quality profile in this submarket — average credit score on applications, eviction rate, late-payment / NSF rate, and stable-employment percentage? A property-management company in the area should have these aggregated.
- How much new apartment / multifamily construction is in the pipeline within 1–3 miles? Heavy new supply (>2% of stock underway) typically softens rents 12–24 months out; light construction supports rent growth.
Investment metrics
- 1% rule
- 1.38% ✓
- Cap rate
- 8.89%
- Cash-on-cash
- 9.29%
- DSCR
- 1.41
- GRM
- 6.0
CMA / ARV
- ARV (median comp)
- $127,670
- List price
- $100,000
- Delta
- -21.67%
- Verdict
- UNDERPRICED
- Comps
- 5 within 1.0 mi
Projected returns pro-forma
-3.0% appreciation · 2.67% rent growth · sell at horizon
- IRR
- -2.6%
- Equity multiple
- 0.90×
- Total profit
- $-2,729
- Equity at exit
- $14,910
- IRR
- 6.8%
- Equity multiple
- 1.50×
- Total profit
- $14,071
- Equity at exit
- $8,646
Cash invested: $28,000 (down + closing). Projections, not guarantees.
Landlord ↔ Tenant lean methodology
- Overall (STATE)
- 55 Moderately Landlord-Leaning
- State New Mexico
- 55 Moderately Landlord-Leaning · D+3
- County
- — inherits STATE
- City
- — inherits STATE
ZIP-level market 87110
- Rents YoY
- 2.7%
- Active inventory
- 192
- Price-to-rent
- 6.0×
Monthly cashflow live
- Estimated rent
- $1,381 high interval (Pro) →
- Mortgage (P&I)
- −$524
- Tax from tax record
- −$73 /mo · $882/yr
- Insurance
- −$42
- HOA
- −$235
- Vacancy / Maint / Mgmt
- −$290
- Net cashflow
- $217
Break-even live
Sensitivity live
| Price | -10% $273 | -5% $245 | +0% $217 | +5% $188 | +10% $160 |
|---|---|---|---|---|---|
| Rent | -10% $108 | -5% $162 | +0% $217 | +5% $271 | +10% $326 |
| Rate | -1.0pp $267 | -0.5pp $242 | base $217 | +0.5pp $191 | +1.0pp $164 |
UW: 25.0% down · 7.5% · 30yr · 1.5% tax · 5.0% vac · 8.0% maint · 8.0% mgmt
Financing live
Cash to close
- Down payment
- $25,000
- Closing costs
- $3,000
- Reserves months
- —
- Total cash needed
- —
Loan-product check · same deal, 3 products live
Conventional
25% down · 7.5% · 30yr
- Down + closing
- —
- Monthly P&I
- —
- Monthly cashflow
- —
- DSCR
- —
- Eligible?
- —
Personal DTI + credit; lowest rate.
DSCR
20% down · 8.5% · 30yr
- Down + closing
- —
- Monthly P&I
- —
- Monthly cashflow
- —
- DSCR
- —
- Eligible?
- —
No personal income docs; deal must DSCR.
Hard money
10% down · 12.0% · 12mo
- Down + closing
- —
- Monthly P&I
- —
- Monthly cashflow
- —
- DSCR
- —
- Eligible?
- —
Short-term bridge; refi at stabilization.
Rent comps 40 comps
| Address | Beds | Baths | Sqft | Rent | $/sqft | DOM | Units | Dist |
|---|---|---|---|---|---|---|---|---|
| 3908 Ortiz Ct NE Unit A Albuquerque, NM | 2.0 | 1.0 | 754 | $1,350 | $1.79 | 3d | 1 | 0.07mi |
| 5404 Montgomery Blvd NE Albuquerque, NM | 1.0–3.0 | 1.0–3.0 | 1502 | $1,882 | $1.25 | 3d | 8 | 0.27mi |
| 4806 Mescalero Rd NE Albuquerque, NM | 3.0 | 1.5 | 1000 | $1,750 | $1.75 | 24d | 1 | 0.50mi |
| 4400 Montgomery Blvd NE Albuquerque, NM | 1.0–3.0 | 1.0–1.5 | 834 | $1,554 | $1.86 | 3d | 20 | 0.51mi |
| 6300 Montgomery Blvd NE Albuquerque, NM | 1.0–2.0 | 1.0 | 710 | $1,435 | $2.02 | 3d | 6 | 0.54mi |
| 4800 San Mateo Ln NE Albuquerque, NM | 1.0–2.0 | 1.0 | 757 | $1,345 | $1.78 | 44d | 1 | 0.57mi |
| 6001 Topke Pl NE Albuquerque, NM | 1.0–3.0 | 1.0–2.0 | 756 | $1,392 | $1.84 | 3d | 23 | 0.60mi |
| 4401 Montgomery Blvd NE Albuquerque, NM | 1.0–3.0 | 1.0–2.0 | 1060 | $1,390 | $1.31 | 44d | 14 | 0.63mi |
| 4200 Montgomery Blvd NE #108 Albuquerque, NM | 1.0 | 1.0 | 848 | $1,200 | $1.42 | 44d | 1 | 0.65mi |
| 6500 Montgomery Blvd NE Albuquerque, NM | 1.0 | 1.0 | 720 | $1,045 | $1.45 | 44d | 5 | 0.66mi |
| 4321 Montgomery Blvd NE Albuquerque, NM | 3.0 | 1.0–2.0 | 900 | $1,234 | $1.37 | 44d | 19 | 0.67mi |
| 4401 San Pedro Dr NE Albuquerque, NM | 1.0–2.0 | 1.0 | 690 | $1,099 | $1.59 | 3d | 3 | 0.68mi |
| 3301 Monroe St NE Unit O158 Albuquerque, NM | 2.0 | 2.5 | 1042 | $1,400 | $1.34 | 24d | 1 | 0.68mi |
| 4501 Shepard Rd NE Albuquerque, NM | 2.0 | 1.0 | 449 | $1,125 | $2.50 | 3d | 26 | 0.77mi |
| 5324 San Mateo Blvd NE Albuquerque, NM | 1.0–2.0 | 1.0–2.0 | 748 | $1,691 | $2.26 | 3d | 27 | 0.87mi |
| 3904 Goodrich Ave NE Albuquerque, NM | 3.0 | 2.0 | 1050 | $1,895 | $1.80 | 19d | 1 | 0.90mi |
| 3131 Adams St NE Albuquerque, NM | 1.0–2.0 | 1.0–2.0 | 991 | $1,625 | $1.64 | 3d | 10 | 0.91mi |
| 4217 Louisiana Blvd NE Albuquerque, NM | 1.0–2.0 | 1.0–2.0 | 900 | $1,395 | $1.55 | 3d | 11 | 0.94mi |
| 3901 Montgomery Blvd NE Albuquerque, NM | 1.0–2.0 | 1.0–2.0 | 768 | $1,305 | $1.70 | 15d | 9 | 0.97mi |
| 4949 San Pedro Dr NE Albuquerque, NM | 1.0–2.0 | 1.0–2.0 | 900 | $1,495 | $1.66 | 3d | 9 | 1.02mi |
| 5800 Osuna Rd NE Albuquerque, NM | 1.0–2.0 | 1.0–2.0 | 820 | $1,555 | $1.90 | 3d | 23 | 1.08mi |
| 7100 Natalie Ave NE Albuquerque, NM | 1.0–3.0 | 1.0–2.5 | 1015 | $1,350 | $1.33 | 3d | 8 | 1.13mi |
| 4601 Carlisle Blvd NE Unit H-1 Albuquerque, NM | 1.0 | 1.0 | 543 | $875 | $1.61 | 19d | 1 | 1.18mi |
| 3528 Tyson Pl NE Unit C Albuquerque, NM | 2.0 | 1.0 | 780 | $1,050 | $1.35 | 44d | 1 | 1.23mi |
| 3417 Aztec Rd NE Apt D Albuquerque, NM | 2.0 | 1.0 | 828 | $1,050 | $1.27 | 21d | 1 | 1.27mi |
| 3504 Tulane Dr NE Apt D Albuquerque, NM | 2.0 | 1.0 | 786 | $1,075 | $1.37 | 3d | 1 | 1.28mi |
| 5741 Osuna Rd NE Albuquerque, NM | 1.0–2.0 | 1.0–2.0 | 769 | $1,565 | $2.03 | 3d | 17 | 1.28mi |
| 3400 Comanche Rd NE Albuquerque, NM | 2.0 | 1.0 | 573 | $1,218 | $2.12 | 3d | 13 | 1.28mi |
| 2838 Aliso Dr NE Albuquerque, NM | 2.0 | 1.0 | 760 | $1,895 | $2.49 | 44d | 1 | 1.31mi |
| 3617 Wellesley Dr NE Unit C Albuquerque, NM | 2.0 | 1.0 | 850 | $1,350 | $1.59 | 44d | 1 | 1.33mi |
| 3210 Tulane Dr NE Albuquerque, NM | 1.0 | 1.0 | 600 | $825 | $1.38 | 44d | 1 | 1.34mi |
| 3621 Wellesley Dr NE Unit C Albuquerque, NM | 2.0 | 1.0 | 850 | $1,250 | $1.47 | 44d | 1 | 1.34mi |
| 4300 Bryn Mawr Dr NE Albuquerque, NM | 2.0 | 1.0–2.0 | 797 | $1,520 | $1.91 | 44d | 3 | 1.35mi |
| 3618 Lafayette Dr NE Unit A Albuquerque, NM | 2.0 | 1.0 | 880 | $1,100 | $1.25 | 3d | 1 | 1.37mi |
| 3618 Lafayette Dr NE Unit D Albuquerque, NM | 2.0 | 1.0 | 900 | $1,095 | $1.22 | 44d | 1 | 1.37mi |
| 3600 Lafayette Dr NE Unit A Albuquerque, NM | 2.0 | 1.0 | 750 | $895 | $1.19 | 44d | 1 | 1.37mi |
| 6401 Academy Rd NE Albuquerque, NM | 3.0 | 1.0–2.0 | 808 | $1,560 | $1.93 | 3d | 16 | 1.38mi |
| 7501 Montgomery Blvd NE Albuquerque, NM | 1.0–2.0 | 1.0–2.0 | 707 | $1,328 | $1.88 | 3d | 9 | 1.40mi |
| 3217 Wellesley Ct NE Albuquerque, NM | 1.0 | 1.0 | 635 | $995 | $1.57 | 44d | 1 | 1.40mi |
| 3213 Alta Monte Ave NE Unit 4 Albuquerque, NM | 2.0 | 1.0 | 665 | $925 | $1.39 | 15d | 1 | 1.44mi |
HOA detail condo
- Monthly dues
- $235 · $2,820/yr
- Assessments
- None detected in remarks — confirm with the listing agent.
Listing history 17 events
-
2026-06-18days on market $100,000 Active 57 DOM
-
2026-06-17days on market $100,000 Active 56 DOM
-
2026-06-16days on market $100,000 Active 55 DOM
-
2026-06-15days on market $100,000 Active 54 DOM
-
2026-06-13days on market $100,000 Active 52 DOM
-
2026-06-10days on market $100,000 Active 49 DOM
-
2026-06-09days on market $100,000 Active 48 DOM
-
2026-06-08days on market $100,000 Active 47 DOM
-
2026-06-07days on market $100,000 Active 46 DOM
-
2026-06-05days on market $100,000 Active 43 DOM
-
2026-06-03days on market $100,000 Active 42 DOM
-
2026-06-02days on market $100,000 Active 41 DOM
-
2026-06-01days on market $100,000 Active 40 DOM
-
2026-05-31days on market $100,000 Active 39 DOM
-
2026-04-18$112,000 Active 282-char remark
Show marketing remark (282 chars)
Inviting first-floor condo featuring a thoughtfully designed layout that offers both comfort and functionality, along with the convenience of two dedicated parking spaces. Affordably priced, this home presents a great opportunity for first-time buyers or those looking to downsizes.
-
2026-03-28price $115,000
-
2007-07-26soldstatus
ⓘ Source: listings_history table (triggers on properties + properties_extension) + one-shot
backfill from property_details.listing_events for pre-trigger history.
Tax reassessment forecast NM · Resets to sale price
- Current annual tax
- $882 · $73/mo
- Projected year-2 tax
- $882 · $73/mo
- Expected delta
- $0/yr ($0/mo · 0.0%)
ⓘ Screening estimate from a state-policy table — verify with the county assessor before closing.
Climate risk First Street
- Flood 1/10 Low FEMA zone X (unshaded) · 0% chance over 30 yrs
- Wildfire 1/10 Low
- Heat 5/10 Major 6 d/yr ≥95°F today · 14 d/yr by 30 yrs out
- Wind 1/10 Low
- Air quality 2/10 Low 1 unhealthy d/yr today · 3 by 30 yrs out
Nearby sold comps map
Loading sold comps map…
Walkable amenities ~0.75 mi
Loading nearby amenities…
Taxation est. · year 1
- Rental income
- $16,575
- − Mortgage interest
- −$5,602
- − Property taxes
- −$882
- − Insurance
- −$500
- − Repairs & maintenance
- −$1,326
- − Management
- −$1,326
- − HOA
- −$2,820
- − Depreciation
- −$2,909
- Taxable income
- $1,211
- Est. tax owed @ 24.0%
- −$291
- After-tax cash flow
- $2,309/yr
For passive investors: Depreciation is non-cash, so a rental often shows a tax loss while cash-flowing — sheltering income. Rental losses are passive: they offset passive income freely, and up to $25,000/yr can offset ordinary (W-2) income if you actively participate and your MAGI is under $100k (phasing out to $0 by $150k); unused losses carry forward. On sale, claimed depreciation is recaptured at up to 25%, and gains may owe capital-gains tax (a 1031 exchange can defer both). Figures are a year-1 estimate at your 24.0% rate — not tax advice; consult a CPA.
Schools (NCES district)
- District
- Albuquerque Public Schools
- NCES district ID
- 3500060
- Math proficiency
- 51% ▲ 30.00%
- Reading proficiency
- 75% ▲ 45.00%
- Median HH income
- $48,151
- Composite
- 53.29/100
- National rank
- #1487
- State rank
- #3 of 29 in NM
Livability — Albuquerque
- Score
- 72/100
- State rank
- #13
- US rank
- #6219
Category grades
Schools grade is shown separately in the Schools card above.
Census & demographics
- Census place
- Albuquerque, NM
- County
- Bernalillo County · 647,165 people
- City population
- 647,165
- Metro
- Albuquerque, NM
- Population (ZIP)
- 39,685
- Household income
- $64,892
- Rent vs Own
- Severe rent burden
- 1845.0
Population outlook (Bernalillo County) Hauer SSP2
- Today (2025)
- 704,528 people
- By 2030
- 711,723 · +1.0%
- By 2040
- 714,522 · +1.4%
- By 2050
- 709,274 · +0.7%
- By 2075
- 680,015 · -3.5%
- By 2100
- 619,879 · -12.0%
Race, ethnicity, and origin ACS 2023
- Neighborhood character
- Diverse neighborhood (Simpson 0.65)
- Race & ethnicity
- White 44% Hispanic / Latino 39% Two or more races 18% Native American 5% Black 4% Asian 2%
- Hispanic origin (detail)
- Mexican 22%
- Common ancestry
- Lithuanian 2% Italian 2% Iranian 2%
- Foreign-born
- 8% · Canada, China, Vietnam
- Languages at home
- 80% English-only · Spanish 14% Chinese 1% Other Indo-European 1%
Political lean MEDSL · Bernalillo
- 2024 margin
- Strong D (+21.0) · D 59.2% · R 38.2% · Other 2.6%
- 2008→2024 swing
- -0.3pp no change · 2008: 21.4pp · 2024: 21.0pp
- All cycles
- 2024: D+21.0 2020: D+24.4 2016: D+17.8 2012: D+16.2 2008: D+21.4
Not yet ingested
- Civics
- —
Market trends
- HPI YoY
- ▼ -329.45%
- Current HPI
- 256.0806
- Rent YoY
- ▲ 2.67%
- Metro
- Albuquerque, NM
- State GDP YoY
- —
- F500 in state
- 0
Price history
-2.6% since first listed3 events — show timeline
- 2026-04-18 Listed $112,000 Southwest MLS
- 2026-03-28 Price Changed $115,000 Southwest MLS
- 2007-07-26 Sold (Public Records) — Public Records
Property tax history
+1.6%/yrLatest (2025): $882 · +3.2% YoY. Source: county tax records.
Cash-flow waterfall
monthlySold comps — $/sqft
last 12 mo · ≤1 miLoading sold comps…