 🔨 Auction
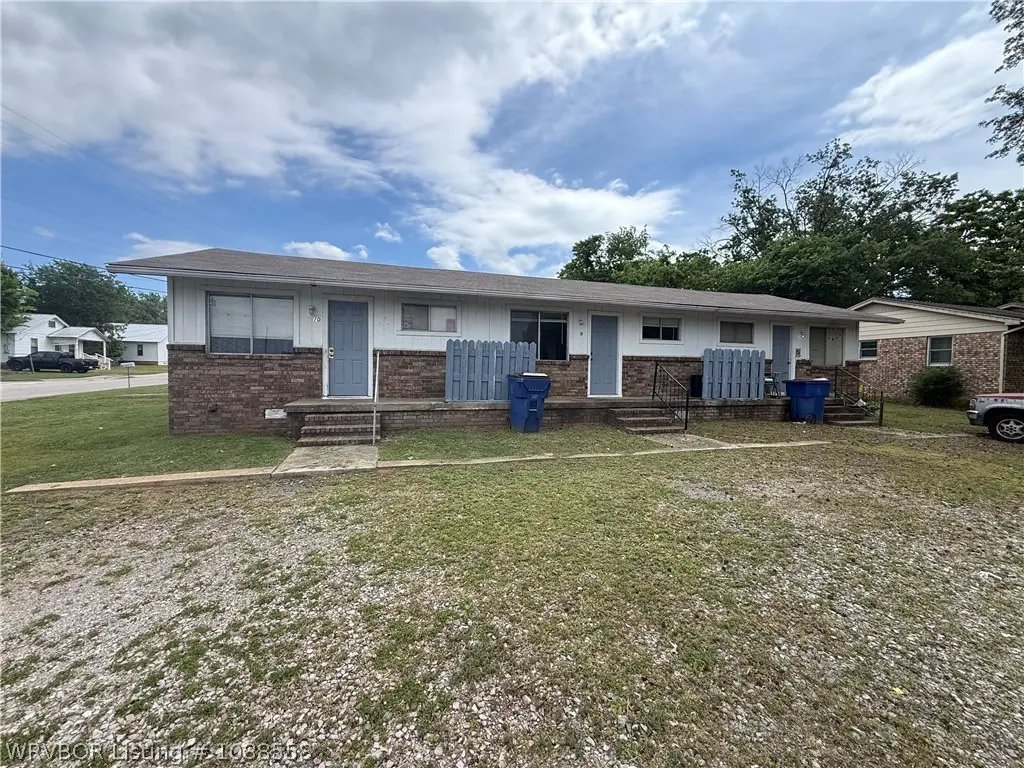
7800, 7801, 7916, 8000 Thayer Dr · Fort Smith, AR
Flood risk 1/10 · Minimal
- FEMA flood zone
- X (unshaded)
- Chance of flooding over 30 yrs
- 0.0%
- Est. flood insurance / yr
- $507 – $1,088
Fire risk 4/10 · Minor
- Est. fire insurance / yr
- $1,499 – $2,785
Heat risk 7/10 · Major
- Hot days now (above 111°F)
- 7 days/yr
- Hot days in 30 yrs
- 20 days/yr
Wind risk 2/10 · Minimal
- Chance of severe wind over 30 yrs
- 3.0%
Air-quality risk 2/10 · Minimal
- Unhealthy air days now
- 0 days/yr
- Unhealthy air days in 30 yrs
- 1 days/yr
Risk factors via First Street. Map © Google.
Why this score? — see what drove the F grade
The composite is a weighted blend of 9 inputs, each scored 0–100. Each bar is that input's sub-score; the figure is the points it added to the 100-point composite (weight × sub-score).
- ARV discount +7.5/15.0
- Cash flow +3.5/30.0
- Livability +3.2/5.0
- Schools +3.1/10.0
- Rent growth +2.5/5.0
- Condition / age +2.5/5.0
- 1% rule +0.0/10.0
- DSCR +0.0/10.0
- Appreciation +0.0/10.0
$1
🖨 Deal sheet (PDF) 📄 Offer letter ✓ Due diligence
Listing remarks
Auction 05/20/2026 at 11:00 AM Thayer Multi-Family Portfolio – 16 Total Units Investment opportunity featuring 16 units across 4 separate properties, all selling individually. All units are 1 bedroom, 1 bathroom, offering a consistent and easy-to-manage layout across the portfolio. 7801 Thayer & 1200 School St. – Tri-plex plus single-family home (one unit currently vacant, remainder occupied) 7800 Thayer – 4-plex 7916 Thayer – 4-plex 8000 Thayer – 4-plex Average rents are approximately $500/month. One unit in the tri-plex is currently vacant, with the remaining units occupied. Strong rental history with upside potential through increased rents and
Key facts
- 0.31 acre lot
- Listed 29 days
Property features AI
Exterior
- Parking: Gravel parking; Assigned parking; On-street parking
- Security: Smoke detector(s)
- Utilities: Public maintained road (access); Gas water heater (on-site)
- Home design: Residential quadruplex; Single level (1 story)
- Construction: Brick and frame construction; Shingle roof
- Exterior features: Cleared, city lot; Paved public road access
Interior
- Flooring: Laminate or simulated wood flooring
- Heating & cooling: Electric heating; Window air conditioning units
- Interior features: Gas water heater; Smoke detector(s)
- Laundry & utility: No laundry in-unit
Neighborhood map
What this means for you Summary
Snapshot
- This is a ?-bed/4.0-bath single-family listed at $1.
Deal economics
- At list price, monthly cash flow is $-768 ($-9k/yr) — negative.
- The deal already cash-flows at list — no discount required.
- Meets the 1% rule at list price ($1k rent vs $1).
- Cap rate 2.7% vs local median 4.3% in Fort Smith — below-typical yield; the buyer is paying a premium for something (appreciation thesis, condition, location) that the cap rate doesn't capture.
Location & tenants
- Location reads 65/100 on livability (#151 in AR) — a middle-class / working-renter tenant base. Strengths: cost of living A+, housing A+, health & safety A+; Watch: crime F, amenities F, commute F.
- Fort Smith School District (urban): math 35% / reading 39% proficiency, ranked #106 of 238 in AR (top 44%) — families likely to look elsewhere, expect single-tenant / working-renter base with shorter leases; 64% free/reduced lunch — lower-income household profile, screen leases tightly.
- Zoned schools: Cavanaugh Elementary School (math 57% / reading 52%, grade C, #60 of 454 statewide, top 15%, 310 students, 66% FRL); Ramsey Junior High School (math 37% / reading 47%, grade D-, #78 of 201 statewide, top 40%, 832 students, 67% FRL); Southside High School (math 36% / reading 53%, grade F, #31 of 292 statewide, top 12%, 1,956 students, 47% FRL) — zoned schools at 60% FRL track the district average.
- Market conditions: 97 active listings in the ZIP; 1 comparable units currently listed for rent nearby; 388 units permitted in Sebastian County in 2024 (16 in 5+ unit buildings).
Forward outlook
- Local home prices are declining (-3.0%/yr); year-one equity from $2k of loan paydown is wiped out by about $8k of value loss. Plan a longer hold.
- Sebastian County population projected at +7% by 2050 — modest demand growth; plan on rents tracking national, not racing it.
Negotiation context
- It's been on market 29 days — a 2% lower offer ($0) is reasonable based on typical stale-listing flexibility.
Risks & watch-outs
- Watch-outs: property tax is 382320.0% of price.
- Climate carrying-cost: extreme-heat days projected 7→20/yr by 2055 (HVAC capex compounding) — expect insurance premiums to compound above CPI over the hold.
Questions for the listing agent
- What do current leases actually rent for vs. the listed asking? Can we see a recent rent roll and the last 12 months of T-12 income?
- Property tax is high relative to price — has the assessment been appealed recently, and will the sale trigger a re-assessment?
- Is there a deadline driving the sale (1031 exchange, divorce, estate, relocation)? That informs how much negotiation room exists.
- Schools are D-rated, which usually means shorter tenancies and higher turnover. Who's the typical renter profile here, and what's been the actual vacancy rate?
- Crime grade is F in this area — have there been break-ins, vandalism, or insurance claims at this property in the last 3 years? What carrier currently insures it and at what premium?
- The area grade is low — what's the realistic commute time and amenity access for the typical tenant pool here? Any planned neighborhood developments (good or bad) we should know about?
- What's the average days-on-market for RENTAL listings here right now (not sales)? A rising rental-DOM trend means longer vacancies and softer asking-rent achievability than the comps imply.
- What's the recent tenant-quality profile in this submarket — average credit score on applications, eviction rate, late-payment / NSF rate, and stable-employment percentage? A property-management company in the area should have these aggregated.
- How much new for-sale + rental construction is in the pipeline within 1–3 miles? Heavy new supply typically softens prices + rents 12–24 months out; constrained supply supports both.
Investment metrics
- 1% rule
- 0.49% ✗
- Cap rate
- 2.68%
- Cash-on-cash
- -12.92%
- DSCR
- 0.43
- GRM
- 16.9
CMA / ARV
- ARV (on-the-fly)
- $254,880
- Comps found
- 11
Show comp detail 11 sales within ~0.75 mi
| Address | Dist | Beds/Ba | Sqft | Sold | Price | $/sf | Match |
|---|---|---|---|---|---|---|---|
| 8611 Vickery Ln | 0.56mi | 3/2.5 | 2,223 (+3%) | 12mo | $299,150 | $135 | 53 |
| 1508 Princeton Dr | 0.72mi | 3/2.0 | 2,111 (-2%) | 3mo | $250,000 | $118 | 52 |
| 1300 Meadow Cir | 0.33mi | 3/2.0 | 1,850 (-14%) | 2mo | $150,000 | $81 | 51 |
| 8005 Hermitage Dr | 0.53mi | 4/2.0 | 2,240 (+4%) | 12mo | $243,500 | $109 | 51 |
| 8305 Meadow Dr | 0.46mi | 3/2.0 | 2,340 (+8%) | 7mo | $308,000 | $132 | 51 |
| 708 Windbrook Ct | 0.42mi | 4/2.0 | 1,988 (-8%) | 12mo | $315,000 | $158 | 49 |
| 1301 Meadow Cir | 0.31mi | 3/2.0 | 1,850 (-14%) | 14mo | $219,000 | $118 | 42 |
| 712 Windbrook Ct | 0.41mi | 4/2.0 | 1,879 (-13%) | 14mo | $262,000 | $139 | 40 |
| 7811 Meadow Dr | 0.33mi | 3/2.0 | 1,862 (-14%) | 17mo | $219,000 | $118 | 40 |
| 8206 Avignon Ln | 0.57mi | 3/2.0 | 1,892 (-12%) | 16mo | $265,000 | $140 | 32 |
| 725 Cedar Ln | 0.74mi | 4/3.0 | 2,382 (+10%) | 19mo | $232,000 | $97 | 29 |
Match score weights: distance 35% · size 25% · config 20% · recency 20%. Top-matched comps best support the ARV.
Projected returns pro-forma
-3.0% appreciation · 3.0% rent growth · sell at horizon
- IRR
- -40.4%
- Equity multiple
- -0.26×
- Total profit
- $-90,207
- Equity at exit
- $38,003
- IRR
- -65.2%
- Equity multiple
- -0.98×
- Total profit
- $-141,472
- Equity at exit
- $22,037
Cash invested: $71,366 (down + closing). Projections, not guarantees.
Landlord ↔ Tenant lean methodology
- Overall (STATE)
- 92 Strongly Landlord-Friendly
- State Arkansas
- 92 Strongly Landlord-Friendly · R+14
- County
- — inherits STATE
- City
- — inherits STATE
ZIP-level market 72908
- Active inventory
- 97
Monthly cashflow live
- Estimated rent
- $1,257 medium interval (Pro) →
- Mortgage (P&I)
- −$1,337
- Tax est. 1.5%
- −$319 /mo · $3,823/yr
- Insurance
- −$106
- HOA
- −$0
- Vacancy / Maint / Mgmt
- −$264
- Net cashflow
- $-768
Break-even live
Sensitivity live
| Price | -10% $-592 | -5% $-680 | +0% $-768 | +5% $-856 | +10% $-944 |
|---|---|---|---|---|---|
| Rent | -10% $-867 | -5% $-818 | +0% $-768 | +5% $-718 | +10% $-669 |
| Rate | -1.0pp $-640 | -0.5pp $-703 | base $-768 | +0.5pp $-834 | +1.0pp $-901 |
UW: 25.0% down · 7.5% · 30yr · 1.5% tax · 5.0% vac · 8.0% maint · 8.0% mgmt
Financing live
Cash to close
- Down payment
- $63,720
- Closing costs
- $7,646
- Reserves months
- —
- Total cash needed
- —
Loan-product check · same deal, 3 products live
Conventional
25% down · 7.5% · 30yr
- Down + closing
- —
- Monthly P&I
- —
- Monthly cashflow
- —
- DSCR
- —
- Eligible?
- —
Personal DTI + credit; lowest rate.
DSCR
20% down · 8.5% · 30yr
- Down + closing
- —
- Monthly P&I
- —
- Monthly cashflow
- —
- DSCR
- —
- Eligible?
- —
No personal income docs; deal must DSCR.
Hard money
10% down · 12.0% · 12mo
- Down + closing
- —
- Monthly P&I
- —
- Monthly cashflow
- —
- DSCR
- —
- Eligible?
- —
Short-term bridge; refi at stabilization.
Rent comps 1 comps
| Address | Beds | Baths | Sqft | Rent | $/sqft | DOM | Units | Dist |
|---|---|---|---|---|---|---|---|---|
| 1415 Willowbrook Cir Fort Smith, AR | 3.0 | 2.0 | 1650 | $1,299 | $0.79 | 15d | 1 | 1.20mi |
Listing history 4 events
-
2026-05-21status Pending
-
2026-04-21$1 Active
-
2001-09-07soldstatus $38,000
-
1996-12-30soldstatus $40,000
ⓘ Source: listings_history table (triggers on properties + properties_extension) + one-shot
backfill from property_details.listing_events for pre-trigger history.
Climate risk First Street
- Flood 1/10 Low FEMA zone X (unshaded) · 0% chance over 30 yrs
- Wildfire 4/10 Moderate
- Heat 7/10 Severe 7 d/yr ≥111°F today · 20 d/yr by 30 yrs out
- Wind 2/10 Low 3% chance of damaging wind over 30 yrs
- Air quality 2/10 Low 0 unhealthy d/yr today · 1 by 30 yrs out
Nearby sold comps map
Loading sold comps map…
Walkable amenities ~0.75 mi
Loading nearby amenities…
Taxation est. · year 1
- Rental income
- $15,087
- − Mortgage interest
- −$14,277
- − Property taxes
- −$3,823
- − Insurance
- −$1,274
- − Repairs & maintenance
- −$1,207
- − Management
- −$1,207
- − Depreciation
- −$7,415
- Taxable loss
- −$14,116
- Est. tax savings @ 24.0%
- +$3,388
- After-tax cash flow
- $-5,830/yr
For passive investors: Depreciation is non-cash, so a rental often shows a tax loss while cash-flowing — sheltering income. Rental losses are passive: they offset passive income freely, and up to $25,000/yr can offset ordinary (W-2) income if you actively participate and your MAGI is under $100k (phasing out to $0 by $150k); unused losses carry forward. On sale, claimed depreciation is recaptured at up to 25%, and gains may owe capital-gains tax (a 1031 exchange can defer both). Figures are a year-1 estimate at your 24.0% rate — not tax advice; consult a CPA.
Schools (NCES district)
- District
- Fort Smith School District
- NCES district ID
- 0506330
- Math proficiency
- 35% ▼ -11.00%
- Reading proficiency
- 39% ▼ -7.00%
- Median HH income
- $36,066
- Composite
- 30.66/100
- National rank
- #6183
- State rank
- #106 of 238 in AR
Livability — Fort Smith
- Score
- 65/100
- State rank
- #151
- US rank
- #13185
Category grades
Schools grade is shown separately in the Schools card above.
Census & demographics
- Census place
- Fort Smith, AR
- County
- Sebastian County · 99,312 people
- City population
- 94,356
- Metro
- Fort Smith, AR-OK
- Population (ZIP)
- 14,288
- Household income
- $72,732
- Rent vs Own
- Severe rent burden
- 354.0
Population outlook (Sebastian County) Hauer SSP2
- Today (2025)
- 133,992 people
- By 2030
- 136,620 · +2.0%
- By 2040
- 140,832 · +5.1%
- By 2050
- 143,301 · +6.9%
- By 2075
- 147,964 · +10.4%
- By 2100
- 145,848 · +8.8%
Race, ethnicity, and origin ACS 2023
- Neighborhood character
- Predominantly White (74%)
- Race & ethnicity
- White 74% Two or more races 11% Hispanic / Latino 9% Asian 6% Black 2% Native American 2%
- Hispanic origin (detail)
- Mexican 6%
- Common ancestry
- Slovak 4% Lithuanian 4% Italian 1%
- Foreign-born
- 5% · Vietnam, Canada
- Languages at home
- 90% English-only · Spanish 4% Vietnamese 3% Other Asian/Pacific 2%
Political lean MEDSL · Sebastian
- 2024 margin
- Solid R (+37.5) · D 30.0% · R 67.6% · Other 2.4%
- 2008→2024 swing
- -2.9pp toward R · 2008: -34.6pp · 2024: -37.5pp
- All cycles
- 2024: R+37.5 2020: R+35.5 2016: R+38.1 2012: R+37.1 2008: R+34.6
Not yet ingested
- Civics
- —
Market trends
- HPI YoY
- ▼ -136.01%
- Current HPI
- 202.0886
- Rent YoY
- —
- Metro
- Fort Smith, AR-OK
- State GDP YoY
- ▲ 3.80%
- F500 in state
- 10
Industry mix (Fortune 500 HQ in AR)
| Industry | F500 HQs | Revenue |
|---|---|---|
| Retail | 1 | $681B |
|
||
| Food / Agriculture | 1 | $53B |
|
||
| Retail / Energy | 1 | $22B |
|
||
| Transportation / Logistics | 1 | $12B |
|
||
| Energy | 1 | $4B |
|
||
Price history
-5.0% since first listed4 events — show timeline
- 2026-05-21 Pending — WRVBOR
- 2026-04-21 Listed $1 WRVBOR
- 2001-09-07 Sold (Public Records) $38,000 Public Records
- 1996-12-30 Sold (Public Records) $40,000 Public Records
Property tax history
+2.4%/yrLatest (2025): $1,133 · +8.9% YoY. Source: county tax records.
Cash-flow waterfall
monthlySold comps — $/sqft
last 12 mo · ≤1 miLoading sold comps…