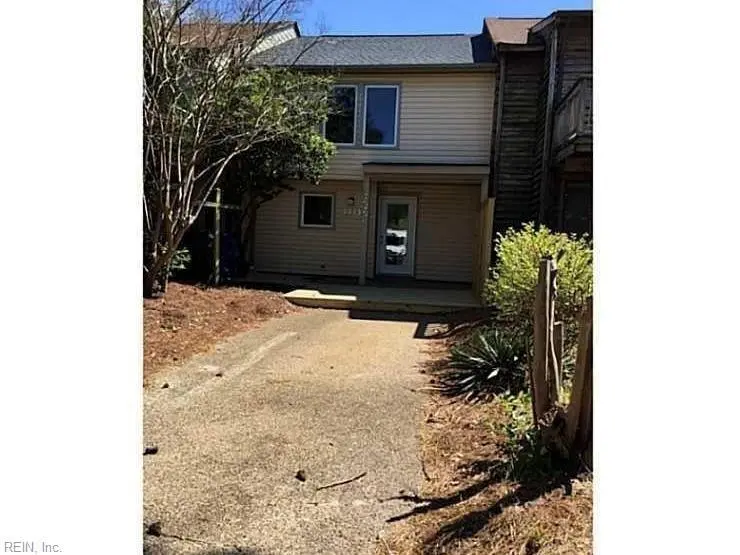
3813 Mystic Cove Ct · Virginia Beach, VA
Flood risk 4/10 · Minor
- FEMA flood zone
- X (unshaded)
- Chance of flooding over 30 yrs
- 0.13%
- Est. flood insurance / yr
- $507 – $1,088
Fire risk 1/10 · Minimal
- Est. fire insurance / yr
- $666 – $1,236
Heat risk 9/10 · Severe
- Hot days now (above 102°F)
- 7 days/yr
- Hot days in 30 yrs
- 18 days/yr
Wind risk 8/10 · Major
- Chance of severe wind over 30 yrs
- 99.0%
Air-quality risk 2/10 · Minimal
- Unhealthy air days now
- 1 days/yr
- Unhealthy air days in 30 yrs
- 2 days/yr
Risk factors via First Street. Map © Google.
Why this score? — see what drove the D+ grade
The composite is a weighted blend of 9 inputs, each scored 0–100. Each bar is that input's sub-score; the figure is the points it added to the 100-point composite (weight × sub-score).
- ARV discount +15.0/15.0
- Cash flow +11.0/30.0
- Schools +6.4/10.0
- Livability +4.2/5.0
- Rent growth +4.0/5.0
- DSCR +3.2/10.0
- 1% rule +2.6/10.0
- Condition / age +2.5/5.0
- Appreciation +0.0/10.0
$399,000
🖨 Deal sheet (PDF) 📄 Offer letter ✓ Due diligence
Listing remarks
Opportunity awaits at 3813 Mystic Cove! This property is full of potential and ready for your vision, making it an excellent option for investors or buyers eager to build equity. With a little TLC, this home can truly shine. Whether you're planning to a rent the property, or customize your own home, the possibilities here are endless. The location is everything! Conveniently situated near popular restaurants, shopping, major military bases, Brock Center, and the beach. Enjoy the best of coastal living, don't miss your chance to secure a home in a prime area and make it your own! Photo disclaimer: photos are of the home several years ago to show the finishes that are currently in the home.
Key facts
- 2 parking spots
- Built 1977
- Listed 17 days
Property features AI
Finance
- Other: Located in the Ocean Park neighborhood
- HOA & community: No HOA or POA fees reported
Exterior
- Parking: Driveway parking for 2 vehicles
- Utilities: City/County water; City/County sewer; Electric water heater
- Home design: Attached townhouse; Transitional style; 2 stories; Slab foundation; Simple ownership
- Construction: Vinyl siding; Asphalt shingle roof
- Exterior features: Patio; Back yard with wood fencing
Interior
- Kitchen: Electric range; Dishwasher; Garbage disposal; Refrigerator
- Bedrooms: Master bedroom with ensuite
- Flooring: Carpet; Ceramic; Laminate
- Bathrooms: 2 full bathrooms; 1 half bathroom
- Heating & cooling: Heat pump for heating and cooling
- Interior features: Fireplace (wood-burning); Cable hookup; Primary bathroom with double sink
- Laundry & utility: Washer; Dryer; Utility room
Neighborhood map
What this means for you Summary
Snapshot
- This is a 3-bed/2.5-bath townhouse listed at $399k.
Deal economics
- At list price, monthly cash flow is $-166 ($-2k/yr) — negative.
- To cash-flow at today's rent, offer at most $370k (7.3% below list).
- To meet the 1% rule (rent ≥ 1% of price), the offer needs to be $305k (23.5% below list).
- Recommended offer: $305k (23.5% below list) — sets the bar for 1% rule.
- Cap rate 5.8% vs local median 3.5% in Virginia Beach — top-decile yield for the area; either an underpriced asset or a hidden risk that comps aren't pricing in. Stress-test before assuming the spread holds.
Location & tenants
- Location reads 83/100 on livability (#38 in VA, #880 nationally) — a professional / high-income tenant draw. Strengths: amenities A+, employment A+, housing A+; Watch: cost of living C-, commute F.
- Va Beach City Public School District (urban): math 69% / reading 78% proficiency, ranked #10 of 131 in VA (top 8%) — strong family-tenant draw, lease renewals of 3-5y typical.
- Zoned schools: Thoroughgood Elementary (math 81% / reading 89%, grade A+, #66 of 1,108 statewide, top 6%, 749 students, 20% FRL); Great Neck Middle (math 83% / reading 85%, grade A+, #16 of 342 statewide, top 4%, 1,055 students, 29% FRL); Frank W. Cox High (math 81% / reading 88%, grade A, #23 of 319 statewide, top 8%, 1,681 students, 27% FRL) — zoned schools at 25% FRL track the district average.
- Market conditions: Rents rising fast (+5.9%/yr); 207 active listings in the ZIP; 16 comparable units currently listed for rent nearby; rentals at typical pace (median 26d on market — plan ~3-4 weeks tenant-placement turnaround); solid renter incomes; 666 units permitted in Virginia Beach city in 2024 (347 in 5+ unit buildings).
- This rent runs 39% of the median local income ($94k/yr) — at the standard rent-burdened threshold; future hikes will face affordability resistance.
Forward outlook
- Local home prices are declining (-3.0%/yr); year-one equity from $3k of loan paydown is wiped out by about $12k of value loss. Plan a longer hold.
- Virginia Beach County population projected at +6% by 2050 — modest demand growth; plan on rents tracking national, not racing it.
Negotiation context
- It's been on market 17 days — a 2% lower offer ($393k) is reasonable based on typical stale-listing flexibility.
- 4 sale attempts since 11y ago with the ask held roughly flat each time — persistent listings suggest the price (not the market) is what's stuck; bring a comps-based counter.
- Current owner paid $269k; 48% above their basis — modest negotiation headroom, anchor on the comps not their cost.
Risks & watch-outs
- Climate carrying-cost: severe wind risk, 99% chance of damaging wind over 30y; extreme-heat days projected 7→18/yr by 2055 (HVAC capex compounding) — expect insurance premiums to compound above CPI over the hold.
Questions for the listing agent
- What do current leases actually rent for vs. the listed asking? Can we see a recent rent roll and the last 12 months of T-12 income?
- Built in 1977 — when were the roof, HVAC, electrical panel, plumbing, and water heater last replaced?
- Is there a deadline driving the sale (1031 exchange, divorce, estate, relocation)? That informs how much negotiation room exists.
- Schools are A-rated — typically a magnet for longer-tenancy family renters. What's the average tenant stay here, and is there a school-zone premium baked into asking?
- The area grade is low — what's the realistic commute time and amenity access for the typical tenant pool here? Any planned neighborhood developments (good or bad) we should know about?
- What's the average days-on-market for RENTAL listings here right now (not sales)? A rising rental-DOM trend means longer vacancies and softer asking-rent achievability than the comps imply.
- What's the recent tenant-quality profile in this submarket — average credit score on applications, eviction rate, late-payment / NSF rate, and stable-employment percentage? A property-management company in the area should have these aggregated.
- How much new for-sale + rental construction is in the pipeline within 1–3 miles? Heavy new supply typically softens prices + rents 12–24 months out; constrained supply supports both.
Investment metrics
- 1% rule
- 0.76% ✗
- Cap rate
- 5.79%
- Cash-on-cash
- -1.78%
- DSCR
- 0.92
- GRM
- 10.9
CMA / ARV
- ARV (on-the-fly)
- $513,422
- Comps found
- 12
Show comp detail 12 sales within ~0.75 mi
| Address | Dist | Beds/Ba | Sqft | Sold | Price | $/sf | Match |
|---|---|---|---|---|---|---|---|
| 3813 Mystic Cove Ct | 0.00mi | 3/2.5 | 1,519 (0%) | 1mo | $385,000 | $253 | 99 |
| 2104 Whispering Sands Ln | 0.06mi | 2/2.5 (-1) | 1,519 (0%) | 1mo | $434,900 | $286 | 91 |
| 3855 Ocean Tides Dr | 0.11mi | 2/2.5 (-1) | 1,508 (-1%) | 0mo | $419,000 | $278 | 88 |
| 3817 Long Ship Ct | 0.23mi | 2/2.5 (-1) | 1,406 (-7%) | 0mo | $485,000 | $345 | 72 |
| 3556 Shore Dr #804 | 0.44mi | 2/2.0 (-1) | 1,508 (-1%) | 2mo | $630,000 | $418 | 70 |
| 3730 Chesterfield Ave | 0.16mi | 3/3.0 | 1,671 (+10%) | 5mo | $555,000 | $332 | 69 |
| 3724 Chesterfield Ave | 0.18mi | 3/2.5 | 1,704 (+12%) | 3mo | $500,000 | $293 | 69 |
| 3556 Shore Dr #705 | 0.44mi | 2/2.0 (-1) | 1,543 (+2%) | 4mo | $670,000 | $434 | 67 |
| 3950 Whispering Oaks Pl | 0.69mi | 3/2.5 | 1,513 (-0%) | 3mo | $613,500 | $405 | 64 |
| 3556 Shore Dr #704 | 0.44mi | 2/2.0 (-1) | 1,586 (+4%) | 6mo | $660,000 | $416 | 60 |
| 3903 Aeries Way | 0.56mi | 3/2.5 | 1,657 (+9%) | 2mo | $560,000 | $338 | 57 |
| 2367 Madison Ave | 0.44mi | 2/2.5 (-1) | 1,365 (-10%) | 5mo | $460,000 | $337 | 53 |
Match score weights: distance 35% · size 25% · config 20% · recency 20%. Top-matched comps best support the ARV.
Projected returns pro-forma
-3.0% appreciation · 5.93% rent growth · sell at horizon
- IRR
- -16.3%
- Equity multiple
- 0.41×
- Total profit
- $-66,023
- Equity at exit
- $59,492
- IRR
- -3.7%
- Equity multiple
- 0.72×
- Total profit
- $-30,996
- Equity at exit
- $34,498
Cash invested: $111,720 (down + closing). Projections, not guarantees.
Landlord ↔ Tenant lean methodology
- Overall (STATE)
- 55 Moderately Landlord-Leaning
- State Virginia
- 55 Moderately Landlord-Leaning · D+2
- County
- — inherits STATE
- City
- — inherits STATE
ZIP-level market 23455
- Rents YoY
- 5.9%
- Active inventory
- 207
- Price-to-rent
- 10.9×
Monthly cashflow live
- Estimated rent
- $3,052 high interval (Pro) →
- Mortgage (P&I)
- −$2,092
- Tax from tax record
- −$318 /mo · $3,821/yr
- Insurance
- −$166
- HOA
- −$0
- Vacancy / Maint / Mgmt
- −$641
- Net cashflow
- $-166
Break-even live
Sensitivity live
| Price | -10% $60 | -5% $-53 | +0% $-166 | +5% $-279 | +10% $-392 |
|---|---|---|---|---|---|
| Rent | -10% $-407 | -5% $-286 | +0% $-166 | +5% $-45 | +10% $75 |
| Rate | -1.0pp $35 | -0.5pp $-64 | base $-166 | +0.5pp $-269 | +1.0pp $-374 |
UW: 25.0% down · 7.5% · 30yr · 1.5% tax · 5.0% vac · 8.0% maint · 8.0% mgmt
Financing live
Cash to close
- Down payment
- $99,750
- Closing costs
- $11,970
- Reserves months
- —
- Total cash needed
- —
Loan-product check · same deal, 3 products live
Conventional
25% down · 7.5% · 30yr
- Down + closing
- —
- Monthly P&I
- —
- Monthly cashflow
- —
- DSCR
- —
- Eligible?
- —
Personal DTI + credit; lowest rate.
DSCR
20% down · 8.5% · 30yr
- Down + closing
- —
- Monthly P&I
- —
- Monthly cashflow
- —
- DSCR
- —
- Eligible?
- —
No personal income docs; deal must DSCR.
Hard money
10% down · 12.0% · 12mo
- Down + closing
- —
- Monthly P&I
- —
- Monthly cashflow
- —
- DSCR
- —
- Eligible?
- —
Short-term bridge; refi at stabilization.
Rent comps 16 comps
| Address | Beds | Baths | Sqft | Rent | $/sqft | DOM | Units | Dist |
|---|---|---|---|---|---|---|---|---|
| 3705 Pendleton Ave Virginia Beach, VA | 3.0 | 2.5 | 2003 | $3,000 | $1.50 | 18d | 1 | 0.20mi |
| 3705 Pendleton Ave Virginia Beach, VA | 3.0 | 2.5 | 2003 | $3,000 | $1.50 | 23d | 1 | 0.20mi |
| 3743 Surry Rd Virginia Beach, VA | 3.0 | 2.5 | 2000 | $3,995 | $2.00 | 25d | 1 | 0.27mi |
| 3911 Shady Oaks Dr Virginia Beach, VA | 3.0 | 3.5 | 2000 | $3,500 | $1.75 | 25d | 1 | 0.34mi |
| 3558 Shore Dr #1201 Virginia Beach, VA | 3.0 | 2.0 | 1485 | $3,100 | $2.09 | 25d | 1 | 0.40mi |
| 3848 Surry Rd Virginia Beach, VA | 3.0 | 3.5 | 2038 | $3,400 | $1.67 | 9d | 1 | 0.44mi |
| 3912 Whooping Crane Cir Virginia Beach, VA | 3.0 | 3.5 | 1850 | $3,100 | $1.68 | 12d | 1 | 0.71mi |
| 3920 Whooping Crane Cir Virginia Beach, VA | 3.0 | 3.5 | 1781 | $2,700 | $1.52 | 25d | 1 | 0.74mi |
| 2305 Estuary Ct Virginia Beach, VA | 2.0 | 2.0 | 1081 | $2,150 | $1.99 | 25d | 1 | 1.00mi |
| 2226 Kleen St Virginia Beach, VA | 2.0 | 2.0 | 1096 | $2,100 | $1.92 | 25d | 1 | 1.27mi |
| 2304 Beach Haven Dr #101 Virginia Beach, VA | 2.0 | 2.0 | 1212 | $2,395 | $1.98 | 13d | 1 | 1.32mi |
| 4524 Delco Rd Virginia Beach, VA | 3.0 | 2.0 | 1400 | $2,600 | $1.86 | 25d | 1 | 1.39mi |
| 2312 Paragon Ct Virginia Beach, VA | 3.0 | 2.5 | 1900 | $3,100 | $1.63 | 25d | 1 | 1.44mi |
| 2322 Starfish Rd Virginia Beach, VA | 2.0 | 2.5 | 1288 | $2,500 | $1.94 | 9d | 1 | 1.47mi |
| 2305 Greenwell Rd Virginia Beach, VA | 3.0 | 2.5 | 1461 | $2,645 | $1.81 | 25d | 1 | 1.48mi |
| 2326 Starfish Rd Virginia Beach, VA | 2.0 | 2.5 | 1288 | $2,395 | $1.86 | 25d | 1 | 1.48mi |
Listing history 14 events
-
2026-04-27status Under Contract
-
2026-04-16historical Active Under Contract
-
2026-04-10$399,000 Active
-
2016-04-12soldstatus $269,000
-
2016-03-30status Under Contract
-
2016-03-12$278,000 Active
-
2016-03-12historical
-
2016-01-20price $274,900
-
2016-01-10$275,000 Active
-
2015-12-31historical
-
2015-12-24price $279,000
-
2015-12-24price $275,000
-
2015-11-17$279,900 Active
-
1979-02-27soldstatus $49,015
ⓘ Source: listings_history table (triggers on properties + properties_extension) + one-shot
backfill from property_details.listing_events for pre-trigger history.
Tax reassessment forecast VA · Resets to sale price
- Current annual tax
- $3,821 · $318/mo
- Projected year-2 tax
- $3,821 · $318/mo
- Expected delta
- $0/yr ($0/mo · 0.0%)
ⓘ Screening estimate from a state-policy table — verify with the county assessor before closing.
Climate risk First Street
- Flood 4/10 Moderate FEMA zone X (unshaded) · 13% chance over 30 yrs
- Wildfire 1/10 Low
- Heat 9/10 Extreme 7 d/yr ≥102°F today · 18 d/yr by 30 yrs out
- Wind 8/10 Severe 99% chance of damaging wind over 30 yrs
- Air quality 2/10 Low 1 unhealthy d/yr today · 2 by 30 yrs out
Nearby sold comps map
Loading sold comps map…
Walkable amenities ~0.75 mi
Loading nearby amenities…
Taxation est. · year 1
- Rental income
- $36,626
- − Mortgage interest
- −$22,350
- − Property taxes
- −$3,821
- − Insurance
- −$1,995
- − Repairs & maintenance
- −$2,930
- − Management
- −$2,930
- − Depreciation
- −$11,607
- Taxable loss
- −$9,008
- Est. tax savings @ 24.0%
- +$2,162
- After-tax cash flow
- $171/yr
For passive investors: Depreciation is non-cash, so a rental often shows a tax loss while cash-flowing — sheltering income. Rental losses are passive: they offset passive income freely, and up to $25,000/yr can offset ordinary (W-2) income if you actively participate and your MAGI is under $100k (phasing out to $0 by $150k); unused losses carry forward. On sale, claimed depreciation is recaptured at up to 25%, and gains may owe capital-gains tax (a 1031 exchange can defer both). Figures are a year-1 estimate at your 24.0% rate — not tax advice; consult a CPA.
Schools (NCES district)
- District
- Va Beach City Public School District
- NCES district ID
- 5103840
- Math proficiency
- 69% ▼ -19.00%
- Reading proficiency
- 78% ▼ -7.00%
- Median HH income
- $66,452
- Composite
- 63.81/100
- National rank
- #594
- State rank
- #10 of 131 in VA
Livability — Virginia Beach
- Score
- 83/100
- State rank
- #38
- US rank
- #880
Category grades
Schools grade is shown separately in the Schools card above.
Census & demographics
- Census place
- Virginia Beach, VA
- County
- Virginia Beach City · 448,227 people
- City population
- 448,227
- Metro
- Virginia Beach-Norfolk-Newport News, VA-NC
- Population (ZIP)
- 49,977
- Household income
- $94,069
- Rent vs Own
- Severe rent burden
- 1820.0
Population outlook (Virginia Beach County) Hauer SSP2
- Today (2025)
- 480,401 people
- By 2030
- 491,221 · +2.3%
- By 2040
- 504,882 · +5.1%
- By 2050
- 508,847 · +5.9%
- By 2075
- 504,831 · +5.1%
- By 2100
- 465,867 · -3.0%
Race, ethnicity, and origin ACS 2023
- Neighborhood character
- Predominantly White (69%)
- Race & ethnicity
- White 69% Black 14% Two or more races 7% Hispanic / Latino 7% Asian 5%
- Hispanic origin (detail)
- Mexican 2% Puerto Rican 1%
- Common ancestry
- Romanian 3% Slovak 3% Lithuanian 2%
- Foreign-born
- 8% · Canada, China, Vietnam
- Languages at home
- 90% English-only · Spanish 3% Tagalog/Filipino 2% Other Indo-European 1%
Political lean MEDSL · Virginia Beach
- 2024 margin
- Toss-up / Even · D 50.7% · R 48.0% · Other 1.3%
- 2008→2024 swing
- +3.4pp toward D · 2008: -0.7pp · 2024: 2.6pp
- All cycles
- 2024: D+2.6 2020: D+5.4 2016: R+4.5 2012: R+2.5 2008: R+0.7
Not yet ingested
- Civics
- —
Market trends
- HPI YoY
- ▼ -347.34%
- Current HPI
- 296.3753
- Rent YoY
- ▲ 5.93%
- Metro
- Virginia Beach-Norfolk-Newport News, VA-NC
- State GDP YoY
- ▲ 2.40%
- F500 in state
- 50
Industry mix (Fortune 500 HQ in VA)
| Industry | F500 HQs | Revenue |
|---|---|---|
| Aerospace / Defense | 4 | $236B |
|
||
| Technology / Defense | 3 | $32B |
|
||
| Financial Services | 2 | $176B |
|
||
| Utilities | 2 | $27B |
|
||
| Insurance | 2 | $25B |
|
||
| Technology | 2 | $15B |
|
||
Price history
+714.0% since first listed14 events — show timeline
- 2026-04-27 Pending — REINMLS
- 2026-04-16 Contingent — REINMLS
- 2026-04-10 Listed $399,000 REINMLS
- 2016-04-12 Sold (Public Records) $269,000 Public Records
- 2016-03-30 Pending — REINMLS
- 2016-03-12 Listed $278,000 REINMLS
- 2016-03-12 Listing Removed — REINMLS
- 2016-01-20 Price Changed $274,900 REINMLS
- 2016-01-10 Listed $275,000 REINMLS
- 2015-12-31 Listing Removed — REINMLS
- 2015-12-24 Price Changed $275,000 REINMLS
- 2015-12-24 Price Changed $279,000 REINMLS
- 2015-11-17 Listed $279,900 REINMLS
- 1979-02-27 Sold (Public Records) $49,015 Public Records
Property tax history
+4.8%/yrLatest (2025): $3,821 · +6.6% YoY. Source: county tax records.
Cash-flow waterfall
monthlySold comps — $/sqft
last 12 mo · ≤1 miLoading sold comps…