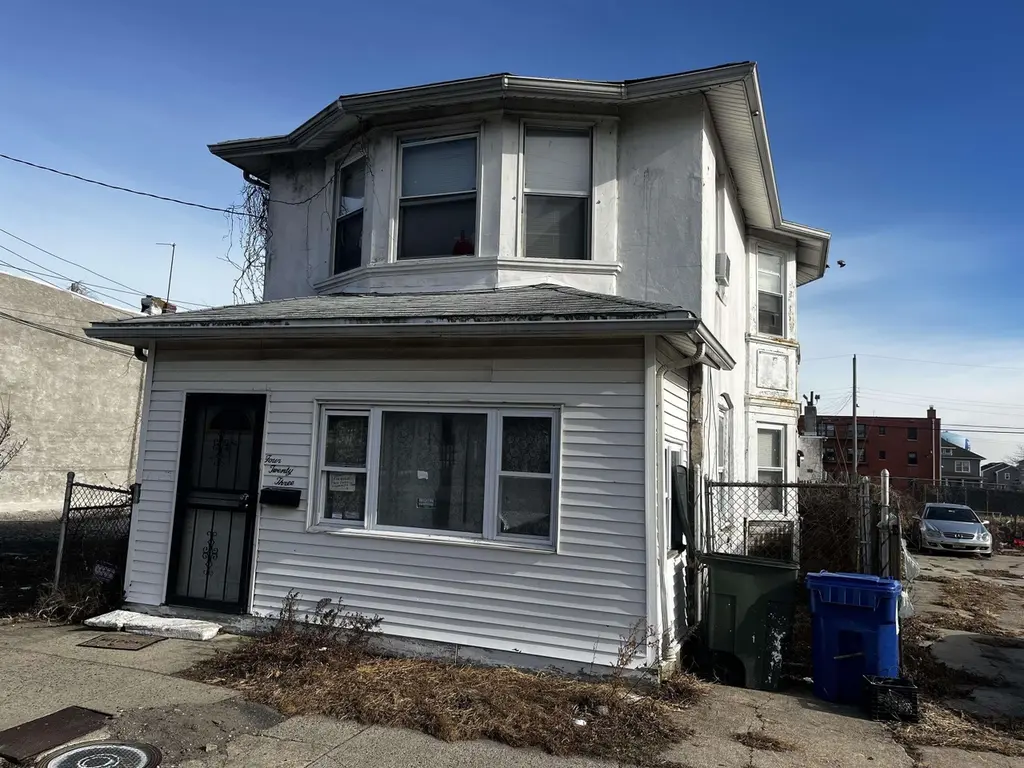
423 N Tennessee Ave · Atlantic City, NJ
Flood risk 9/10 · Severe
- FEMA flood zone
- AE
- Chance of flooding over 30 yrs
- 0.99%
- Est. flood insurance / yr
- $1,737 – $8,500
Fire risk 2/10 · Minimal
- Est. fire insurance / yr
- $526 – $976
Heat risk 9/10 · Severe
- Hot days now (above 94°F)
- 7 days/yr
- Hot days in 30 yrs
- 17 days/yr
Wind risk 8/10 · Major
- Chance of severe wind over 30 yrs
- 80.0%
Air-quality risk 3/10 · Minor
- Unhealthy air days now
- 2 days/yr
- Unhealthy air days in 30 yrs
- 3 days/yr
Risk factors via First Street. Map © Google.
Why this score? — see what drove the D+ grade
The composite is a weighted blend of 9 inputs, each scored 0–100. Each bar is that input's sub-score; the figure is the points it added to the 100-point composite (weight × sub-score).
- Cash flow +17.9/30.0
- 1% rule +7.6/10.0
- ARV discount +7.5/15.0
- DSCR +5.6/10.0
- Rent growth +3.9/5.0
- Livability +2.8/5.0
- Condition / age +2.5/5.0
- Schools +1.4/10.0
- Appreciation +0.0/10.0
$162,900
🖨 Deal sheet 📄 Offer letter ✓ Due diligence
Listing remarks MLS
Large multifamily in Atlantic City featuring 3 kitchens, 8 bedrooms and 3 bathrooms. Located close to casinos, boardwalk and beaches. This property offers huge potential for rental income, Incredible opportunity in the boardwalk empire! Come check this one out!
Key facts
- Listed 133 days
Neighborhood map
What this means for you Summary
Snapshot
- This is a ?-bed/3.0-bath single-family listed at $163k.
Deal economics
- At list price, monthly cash flow is $-288 ($-3k/yr) — negative.
- To cash-flow at today's rent, offer at most $135k (16.9% below list).
- Meets the 1% rule at list price ($2k rent vs $163k).
- Recommended offer: $135k (16.9% below list) — sets the bar for cash-flow.
- Cap rate 7.3% vs local median 3.7% in Atlantic City — top-decile yield for the area; either an underpriced asset or a hidden risk that comps aren't pricing in. Stress-test before assuming the spread holds.
Location & tenants
- Location reads 55/100 on livability (#525 in NJ) — a working-class tenant base; expect higher turnover. Strengths: health & safety A; Watch: commute D, schools F, crime F.
- Atlantic City School District (urban): math 9% / reading 26% proficiency, ranked #454 of 472 in NJ (top 96%) — low school quality limits family demand, transient renter base, plan for 1-2y turnover; 85% free/reduced lunch — lower-income household profile, screen leases tightly.
- Market conditions: Rents rising fast (+5.5%/yr); 482 active listings in the ZIP; 2 comparable units currently listed for rent nearby; lower-income renter base — watch delinquency; 672 units permitted in Atlantic County in 2024 (258 in 5+ unit buildings).
- At $2,056/mo this rent would consume 60% of the median local household income ($41k/yr) (locally 3414% of renters already pay >50% of income on rent) — very limited rent-growth headroom before tenants either downsize or default.
Forward outlook
- Local home prices are declining (-3.0%/yr); year-one equity from $1k of loan paydown is wiped out by about $5k of value loss. Plan a longer hold.
- Atlantic County population projected at -12% by 2050 — secular population decline; favor cash flow + early exit over multi-decade hold.
Negotiation context
- It's been on market 134 days — a 12% lower offer ($143k) is reasonable based on typical stale-listing flexibility.
- 3 sale attempts since 2y ago; this cycle's ask has dropped $18k (10%) from the opening price — seller is motivated, your offer sets the floor, not the list.
Risks & watch-outs
- Watch-outs: property tax is 4.2% of price; flood insurance adds $427/mo; built in 1920 — expect roof / HVAC / electrical / plumbing capex.
- Climate carrying-cost: in FEMA flood zone AE (mandatory federal flood insurance); severe wind risk, 80% chance of damaging wind over 30y; extreme-heat days projected 7→17/yr by 2055 (HVAC capex compounding) — expect insurance premiums to compound above CPI over the hold.
Questions for the listing agent
- What do current leases actually rent for vs. the listed asking? Can we see a recent rent roll and the last 12 months of T-12 income?
- It's been on market 134 days. Have you received any prior offers? Is the seller open to a 17% concession, seller financing, or rate buy-down credit?
- Built in 1920 — when were the roof, HVAC, electrical panel, plumbing, and water heater last replaced?
- Property tax is high relative to price — has the assessment been appealed recently, and will the sale trigger a re-assessment?
- What's the actual annual flood-insurance premium (NFIP or private), and is the property in a SFHA with mandatory coverage?
- Why hasn't it sold? Are there any deal-killer items the seller is aware of (foundation, flood, title, zoning, code violations)?
- Is there a deadline driving the sale (1031 exchange, divorce, estate, relocation)? That informs how much negotiation room exists.
- Schools are F-rated, which usually means shorter tenancies and higher turnover. Who's the typical renter profile here, and what's been the actual vacancy rate?
- Crime grade is F in this area — have there been break-ins, vandalism, or insurance claims at this property in the last 3 years? What carrier currently insures it and at what premium?
- The area grade is low — what's the realistic commute time and amenity access for the typical tenant pool here? Any planned neighborhood developments (good or bad) we should know about?
- What's the average days-on-market for RENTAL listings here right now (not sales)? A rising rental-DOM trend means longer vacancies and softer asking-rent achievability than the comps imply.
- What's the recent tenant-quality profile in this submarket — average credit score on applications, eviction rate, late-payment / NSF rate, and stable-employment percentage? A property-management company in the area should have these aggregated.
- How much new for-sale + rental construction is in the pipeline within 1–3 miles? Heavy new supply typically softens prices + rents 12–24 months out; constrained supply supports both.
Investment metrics
- 1% rule
- 1.26% ✓
- Cap rate
- 7.31%
- Cash-on-cash
- 3.63%
- DSCR
- 1.16
- GRM
- 6.6
CMA / ARV
- ARV (on-the-fly)
- $724,136
- Comps found
- 4
Show comp detail 4 sales within ~0.75 mi
| Address | Dist | Beds/Ba | Sqft | Sold | Price | $/sf | Match |
|---|---|---|---|---|---|---|---|
| 312 N Massachusetts Ave | 0.66mi | 4/3.0 | 2,500 (-8%) | 3mo | $325,000 | $130 | 54 |
| 541 N New Jersey Ave | 0.55mi | 5/4.0 | 2,560 (-5%) | 15mo | $685,000 | $268 | 49 |
| 1201 N Ohio Ave | 0.60mi | 4/2.5 | 2,475 (-8%) | 13mo | $399,900 | $162 | 45 |
| 739 N Massachusetts Ave | 0.67mi | 4/3.5 | 2,500 (-8%) | 23mo | $850,000 | $340 | 35 |
Match score weights: distance 35% · size 25% · config 20% · recency 20%. Top-matched comps best support the ARV.
Projected returns pro-forma
-3.0% appreciation · 5.52% rent growth · sell at horizon
- IRR
- -24.0%
- Equity multiple
- 0.15×
- Total profit
- $-38,905
- Equity at exit
- $24,289
- IRR
- -9.6%
- Equity multiple
- 0.29×
- Total profit
- $-32,346
- Equity at exit
- $14,085
Cash invested: $45,612 (down + closing). Projections, not guarantees.
Landlord ↔ Tenant lean methodology
- Overall (STATE)
- 21 Tenant-Leaning
- State New Jersey
- 21 Tenant-Leaning · D+6
- County
- — inherits STATE
- City
- — inherits STATE
ZIP-level market 08401
- Home prices YoY
- -7.0%
- Rents YoY
- 5.5%
- Active inventory
- 482
- Price-to-rent
- 6.6×
Monthly cashflow live
- Estimated rent
- $2,056 medium interval (Pro) →
- Mortgage (P&I)
- −$854
- Tax from tax record
- −$564 /mo · $6,767/yr
- Insurance
- −$68
- Flood insurance flood zone
- −$427 /mo · $5,118/yr
- HOA
- −$0
- Vacancy / Maint / Mgmt
- −$432
- Net cashflow
- $-288
Break-even live
UW: 25.0% down · 7.5% · 30yr · 1.5% tax · 5.0% vac · 8.0% maint · 8.0% mgmt
Financing live
Cash to close
- Down payment
- $40,725
- Closing costs
- $4,887
- Reserves months
- —
- Total cash needed
- —
Loan-product check · same deal, 3 products live
Conventional
25% down · 7.5% · 30yr
- Down + closing
- —
- Monthly P&I
- —
- Monthly cashflow
- —
- DSCR
- —
- Eligible?
- —
Personal DTI + credit; lowest rate.
DSCR
20% down · 8.5% · 30yr
- Down + closing
- —
- Monthly P&I
- —
- Monthly cashflow
- —
- DSCR
- —
- Eligible?
- —
No personal income docs; deal must DSCR.
Hard money
10% down · 12.0% · 12mo
- Down + closing
- —
- Monthly P&I
- —
- Monthly cashflow
- —
- DSCR
- —
- Eligible?
- —
Short-term bridge; refi at stabilization.
Rent comps 2 comps
| Address | Beds | Baths | Sqft | Rent | $/sqft | DOM | Units | Dist |
|---|---|---|---|---|---|---|---|---|
| 326 N Tennessee Ave Unit 2 Atlantic City, NJ | 3.0 | 1.0 | 1815 | $2,200 | $1.21 | 13d | 1 | 0.06mi |
| 2402 Auburn Ter Unit B Atlantic City, NJ | 3.0 | 1.0 | 1893 | $2,000 | $1.06 | 21d | 1 | 0.87mi |
Listing history 23 events
-
2026-06-19days on market $162,900 Under Contract 134 DOM
-
2026-06-18days on market $162,900 Under Contract 133 DOM
-
2026-06-17days on market $162,900 Under Contract 132 DOM
-
2026-06-16days on market $162,900 Under Contract 131 DOM
-
2026-06-15days on market $162,900 Under Contract 130 DOM
-
2026-06-14days on market $162,900 Under Contract 128 DOM
-
2026-06-13days on market $162,900 Under Contract 127 DOM
-
2026-06-10days on market $162,900 Under Contract 125 DOM
-
2026-06-09days on market $162,900 Under Contract 124 DOM
-
2026-06-08days on market $162,900 Under Contract 123 DOM
-
2026-06-07days on market $162,900 Under Contract 122 DOM
-
2026-06-03status $162,900 Under Contract 117 DOM
-
2026-06-02days on market $162,900 Active 117 DOM
-
2026-06-01days on market $162,900 Active 116 DOM
-
2026-05-31days on market $162,900 Active 115 DOM
-
2026-05-30days on market $162,900 Active 114 DOM
-
2026-05-08price $162,900 261-char remark
Show marketing remark (261 chars)
Large multifamily in Atlantic City featuring 3 kitchens, 8 bedrooms and 3 bathrooms. Located close to casinos, boardwalk and beaches. This property offers huge potential for rental income, Incredible opportunity in the boardwalk empire! Come check this one out!
-
2026-04-08price $171,950 261-char remark
Show marketing remark (261 chars)
Large multifamily in Atlantic City featuring 3 kitchens, 8 bedrooms and 3 bathrooms. Located close to casinos, boardwalk and beaches. This property offers huge potential for rental income, Incredible opportunity in the boardwalk empire! Come check this one out!
-
2026-03-31status Active 261-char remark
Show marketing remark (261 chars)
Large multifamily in Atlantic City featuring 3 kitchens, 8 bedrooms and 3 bathrooms. Located close to casinos, boardwalk and beaches. This property offers huge potential for rental income, Incredible opportunity in the boardwalk empire! Come check this one out!
-
2026-02-26historical Under Contract 261-char remark
Show marketing remark (261 chars)
Large multifamily in Atlantic City featuring 3 kitchens, 8 bedrooms and 3 bathrooms. Located close to casinos, boardwalk and beaches. This property offers huge potential for rental income, Incredible opportunity in the boardwalk empire! Come check this one out!
-
2026-02-05$181,000 Active 261-char remark
Show marketing remark (261 chars)
Large multifamily in Atlantic City featuring 3 kitchens, 8 bedrooms and 3 bathrooms. Located close to casinos, boardwalk and beaches. This property offers huge potential for rental income, Incredible opportunity in the boardwalk empire! Come check this one out!
-
2025-07-26historical 671-char remark
Show marketing remark (671 chars)
Investor Alert!!! This multi-family property boasts 24 rooms, including 7 bedrooms, 3 full bathrooms, and 1 half bathroom, making it ideal for diverse living arrangements. Featuring 3 fully equipped kitchens and ample storage space, the property is both practical and versatile. Located on a 3,875-square-foot lot, it stretches between North Tennessee Avenue and North Ocean Avenue, offering convenient dual access. Situated less than a mile from the Atlantic Ocean, residents can enjoy the benefits of coastal living with easy beach access. This property offers incredible potential for rental income, in a spacious multi-family complex perfect for generating cash flow.
-
2024-12-23$429,000 Active 671-char remark
Show marketing remark (671 chars)
Investor Alert!!! This multi-family property boasts 24 rooms, including 7 bedrooms, 3 full bathrooms, and 1 half bathroom, making it ideal for diverse living arrangements. Featuring 3 fully equipped kitchens and ample storage space, the property is both practical and versatile. Located on a 3,875-square-foot lot, it stretches between North Tennessee Avenue and North Ocean Avenue, offering convenient dual access. Situated less than a mile from the Atlantic Ocean, residents can enjoy the benefits of coastal living with easy beach access. This property offers incredible potential for rental income, in a spacious multi-family complex perfect for generating cash flow.
ⓘ Source: listings_history table (triggers on properties + properties_extension) + one-shot
backfill from property_details.listing_events for pre-trigger history.
Tax reassessment forecast NJ · Partial reset (capped growth)
- Current annual tax
- $6,767 · $564/mo
- Projected year-2 tax
- $6,767 · $564/mo
- Expected delta
- $0/yr ($0/mo · 0.0%)
ⓘ Screening estimate from a state-policy table — verify with the county assessor before closing.
Climate risk First Street
- Flood 9/10 Extreme FEMA zone AE · 99% chance over 30 yrs
- Wildfire 2/10 Low
- Heat 9/10 Extreme 7 d/yr ≥94°F today · 17 d/yr by 30 yrs out
- Wind 8/10 Severe 80% chance of damaging wind over 30 yrs
- Air quality 3/10 Moderate 2 unhealthy d/yr today · 3 by 30 yrs out
Nearby sold comps map
Loading sold comps map…
Walkable amenities ~0.75 mi
Loading nearby amenities…
Taxation est. · year 1
- Rental income
- $24,671
- − Mortgage interest
- −$9,125
- − Property taxes
- −$6,767
- − Insurance
- −$5,933
- − Repairs & maintenance
- −$1,974
- − Management
- −$1,974
- − Depreciation
- −$4,739
- Taxable loss
- −$5,840
- Est. tax savings @ 24.0%
- +$1,402
- After-tax cash flow
- $-2,059/yr
For passive investors: Depreciation is non-cash, so a rental often shows a tax loss while cash-flowing — sheltering income. Rental losses are passive: they offset passive income freely, and up to $25,000/yr can offset ordinary (W-2) income if you actively participate and your MAGI is under $100k (phasing out to $0 by $150k); unused losses carry forward. On sale, claimed depreciation is recaptured at up to 25%, and gains may owe capital-gains tax (a 1031 exchange can defer both). Figures are a year-1 estimate at your 24.0% rate — not tax advice; consult a CPA.
Schools (NCES district)
- District
- Atlantic City School District
- NCES district ID
- 3400960
- Math proficiency
- 9% ▼ -12.00%
- Reading proficiency
- 26% ▼ -6.00%
- Median HH income
- $27,842
- Composite
- 13.66/100
- National rank
- #9504
- State rank
- #454 of 472 in NJ
Livability — Atlantic City
- Score
- 55/100
- State rank
- #525
- US rank
- #23095
Category grades
Schools grade is shown separately in the Schools card above.
Census & demographics
- Census place
- Atlantic City, NJ
- County
- Atlantic County · 143,611 people
- City population
- 38,925
- Metro
- Atlantic City-Hammonton, NJ
- Population (ZIP)
- 38,925
- Household income
- $41,126
- Rent vs Own
- Severe rent burden
- 3414.0
Population outlook (Atlantic County) Hauer SSP2
- Today (2025)
- 268,948 people
- By 2030
- 264,497 · -1.7%
- By 2040
- 252,261 · -6.2%
- By 2050
- 237,846 · -11.6%
- By 2075
- 210,650 · -21.7%
- By 2100
- 180,234 · -33.0%
Race, ethnicity, and origin ACS 2023
- Neighborhood character
- Highly diverse neighborhood (Simpson 0.75)
- Race & ethnicity
- Hispanic / Latino 32% Black 32% Asian 16% White 16% Two or more races 11% Native American 2%
- Hispanic origin (detail)
- Mexican 10% Puerto Rican 8% Dominican 8%
- Common ancestry
- Romanian 1% Scotch-Irish 1%
- Foreign-born
- 29% · Canada, Vietnam, Jamaica
- Languages at home
- 52% English-only · Spanish 30% Other Indo-European 8% Vietnamese 3%
Political lean MEDSL · Atlantic
- 2024 margin
- Toss-up / Even · D 47.7% · R 50.7% · Other 1.6%
- 2008→2024 swing
- -18.1pp toward R · 2008: 15.1pp · 2024: -3.0pp
- All cycles
- 2024: R+3.0 2020: D+6.7 2016: D+6.2 2012: D+17.2 2008: D+15.1
Not yet ingested
- Civics
- —
Market trends
- HPI YoY
- ▼ -26.82%
- Current HPI
- 353.7827
- Rent YoY
- ▲ 5.52%
- Metro
- Atlantic City-Hammonton, NJ
- State GDP YoY
- ▲ 2.05%
- F500 in state
- 34
Industry mix (Fortune 500 HQ in NJ)
| Industry | F500 HQs | Revenue |
|---|---|---|
| Consumer Goods | 3 | $31B |
|
||
| Pharmaceuticals | 2 | $153B |
|
||
| Technology | 2 | $21B |
|
||
| Insurance | 2 | $20B |
|
||
| Healthcare | 2 | $19B |
|
||
| Financial Services | 1 | $70B |
|
||
Price history
-62.0% since first listed7 events — show timeline
- 2026-05-08 Price Changed $162,900 SJSRMLS
- 2026-04-08 Price Changed $171,950 SJSRMLS
- 2026-03-31 Relisted — SJSRMLS
- 2026-02-26 Contingent — SJSRMLS
- 2026-02-05 Listed $181,000 SJSRMLS
- 2025-07-26 Listing Removed — SJSRMLS
- 2024-12-23 Listed $429,000 SJSRMLS
Property tax history
-3.3%/yrLatest (2025): $6,767 · -2.1% YoY. Source: county tax records.
Cash-flow waterfall
monthlySold comps — $/sqft
last 12 mo · ≤1 miLoading sold comps…