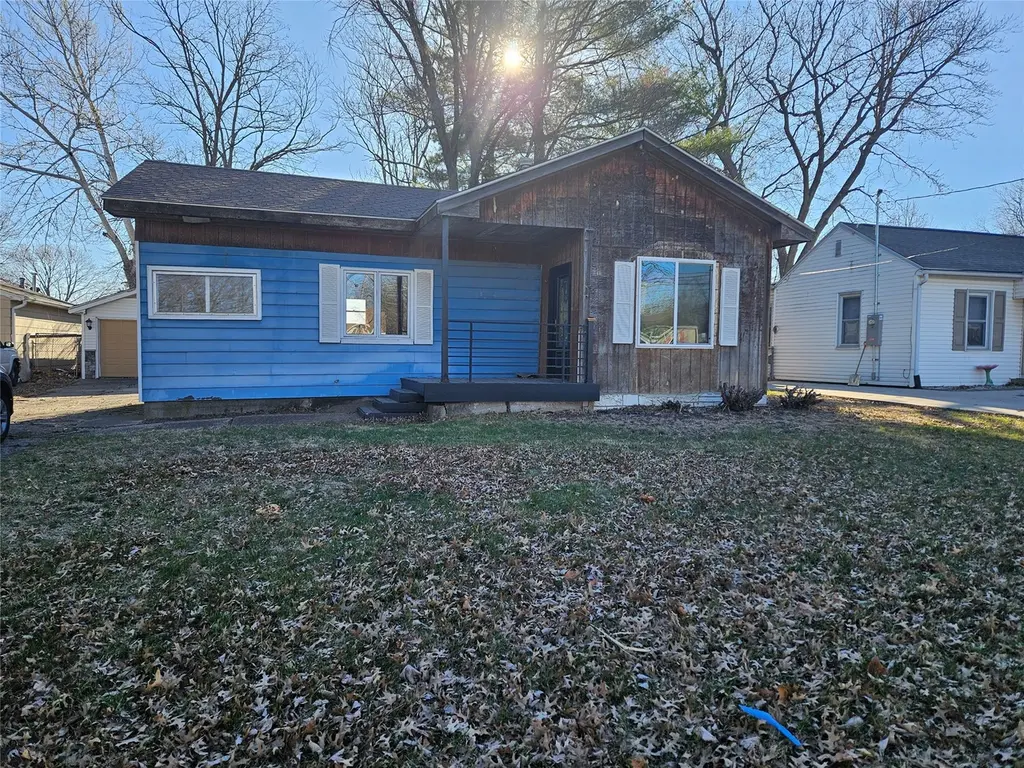
3921 52nd St · Des Moines, IA
Flood risk 1/10 · Minimal
- FEMA flood zone
- X (unshaded)
- Chance of flooding over 30 yrs
- 0.0%
- Est. flood insurance / yr
- $507 – $1,088
Fire risk 1/10 · Minimal
- Est. fire insurance / yr
- $902 – $1,676
Heat risk 3/10 · Minor
- Hot days now (above 103°F)
- 7 days/yr
- Hot days in 30 yrs
- 15 days/yr
Wind risk 2/10 · Minimal
- Chance of severe wind over 30 yrs
- —
Air-quality risk 2/10 · Minimal
- Unhealthy air days now
- 1 days/yr
- Unhealthy air days in 30 yrs
- 1 days/yr
Risk factors via First Street. Map © Google.
Why this score? — see what drove the C+ grade
The composite is a weighted blend of 9 inputs, each scored 0–100. Each bar is that input's sub-score; the figure is the points it added to the 100-point composite (weight × sub-score).
- Cash flow +26.4/30.0
- DSCR +9.0/10.0
- ARV discount +7.5/15.0
- 1% rule +7.3/10.0
- Livability +4.0/5.0
- Schools +3.8/10.0
- Rent growth +3.4/5.0
- Condition / age +2.5/5.0
- Appreciation +0.0/10.0
$80,000
🖨 Deal sheet 📄 Offer letter ✓ Due diligence
Listing remarks MLS
Great investment opportunity! Nice size ranch located in great neighborhood that's close to schools, interstate, and shopping. It features 1 bed (previously used as 2 bed), 1 bathroom, open floor plan and oversized 2 car garage. Great buy!
Key facts
- 8,400 sq ft lot
- 2 garage spots
- Built 1950
Tags
Property features AI
Finance
- Financial info: Annual property taxes listed (refer to listing for amount)
Exterior
- Parking: Detached two-car garage
- Utilities: Public water; Public sewer
- Home design: Single-family property
- Construction: Vinyl and wood siding; Asphalt shingle roof; Block and slab foundation; Built with typical residential construction materials
- Exterior features: Chain link and wood fencing; Rectangular lot measuring approximately 60 x 140
Interior
- Bedrooms: Two main-level bedrooms
- Bathrooms: One full bathroom
- Heating & cooling: Central air conditioning; Forced air heating (natural gas)
- Interior features: See remarks for additional interior details
Neighborhood map
What this means for you Summary
Snapshot
- This is a 1-bed/1.0-bath single-family listed at $80k.
Deal economics
- At list price, monthly cash flow is $208 ($2k/yr) — positive.
- The deal already cash-flows at list — no discount required.
- Meets the 1% rule at list price ($980 rent vs $80k).
- Cap rate 9.4% vs local median 3.1% in Des Moines — top-decile yield for the area; either an underpriced asset or a hidden risk that comps aren't pricing in. Stress-test before assuming the spread holds.
Location & tenants
- Location reads 81/100 on livability (#63 in IA, #1,432 nationally) — a professional / high-income tenant draw. Strengths: commute A+, cost of living A+, housing A+; Watch: employment C-, schools D+, crime F.
- Des Moines Independent Community School District (urban): math 43% / reading 46% proficiency, ranked #289 of 289 in IA (top 100%) — families likely to look elsewhere, expect single-tenant / working-renter base with shorter leases; 63% free/reduced lunch — lower-income household profile, screen leases tightly.
- Market conditions: Rents rising (+3.7%/yr); 256 active listings in the ZIP; 16 comparable units currently listed for rent nearby; rentals at typical pace (median 21d on market — plan ~3-4 weeks tenant-placement turnaround); solid renter incomes; 2,953 units permitted in Polk County in 2024 (540 in 5+ unit buildings).
- This rent is only 15% of the median local income ($76k/yr) — well below the 30% rent-burden line; pricing power to push rent on renewal without tenant pushback.
Forward outlook
- Local home prices are declining (-3.0%/yr); year-one equity from $553 of loan paydown is wiped out by about $2k of value loss. Plan a longer hold.
- Polk County population projected at +37% by 2050 — long-run rental-demand tailwind backs the buy-and-hold thesis.
- At projected returns (-3.0% appreciation + 3.7% rent growth), your $22k cash investment doubles in ~10 years — after that, you're playing with house money.
Negotiation context
- Only 11 days on market — expect competitive offers; lowballing is unlikely to land.
- 2 sale attempts since 13y ago with the ask held roughly flat each time — persistent listings suggest the price (not the market) is what's stuck; bring a comps-based counter.
- Current owner paid $63k; 27% above their basis — modest negotiation headroom, anchor on the comps not their cost.
Risks & watch-outs
- Watch-outs: built in 1950 — expect roof / HVAC / electrical / plumbing capex.
Questions for the listing agent
- Built in 1950 — when were the roof, HVAC, electrical panel, plumbing, and water heater last replaced?
- Is there a deadline driving the sale (1031 exchange, divorce, estate, relocation)? That informs how much negotiation room exists.
- Schools are D-rated, which usually means shorter tenancies and higher turnover. Who's the typical renter profile here, and what's been the actual vacancy rate?
- Crime grade is F in this area — have there been break-ins, vandalism, or insurance claims at this property in the last 3 years? What carrier currently insures it and at what premium?
- What's the average days-on-market for RENTAL listings here right now (not sales)? A rising rental-DOM trend means longer vacancies and softer asking-rent achievability than the comps imply.
- What's the recent tenant-quality profile in this submarket — average credit score on applications, eviction rate, late-payment / NSF rate, and stable-employment percentage? A property-management company in the area should have these aggregated.
- How much new for-sale + rental construction is in the pipeline within 1–3 miles? Heavy new supply typically softens prices + rents 12–24 months out; constrained supply supports both.
Investment metrics
- 1% rule
- 1.23% ✓
- Cap rate
- 9.41%
- Cash-on-cash
- 11.14%
- DSCR
- 1.50
- GRM
- 6.8
CMA / ARV
- ARV (median comp)
- $176,006
- List price
- $80,000
- Delta
- -54.55%
- Verdict
- UNDERPRICED
- Comps
- 20 within 1.0 mi
Show comp detail 12 sales within ~0.75 mi
| Address | Dist | Beds/Ba | Sqft | Sold | Price | $/sf | Match |
|---|---|---|---|---|---|---|---|
| 3921 52nd St | 0.00mi | 2/1.0 (+1) | 714 (0%) | 0mo | $63,000 | $88 | 95 |
| 3940 51st St | 0.07mi | 2/1.0 (+1) | 660 (-8%) | 6mo | $175,000 | $265 | 74 |
| 3906 53rd St | 0.10mi | 2/1.0 (+1) | 793 (+11%) | 2mo | $175,000 | $221 | 71 |
| 3608 53rd St | 0.28mi | 1/1.0 | 676 (-5%) | 9mo | $190,000 | $281 | 71 |
| 3944 53rd St | 0.10mi | 2/1.0 (+1) | 768 (+8%) | 9mo | $160,000 | $208 | 70 |
| 3907 50th St | 0.13mi | 2/1.0 (+1) | 780 (+9%) | 10mo | $165,000 | $212 | 65 |
| 4141 57th St | 0.43mi | 2/1.0 (+1) | 672 (-6%) | 1mo | $125,300 | $186 | 64 |
| 3946 57th St | 0.35mi | 2/2.0 (+1) | 672 (-6%) | 2mo | $189,900 | $283 | 63 |
| 3417 59th St | 0.59mi | 2/1.0 (+1) | 720 (+1%) | 6mo | $178,500 | $248 | 61 |
| 4135 56th St | 0.38mi | 2/1.0 (+1) | 799 (+12%) | 9mo | $185,000 | $232 | 50 |
| 5200 Twana Dr | 0.49mi | 2/1.5 (+1) | 776 (+9%) | 9mo | $180,000 | $232 | 48 |
| 3608 59th St | 0.57mi | 2/1.0 (+1) | 612 (-14%) | 1mo | $175,500 | $287 | 44 |
Match score weights: distance 35% · size 25% · config 20% · recency 20%. Top-matched comps best support the ARV.
Projected returns pro-forma
-3.0% appreciation · 3.74% rent growth · sell at horizon
- IRR
- 1.2%
- Equity multiple
- 1.05×
- Total profit
- $1,036
- Equity at exit
- $11,928
- IRR
- 11.6%
- Equity multiple
- 1.94×
- Total profit
- $21,108
- Equity at exit
- $6,917
Cash invested: $22,400 (down + closing). Projections, not guarantees.
Landlord ↔ Tenant lean methodology
- Overall (STATE)
- 83 Strongly Landlord-Friendly
- State Iowa
- 83 Strongly Landlord-Friendly · R+6
- County
- — inherits STATE
- City
- — inherits STATE
ZIP-level market 50310
- Rents YoY
- 3.7%
- Active inventory
- 256
- Price-to-rent
- 6.8×
Monthly cashflow live
- Estimated rent
- $980 high interval (Pro) →
- Mortgage (P&I)
- −$420
- Tax from tax record
- −$114 /mo · $1,362/yr
- Insurance
- −$33
- HOA
- −$0
- Vacancy / Maint / Mgmt
- −$206
- Net cashflow
- $208
Break-even live
UW: 25.0% down · 7.5% · 30yr · 1.5% tax · 5.0% vac · 8.0% maint · 8.0% mgmt
Financing live
Cash to close
- Down payment
- $20,000
- Closing costs
- $2,400
- Reserves months
- —
- Total cash needed
- —
Loan-product check · same deal, 3 products live
Conventional
25% down · 7.5% · 30yr
- Down + closing
- —
- Monthly P&I
- —
- Monthly cashflow
- —
- DSCR
- —
- Eligible?
- —
Personal DTI + credit; lowest rate.
DSCR
20% down · 8.5% · 30yr
- Down + closing
- —
- Monthly P&I
- —
- Monthly cashflow
- —
- DSCR
- —
- Eligible?
- —
No personal income docs; deal must DSCR.
Hard money
10% down · 12.0% · 12mo
- Down + closing
- —
- Monthly P&I
- —
- Monthly cashflow
- —
- DSCR
- —
- Eligible?
- —
Short-term bridge; refi at stabilization.
Rent comps 16 comps
| Address | Beds | Baths | Sqft | Rent | $/sqft | DOM | Units | Dist |
|---|---|---|---|---|---|---|---|---|
| 3934 54th St Des Moines, IA | 1.0 | 1.0 | 504 | $1,295 | $2.57 | 14d | 1 | 0.15mi |
| 3710 56th St Des Moines, IA | 1.0 | 1.0 | 528 | $825 | $1.56 | 21d | 2 | 0.34mi |
| 5626 Douglas Ave Des Moines, IA | 1.0 | 1.0 | 360 | $750 | $2.08 | 14d | 6 | 0.37mi |
| 3710 57th St Des Moines, IA | 1.0–2.0 | 1.0 | 787 | $750 | $0.95 | 23d | 3 | 0.41mi |
| 5612 New York Ave Des Moines, IA | 2.0 | 2.0 | 636 | $1,595 | $2.51 | 14d | 1 | 0.86mi |
| 2929 Beaver Ave Des Moines, IA | 1.0 | 1.0 | 575 | $950 | $1.65 | 44d | 1 | 1.12mi |
| 3610 Twana Dr Des Moines, IA | 2.0 | 1.0 | 650 | $850 | $1.31 | 14d | 8 | 1.26mi |
| 4326 Hickman Rd Unit 307 Des Moines, IA | 1.0 | 1.0 | 697 | $1,420 | $2.04 | 44d | 1 | 1.36mi |
| 4925 Franklin Ave Des Moines, IA | 1.0–2.0 | 1.0 | 606 | $825 | $1.36 | 14d | 4 | 1.37mi |
| 4326 Hickman Rd Unit 405 Des Moines, IA | 1.0 | 1.0 | 728 | $1,440 | $1.98 | 44d | 1 | 1.37mi |
| 6319 Hickman Rd Unit 6319-24 Des Moines, IA | 2.0 | 1.0 | 750 | $800 | $1.07 | 19d | 1 | 1.39mi |
| 6319 Hickman Rd Unit 14 Des Moines, IA | 2.0 | 1.0 | 750 | $875 | $1.17 | 44d | 1 | 1.39mi |
| 6319 Hickman Rd Des Moines, IA | 2.0 | 1.0 | 750 | $900 | $1.20 | 44d | 3 | 1.39mi |
| 6319 Hickman Rd Unit 6319-20 Des Moines, IA | 2.0 | 1.0 | 750 | $765 | $1.02 | 19d | 1 | 1.39mi |
| 6319 Hickman Rd Unit 6315-2 Des Moines, IA | 2.0 | 1.0 | 750 | $775 | $1.03 | 19d | 1 | 1.39mi |
| 5250 Franklin Ave Des Moines, IA | 1.0 | 1.0 | 640 | $850 | $1.33 | 44d | 1 | 1.45mi |
Listing history 4 events
-
2026-05-15status Pending 477-char remark
-
2026-05-04$80,000 Active 477-char remark
-
2014-02-28soldstatus $31,500 239-char remark
Show marketing remark (239 chars)
Great investment opportunity! Nice size ranch located in great neighborhood that's close to schools, interstate, and shopping. It features 1 bed (previously used as 2 bed), 1 bathroom, open floor plan and oversized 2 car garage. Great buy!
-
2013-10-04$34,900 239-char remark
Show marketing remark (239 chars)
Great investment opportunity! Nice size ranch located in great neighborhood that's close to schools, interstate, and shopping. It features 1 bed (previously used as 2 bed), 1 bathroom, open floor plan and oversized 2 car garage. Great buy!
ⓘ Source: listings_history table (triggers on properties + properties_extension) + one-shot
backfill from property_details.listing_events for pre-trigger history.
Tax reassessment forecast IA · Partial reset (capped growth)
- Current annual tax
- $1,362 · $114/mo
- Projected year-2 tax
- $1,362 · $114/mo
- Expected delta
- $0/yr ($0/mo · 0.0%)
ⓘ Screening estimate from a state-policy table — verify with the county assessor before closing.
Climate risk First Street
- Flood 1/10 Low FEMA zone X (unshaded) · 0% chance over 30 yrs
- Wildfire 1/10 Low
- Heat 3/10 Moderate 7 d/yr ≥103°F today · 15 d/yr by 30 yrs out
- Wind 2/10 Low
- Air quality 2/10 Low 1 unhealthy d/yr today · 1 by 30 yrs out
Nearby sold comps map
Loading sold comps map…
Walkable amenities ~0.75 mi
Loading nearby amenities…
Taxation est. · year 1
- Rental income
- $11,761
- − Mortgage interest
- −$4,481
- − Property taxes
- −$1,362
- − Insurance
- −$400
- − Repairs & maintenance
- −$941
- − Management
- −$941
- − Depreciation
- −$2,327
- Taxable income
- $1,309
- Est. tax owed @ 24.0%
- −$314
- After-tax cash flow
- $2,181/yr
For passive investors: Depreciation is non-cash, so a rental often shows a tax loss while cash-flowing — sheltering income. Rental losses are passive: they offset passive income freely, and up to $25,000/yr can offset ordinary (W-2) income if you actively participate and your MAGI is under $100k (phasing out to $0 by $150k); unused losses carry forward. On sale, claimed depreciation is recaptured at up to 25%, and gains may owe capital-gains tax (a 1031 exchange can defer both). Figures are a year-1 estimate at your 24.0% rate — not tax advice; consult a CPA.
Schools (NCES district)
- District
- Des Moines Independent Community School District
- NCES district ID
- 1908970
- Math proficiency
- 43% ▼ -6.00%
- Reading proficiency
- 46% ▼ -1.00%
- Median HH income
- $45,905
- Composite
- 37.83/100
- National rank
- #4331
- State rank
- #289 of 289 in IA
Livability — Des Moines
- Score
- 81/100
- State rank
- #63
- US rank
- #1432
Category grades
Schools grade is shown separately in the Schools card above.
Census & demographics
- Census place
- Des Moines, IA
- County
- Polk County · 453,298 people
- City population
- 203,612
- Metro
- Des Moines-West Des Moines, IA
- Population (ZIP)
- 31,177
- Household income
- $76,381
- Rent vs Own
- Severe rent burden
- 928.0
Population outlook (Polk County) Hauer SSP2
- Today (2025)
- 548,042 people
- By 2030
- 588,557 · +7.4%
- By 2040
- 670,629 · +22.4%
- By 2050
- 752,830 · +37.4%
- By 2075
- 955,069 · +74.3%
- By 2100
- 1,115,436 · +103.5%
Race, ethnicity, and origin ACS 2023
- Neighborhood character
- Majority White (65%)
- Race & ethnicity
- White 65% Black 14% Asian 9% Hispanic / Latino 8% Two or more races 7%
- Hispanic origin (detail)
- Mexican 6%
- Common ancestry
- Ukrainian 3% Iranian 3% Italian 2%
- Foreign-born
- 19% · Canada, Philippines, Vietnam
- Languages at home
- 77% English-only · Other Asian/Pacific 6% Spanish 6% Russian/Polish/Slavic 3%
Political lean MEDSL · Polk
- 2024 margin
- D (+10.9) · D 54.8% · R 43.9% · Other 1.3%
- 2008→2024 swing
- -3.7pp toward R · 2008: 14.6pp · 2024: 10.9pp
- All cycles
- 2024: D+10.9 2020: D+15.2 2016: D+11.5 2012: D+14.2 2008: D+14.6
Not yet ingested
- Civics
- —
Market trends
- HPI YoY
- ▼ -197.92%
- Current HPI
- 248.07
- Rent YoY
- ▲ 3.74%
- Metro
- Des Moines-West Des Moines, IA
- State GDP YoY
- ▲ 2.48%
- F500 in state
- 4
Industry mix (Fortune 500 HQ in IA)
| Industry | F500 HQs | Revenue |
|---|---|---|
| Financial Services | 1 | $16B |
|
||
| Retail / Convenience | 1 | $15B |
|
||
Price history
+80.5% since first listed5 events — show timeline
- 2026-06-10 Sold (MLS) $63,000 DMMLS
- 2026-05-15 Pending — DMMLS
- 2026-05-04 Listed $80,000 DMMLS
- 2014-02-28 Sold (MLS) $31,500 DMMLS
- 2013-10-04 Listed $34,900 DMMLS
Property tax history
-3.2%/yrLatest (2025): $1,362 · +2.1% YoY. Source: county tax records.
Cash-flow waterfall
monthlySold comps — $/sqft
last 12 mo · ≤1 miLoading sold comps…