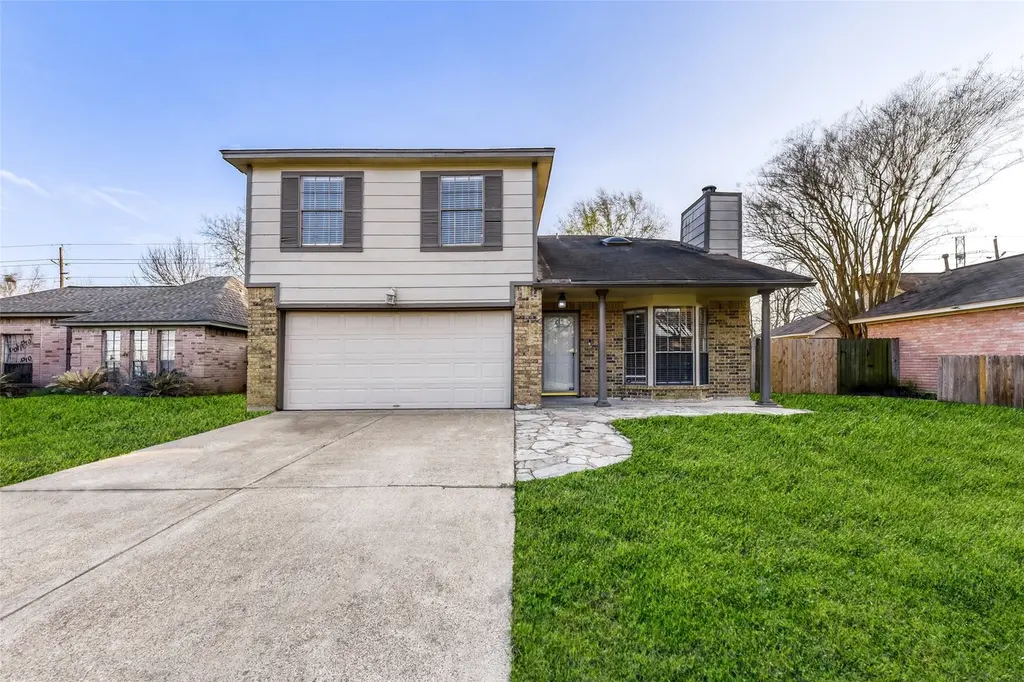
9727 Orangevale Dr · Houston, TX
Flood risk 1/10 · Minimal
- FEMA flood zone
- X (unshaded)
- Chance of flooding over 30 yrs
- 0.0%
- Est. flood insurance / yr
- $507 – $1,088
Fire risk 1/10 · Minimal
- Est. fire insurance / yr
- $1,222 – $2,270
Heat risk 9/10 · Severe
- Hot days now (above 111°F)
- 7 days/yr
- Hot days in 30 yrs
- 23 days/yr
Wind risk 9/10 · Severe
- Chance of severe wind over 30 yrs
- 99.0%
Air-quality risk 3/10 · Minor
- Unhealthy air days now
- 2 days/yr
- Unhealthy air days in 30 yrs
- 3 days/yr
Risk factors via First Street. Map © Google.
Why this score? — see what drove the D grade
The composite is a weighted blend of 9 inputs, each scored 0–100. Each bar is that input's sub-score; the figure is the points it added to the 100-point composite (weight × sub-score).
- Cash flow +11.1/30.0
- ARV discount +10.3/15.0
- Schools +4.1/10.0
- 1% rule +3.8/10.0
- Livability +3.7/5.0
- DSCR +3.2/10.0
- Condition / age +2.5/5.0
- Rent growth +2.0/5.0
- Appreciation +0.0/10.0
$245,000
🖨 Deal sheet 📄 Offer letter ✓ Due diligence
Listing remarks MLS
Welcome to this beautifully maintained 4-bedroom, 2.5-bath home featuring soaring vaulted ceilings in the living room and an abundance of natural light throughout. The spacious living area is centered around a cozy fireplace, creating the perfect setting for relaxing or entertaining. The open layout flows seamlessly into the dining and kitchen areas, offering both comfort and functionality. Step outside to a large backyard with plenty of space for gatherings, pets, or future outdoor additions. A wonderful opportunity to own a home that combines space, warmth, and natural light.
Key facts
- 6,821 sq ft lot
- 2 garage spots
- Community pool
Neighborhood map
What this means for you Summary
Snapshot
- This is a 4-bed/2.5-bath single-family listed at $245k.
Deal economics
- At list price, monthly cash flow is $-97 ($-1k/yr) — negative.
- To cash-flow at today's rent, offer at most $228k (7.0% below list).
- To meet the 1% rule (rent ≥ 1% of price), the offer needs to be $216k (11.8% below list).
- Recommended offer: $216k (11.8% below list) — sets the bar for 1% rule.
- Cap rate 5.8% vs local median 3.2% in Houston — top-decile yield for the area; either an underpriced asset or a hidden risk that comps aren't pricing in. Stress-test before assuming the spread holds.
Location & tenants
- Location reads 74/100 on livability (#184 in TX, #4,771 nationally) — a middle-class / working-renter tenant base. Strengths: amenities A+, cost of living A+, housing A+; Watch: schools D, crime F.
- Klein ISD (suburban): math 41% / reading 48% proficiency, ranked #213 of 826 in TX (top 26%) — families likely to look elsewhere, expect single-tenant / working-renter base with shorter leases.
- Market conditions: Rents soft (-1.9%/yr); 622 active listings in the ZIP; 12 comparable units currently listed for rent nearby; rentals leasing fast (median 5d on market — plan ~1-2 weeks tenant-placement turnaround); solid renter incomes; 29,883 units permitted in Harris County in 2024 (8,621 in 5+ unit buildings).
Forward outlook
- Local home prices are declining (-3.0%/yr); year-one equity from $2k of loan paydown is wiped out by about $7k of value loss. Plan a longer hold.
- Harris County population projected at +47% by 2050 — long-run rental-demand tailwind backs the buy-and-hold thesis.
Negotiation context
- It's been on market 111 days — a 9% lower offer ($223k) is reasonable based on typical stale-listing flexibility.
- 4 sale attempts since 18y ago with the ask held roughly flat each time — persistent listings suggest the price (not the market) is what's stuck; bring a comps-based counter.
Risks & watch-outs
- Climate carrying-cost: severe wind risk, 99% chance of damaging wind over 30y; extreme-heat days projected 7→23/yr by 2055 (HVAC capex compounding) — expect insurance premiums to compound above CPI over the hold.
Questions for the listing agent
- What do current leases actually rent for vs. the listed asking? Can we see a recent rent roll and the last 12 months of T-12 income?
- It's been on market 111 days. Have you received any prior offers? Is the seller open to a 12% concession, seller financing, or rate buy-down credit?
- What does the HOA fee cover, when was the last increase, and are there any pending special assessments or reserve-fund shortfalls?
- Why hasn't it sold? Are there any deal-killer items the seller is aware of (foundation, flood, title, zoning, code violations)?
- Is there a deadline driving the sale (1031 exchange, divorce, estate, relocation)? That informs how much negotiation room exists.
- Schools are D-rated, which usually means shorter tenancies and higher turnover. Who's the typical renter profile here, and what's been the actual vacancy rate?
- Crime grade is F in this area — have there been break-ins, vandalism, or insurance claims at this property in the last 3 years? What carrier currently insures it and at what premium?
- The area grade is low — what's the realistic commute time and amenity access for the typical tenant pool here? Any planned neighborhood developments (good or bad) we should know about?
- What's the average days-on-market for RENTAL listings here right now (not sales)? A rising rental-DOM trend means longer vacancies and softer asking-rent achievability than the comps imply.
- What's the recent tenant-quality profile in this submarket — average credit score on applications, eviction rate, late-payment / NSF rate, and stable-employment percentage? A property-management company in the area should have these aggregated.
- How much new for-sale + rental construction is in the pipeline within 1–3 miles? Heavy new supply typically softens prices + rents 12–24 months out; constrained supply supports both.
Investment metrics
- 1% rule
- 0.88% ✗
- Cap rate
- 5.82%
- Cash-on-cash
- -1.69%
- DSCR
- 0.92
- GRM
- 9.5
CMA / ARV
- ARV (median comp)
- $261,074
- List price
- $245,000
- Delta
- -6.16%
- Verdict
- FAIR
- Comps
- 20 within 1.0 mi
Show comp detail 12 sales within ~0.75 mi
| Address | Dist | Beds/Ba | Sqft | Sold | Price | $/sf | Match |
|---|---|---|---|---|---|---|---|
| 15815 Mustang Mountain Ct | 0.37mi | 3/2.0 (-1) | 1,734 (-1%) | 6mo | $300,000 | $173 | 70 |
| 17203 Kettle Creek Dr | 0.29mi | 4/2.5 | 1,940 (+11%) | 1mo | $279,000 | $144 | 68 |
| 17310 Colony Creek Dr | 0.52mi | 3/2.0 (-1) | 1,808 (+3%) | 1mo | $289,900 | $160 | 62 |
| 17311 Colony Creek Dr | 0.49mi | 3/2.0 (-1) | 1,806 (+3%) | 7mo | $269,000 | $149 | 59 |
| 9518 Dundalk St | 0.74mi | 4/2.0 | 1,712 (-2%) | 4mo | $259,999 | $152 | 56 |
| 9107 Wallingham Ct | 0.37mi | 3/2.0 (-1) | 1,958 (+12%) | 2mo | $265,000 | $135 | 54 |
| 9546 Cane Creek Dr | 0.73mi | 3/2.5 (-1) | 1,741 (-0%) | 7mo | $267,000 | $153 | 54 |
| 17327 Harmony Hill Dr | 0.56mi | 3/2.0 (-1) | 1,643 (-6%) | 5mo | $259,499 | $158 | 53 |
| 9511 Dornoch Dr | 0.65mi | 3/2.0 (-1) | 1,644 (-6%) | 0mo | $240,000 | $146 | 52 |
| 9102 Woodhouse Dr | 0.67mi | 3/2.5 (-1) | 1,899 (+9%) | 0mo | $282,000 | $148 | 49 |
| 9122 Cypress Square Dr | 0.61mi | 3/2.5 (-1) | 1,977 (+13%) | 1mo | $298,000 | $151 | 44 |
| 9626 Magnolia Ridge Dr | 0.71mi | 3/2.5 (-1) | 1,508 (-14%) | 0mo | $247,900 | $164 | 39 |
Match score weights: distance 35% · size 25% · config 20% · recency 20%. Top-matched comps best support the ARV.
Projected returns pro-forma
-3.0% appreciation · 0.0% rent growth · sell at horizon
- IRR
- -22.7%
- Equity multiple
- 0.24×
- Total profit
- $-52,096
- Equity at exit
- $36,530
- IRR
- -28.3%
- Equity multiple
- -0.13×
- Total profit
- $-77,363
- Equity at exit
- $21,183
Cash invested: $68,600 (down + closing). Projections, not guarantees.
Landlord ↔ Tenant lean methodology
- Overall (STATE)
- 87 Strongly Landlord-Friendly
- State Texas
- 87 Strongly Landlord-Friendly · R+5
- County
- — inherits STATE
- City
- — inherits STATE
ZIP-level market 77379
- Home prices YoY
- -34.7%
- Rents YoY
- -1.9%
- Active inventory
- 622
- Price-to-rent
- 9.5×
Monthly cashflow live
- Estimated rent
- $2,160 high interval (Pro) →
- Mortgage (P&I)
- −$1,285
- Tax from tax record
- −$381 /mo · $4,568/yr
- Insurance
- −$102
- HOA
- −$36
- Vacancy / Maint / Mgmt
- −$454
- Net cashflow
- $-97
Break-even live
UW: 25.0% down · 7.5% · 30yr · 1.5% tax · 5.0% vac · 8.0% maint · 8.0% mgmt
Financing live
Cash to close
- Down payment
- $61,250
- Closing costs
- $7,350
- Reserves months
- —
- Total cash needed
- —
Loan-product check · same deal, 3 products live
Conventional
25% down · 7.5% · 30yr
- Down + closing
- —
- Monthly P&I
- —
- Monthly cashflow
- —
- DSCR
- —
- Eligible?
- —
Personal DTI + credit; lowest rate.
DSCR
20% down · 8.5% · 30yr
- Down + closing
- —
- Monthly P&I
- —
- Monthly cashflow
- —
- DSCR
- —
- Eligible?
- —
No personal income docs; deal must DSCR.
Hard money
10% down · 12.0% · 12mo
- Down + closing
- —
- Monthly P&I
- —
- Monthly cashflow
- —
- DSCR
- —
- Eligible?
- —
Short-term bridge; refi at stabilization.
Rent comps 12 comps
| Address | Beds | Baths | Sqft | Rent | $/sqft | DOM | Units | Dist |
|---|---|---|---|---|---|---|---|---|
| 16834 Scenic Gardens Dr Spring, TX | 3.0 | 2.5 | 1900 | $1,945 | $1.02 | 43d | 1 | 0.40mi |
| 9331 Charter Pine St Houston, TX | 4.0 | 2.0 | 1806 | $2,145 | $1.19 | 21d | 1 | 0.46mi |
| 15500 Cutten Rd Houston, TX | 1.0–3.0 | 1.0–3.0 | 1422 | $2,790 | $1.96 | 1d | 29 | 0.52mi |
| 9127 Cypress Square Dr Spring, TX | 4.0 | 2.0 | 1837 | $2,099 | $1.14 | 5d | 1 | 0.63mi |
| 14818 Vintage Preserve Pkwy Unit 14851 Houston, TX | 3.0 | 2.0 | 1535 | $1,995 | $1.30 | 10d | 1 | 0.98mi |
| 14818 Vintage Preserve Pkwy Unit 3228 Houston, TX | 3.0 | 2.0 | 1535 | $1,963 | $1.28 | 2d | 1 | 0.98mi |
| 19939 Chasewood Park Dr Houston, TX | 1.0–3.0 | 1.0–2.0 | 1061 | $2,188 | $2.06 | 1d | 18 | 1.01mi |
| 17226 Modbury St Spring, TX | 3.0 | 2.0 | 1640 | $1,889 | $1.15 | 43d | 1 | 1.02mi |
| 14700 Vintage Preserve Pkwy Houston, TX | 1.0–3.0 | 1.0–2.0 | 1214 | $2,757 | $2.27 | 1d | 19 | 1.06mi |
| 9844 Cypresswood Dr Houston, TX | 1.0–3.0 | 1.0–2.0 | 1062 | $2,118 | $1.99 | 2d | 17 | 1.19mi |
| 9721 Cypresswood Dr Unit 9754 Houston, TX | 3.0 | 2.0 | 1230 | $1,839 | $1.50 | 10d | 1 | 1.30mi |
| 9721 Cypresswood Dr Unit 3148 Houston, TX | 3.0 | 2.0 | 1230 | $1,807 | $1.47 | 2d | 1 | 1.30mi |
HOA detail
- Monthly dues
- $36 · $432/yr
Listing history 29 events
-
2026-06-18days on market $245,000 Active 111 DOM
-
2026-06-17days on market $245,000 Active 110 DOM
-
2026-06-16days on market $245,000 Active 109 DOM
-
2026-06-15days on market $245,000 Active 108 DOM
-
2026-06-13days on market $245,000 Active 106 DOM
-
2026-06-09days on market $245,000 Active 102 DOM
-
2026-06-08days on market $245,000 Active 101 DOM
-
2026-06-07days on market $245,000 Active 100 DOM
-
2026-06-04days on market $245,000 Active 97 DOM
-
2026-06-03days on market $245,000 Active 96 DOM
-
2026-06-02days on market $245,000 Active 95 DOM
-
2026-06-02price $245,000 Active 94 DOM
-
2026-06-01days on market $253,000 Active 94 DOM
-
2026-05-31days on market $253,000 Active 93 DOM
-
2026-02-27$253,000 Active 584-char remark
Show marketing remark (584 chars)
Welcome to this beautifully maintained 4-bedroom, 2.5-bath home featuring soaring vaulted ceilings in the living room and an abundance of natural light throughout. The spacious living area is centered around a cozy fireplace, creating the perfect setting for relaxing or entertaining. The open layout flows seamlessly into the dining and kitchen areas, offering both comfort and functionality. Step outside to a large backyard with plenty of space for gatherings, pets, or future outdoor additions. A wonderful opportunity to own a home that combines space, warmth, and natural light.
-
2015-06-26soldstatus Sold 238-char remark
Show marketing remark (238 chars)
GREAT FOUR BEDROOM HOME. ALL BEDROOMS ARE UP. BEAUTIFUL HARDWOOD FLOORS IN LIVING ROOM AND ON THE STAIRS. TILE FLOORS IN THE KITCHEN. COVERED PATIO WITH FLAGSTONE EXTENSION. LARGE LANDSCAPED, FENCED BACK YARD. GREAT FOR FAMILY ACTIVITIES.
-
2015-06-15status Pending 238-char remark
Show marketing remark (238 chars)
GREAT FOUR BEDROOM HOME. ALL BEDROOMS ARE UP. BEAUTIFUL HARDWOOD FLOORS IN LIVING ROOM AND ON THE STAIRS. TILE FLOORS IN THE KITCHEN. COVERED PATIO WITH FLAGSTONE EXTENSION. LARGE LANDSCAPED, FENCED BACK YARD. GREAT FOR FAMILY ACTIVITIES.
-
2015-06-07status Option Pending 238-char remark
Show marketing remark (238 chars)
GREAT FOUR BEDROOM HOME. ALL BEDROOMS ARE UP. BEAUTIFUL HARDWOOD FLOORS IN LIVING ROOM AND ON THE STAIRS. TILE FLOORS IN THE KITCHEN. COVERED PATIO WITH FLAGSTONE EXTENSION. LARGE LANDSCAPED, FENCED BACK YARD. GREAT FOR FAMILY ACTIVITIES.
-
2015-06-07status Active 238-char remark
Show marketing remark (238 chars)
GREAT FOUR BEDROOM HOME. ALL BEDROOMS ARE UP. BEAUTIFUL HARDWOOD FLOORS IN LIVING ROOM AND ON THE STAIRS. TILE FLOORS IN THE KITCHEN. COVERED PATIO WITH FLAGSTONE EXTENSION. LARGE LANDSCAPED, FENCED BACK YARD. GREAT FOR FAMILY ACTIVITIES.
-
2015-06-06status Option Pending 238-char remark
Show marketing remark (238 chars)
GREAT FOUR BEDROOM HOME. ALL BEDROOMS ARE UP. BEAUTIFUL HARDWOOD FLOORS IN LIVING ROOM AND ON THE STAIRS. TILE FLOORS IN THE KITCHEN. COVERED PATIO WITH FLAGSTONE EXTENSION. LARGE LANDSCAPED, FENCED BACK YARD. GREAT FOR FAMILY ACTIVITIES.
-
2015-06-06price $135,000 238-char remark
Show marketing remark (238 chars)
GREAT FOUR BEDROOM HOME. ALL BEDROOMS ARE UP. BEAUTIFUL HARDWOOD FLOORS IN LIVING ROOM AND ON THE STAIRS. TILE FLOORS IN THE KITCHEN. COVERED PATIO WITH FLAGSTONE EXTENSION. LARGE LANDSCAPED, FENCED BACK YARD. GREAT FOR FAMILY ACTIVITIES.
-
2015-06-04$125,000 Active 238-char remark
Show marketing remark (238 chars)
GREAT FOUR BEDROOM HOME. ALL BEDROOMS ARE UP. BEAUTIFUL HARDWOOD FLOORS IN LIVING ROOM AND ON THE STAIRS. TILE FLOORS IN THE KITCHEN. COVERED PATIO WITH FLAGSTONE EXTENSION. LARGE LANDSCAPED, FENCED BACK YARD. GREAT FOR FAMILY ACTIVITIES.
-
2009-05-07soldstatus
-
2009-05-02soldstatus
-
2009-03-29historical
-
2008-12-04$109,900
-
2004-10-28soldstatus
-
2001-02-01soldstatus
-
1998-05-28soldstatus
ⓘ Source: listings_history table (triggers on properties + properties_extension) + one-shot
backfill from property_details.listing_events for pre-trigger history.
Tax reassessment forecast TX · Resets to sale price
- Current annual tax
- $4,568 · $381/mo
- Projected year-2 tax
- $4,568 · $381/mo
- Expected delta
- $0/yr ($0/mo · 0.0%)
ⓘ Screening estimate from a state-policy table — verify with the county assessor before closing.
Climate risk First Street
- Flood 1/10 Low FEMA zone X (unshaded) · 0% chance over 30 yrs
- Wildfire 1/10 Low
- Heat 9/10 Extreme 7 d/yr ≥111°F today · 23 d/yr by 30 yrs out
- Wind 9/10 Extreme 99% chance of damaging wind over 30 yrs
- Air quality 3/10 Moderate 2 unhealthy d/yr today · 3 by 30 yrs out
Nearby sold comps map
Loading sold comps map…
Walkable amenities ~0.75 mi
Loading nearby amenities…
Taxation est. · year 1
- Rental income
- $25,925
- − Mortgage interest
- −$13,724
- − Property taxes
- −$4,568
- − Insurance
- −$1,225
- − Repairs & maintenance
- −$2,074
- − Management
- −$2,074
- − HOA
- −$432
- − Depreciation
- −$7,127
- Taxable loss
- −$5,299
- Est. tax savings @ 24.0%
- +$1,272
- After-tax cash flow
- $110/yr
For passive investors: Depreciation is non-cash, so a rental often shows a tax loss while cash-flowing — sheltering income. Rental losses are passive: they offset passive income freely, and up to $25,000/yr can offset ordinary (W-2) income if you actively participate and your MAGI is under $100k (phasing out to $0 by $150k); unused losses carry forward. On sale, claimed depreciation is recaptured at up to 25%, and gains may owe capital-gains tax (a 1031 exchange can defer both). Figures are a year-1 estimate at your 24.0% rate — not tax advice; consult a CPA.
Schools (NCES district)
- District
- Klein ISD
- NCES district ID
- 4825740
- Math proficiency
- 41% ▼ -12.00%
- Reading proficiency
- 48% ▼ -3.00%
- Median HH income
- $78,288
- Composite
- 40.91/100
- National rank
- #3615
- State rank
- #213 of 826 in TX
Livability — Houston
- Score
- 74/100
- State rank
- #184
- US rank
- #4771
Category grades
Schools grade is shown separately in the Schools card above.
Census & demographics
- County
- Harris County · 4,702,590 people
- City population
- 3,226,434
- Metro
- Houston-The Woodlands-Sugar Land, TX
- Population (ZIP)
- 85,190
- Household income
- $107,486
- Rent vs Own
- Severe rent burden
- 2220.0
Population outlook (Harris County) Hauer SSP2
- Today (2025)
- 5,571,493 people
- By 2030
- 6,089,821 · +9.3%
- By 2040
- 7,142,806 · +28.2%
- By 2050
- 8,185,864 · +46.9%
- By 2075
- 10,574,329 · +89.8%
- By 2100
- 12,109,958 · +117.4%
Race, ethnicity, and origin ACS 2023
- Neighborhood character
- Diverse neighborhood (Simpson 0.68)
- Race & ethnicity
- White 49% Hispanic / Latino 24% Two or more races 15% Black 11% Asian 11%
- Hispanic origin (detail)
- Mexican 13% Puerto Rican 1% Cuban 1%
- Common ancestry
- Italian 2% Lithuanian 2% Slovak 2%
- Foreign-born
- 19% · Canada, Vietnam, China
- Languages at home
- 71% English-only · Spanish 16% Other Indo-European 5% Other Asian/Pacific 1%
Political lean MEDSL · Harris
- 2024 margin
- Lean D (+5.5) · D 52.0% · R 46.4% · Other 1.6%
- 2008→2024 swing
- +3.9pp toward D · 2008: 1.6pp · 2024: 5.5pp
- All cycles
- 2024: D+5.5 2020: D+13.3 2016: D+12.4 2012: D+0.1 2008: D+1.6
Not yet ingested
- Civics
- —
Market trends
- HPI YoY
- ▼ -116.58%
- Current HPI
- 218.9608
- Rent YoY
- ▼ -1.95%
- Metro
- Houston-The Woodlands-Sugar Land, TX
- State GDP YoY
- ▲ 3.95%
- F500 in state
- 110
Industry mix (Fortune 500 HQ in TX)
| Industry | F500 HQs | Revenue |
|---|---|---|
| Energy | 16 | $1,198B |
|
||
| Technology | 5 | $198B |
|
||
| Engineering / Construction | 4 | $72B |
|
||
| Energy Services | 3 | $60B |
|
||
| Utilities | 3 | $41B |
|
||
| Healthcare | 2 | $330B |
|
||
Price history
+130.2% since first listed15 events — show timeline
- 2026-02-27 Listed $253,000 HARMLS
- 2015-06-26 Sold (MLS) — HARMLS
- 2015-06-15 Pending — HARMLS
- 2015-06-07 Pending — HARMLS
- 2015-06-07 Relisted — HARMLS
- 2015-06-06 Pending — HARMLS
- 2015-06-06 Price Changed $135,000 HARMLS
- 2015-06-04 Listed $125,000 HARMLS
- 2009-05-07 Sold (Public Records) — Public Records
- 2009-05-02 Sold (MLS) — HARMLS
- 2009-03-29 Listing Removed — HARMLS
- 2008-12-04 Listed $109,900 HARMLS
- 2004-10-28 Sold (Public Records) — Public Records
- 2001-02-01 Sold (Public Records) — Public Records
- 1998-05-28 Sold (Public Records) — Public Records
Property tax history
+3.1%/yrLatest (2025): $4,568 · +2.8% YoY. Source: county tax records.
Cash-flow waterfall
monthlySold comps — $/sqft
last 12 mo · ≤1 miLoading sold comps…