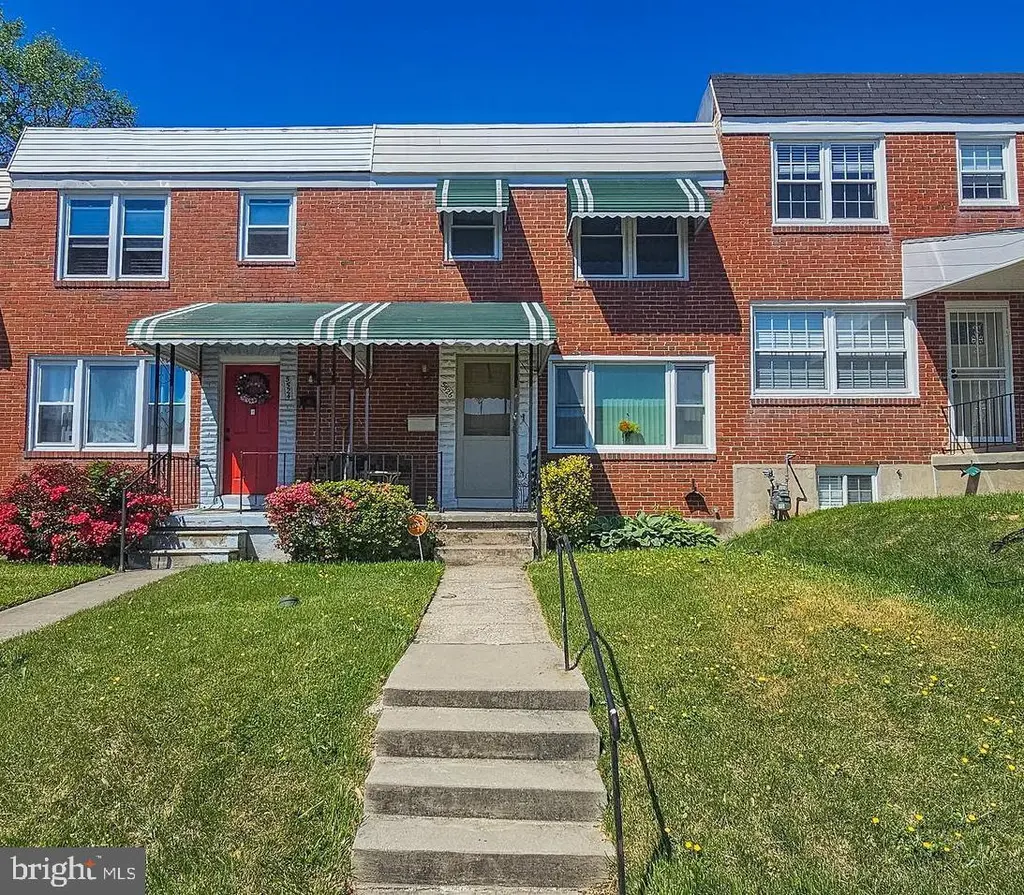
5526 Bucknell Rd · Baltimore, MD
Flood risk 1/10 · Minimal
- FEMA flood zone
- X (unshaded)
- Chance of flooding over 30 yrs
- 0.0%
- Est. flood insurance / yr
- $473 – $860
Fire risk 1/10 · Minimal
- Est. fire insurance / yr
- $755 – $1,403
Heat risk 8/10 · Major
- Hot days now (above 103°F)
- 7 days/yr
- Hot days in 30 yrs
- 15 days/yr
Wind risk 6/10 · Moderate
- Chance of severe wind over 30 yrs
- 27.0%
Air-quality risk 5/10 · Moderate
- Unhealthy air days now
- 6 days/yr
- Unhealthy air days in 30 yrs
- 8 days/yr
Risk factors via First Street. Map © Google.
Why this score? — see what drove the B- grade
The composite is a weighted blend of 9 inputs, each scored 0–100. Each bar is that input's sub-score; the figure is the points it added to the 100-point composite (weight × sub-score).
- Cash flow +30.0/30.0
- 1% rule +10.0/10.0
- DSCR +10.0/10.0
- ARV discount +7.5/15.0
- Livability +3.8/5.0
- Rent growth +3.6/5.0
- Condition / age +2.5/5.0
- Schools +1.0/10.0
- Appreciation +0.0/10.0
$80,000
🖨 Deal sheet 📄 Offer letter ✓ Due diligence
Listing remarks
OPEN HOUSE TUESDAY, MAY 26, 2026 FROM 12:00 - 1:00 PM List price is Opening Bid at The Online Only Auction Sale to Be Held on The Auctioneers Website – Bidding begins Friday, May 22 at 11:00AM & ends Wedneday, May 27th at 11:00 AM. Exceptional Opportunity! Brick Porchfront Rowhome in the Desirable Cedonia Neighborhood of Baltimore City. The main level features a spacious living room, dining room, and kitchen with access to a large rear deck and fenced backyard. The upper level includes 3 bedrooms and 1 full bathroom. The finished lower level offers a recreation room, laundry room, storage room, half bath, and a hurricane door with walk-up steps to the backyard. Additional
Key facts
- Built 1959
- Listed 18 days
Property features AI
Finance
- Financial info: Ground rent payable semi-annually; Ground rent amount applies
Exterior
- Parking: Off-street parking; On-street parking
- Utilities: Public water; Public sewer; Cable TV available; Natural gas hot water
- Home design: Interior townhouse/rowhouse; Below-grade finished living area present
- Construction: Brick construction; Block foundation; Rubber roof; Double-pane windows with screens; Built year per assessor
- Exterior features: Rear fencing; Deck(s); Porch(es)
Interior
- Kitchen: Cooktop; Double oven; Gas range/oven; Refrigerator; Exhaust fan
- Bedrooms: Three bedrooms on the first upper level
- Bathrooms: One full bathroom; One half bathroom
- Heating & cooling: Forced air heating (natural gas); Electric cooling (other type)
- Interior features: Galley kitchen layout; Window treatments; Traditional floor plan; Plaster walls; Storm doors
- Laundry & utility: Washer; Dryer
Neighborhood map
What this means for you Summary
Snapshot
- This is a 3-bed/1.5-bath townhouse listed at $80k.
Deal economics
- At list price, monthly cash flow is $968 ($12k/yr) — positive.
- The deal already cash-flows at list — no discount required.
- Meets the 1% rule at list price ($2k rent vs $80k).
- Recommended offer: $79k (1.5% below list) — sets the bar for market timing.
- Cap rate 20.8% vs local median 6.0% in Baltimore — top-decile yield for the area; either an underpriced asset or a hidden risk that comps aren't pricing in. Stress-test before assuming the spread holds.
Location & tenants
- Location reads 76/100 on livability (#90 in MD, #3,396 nationally) — a middle-class / working-renter tenant base. Strengths: amenities A+, commute A+, housing A+; Watch: schools D, crime F.
- Baltimore City Public Schools (urban): math 7% / reading 16% proficiency, ranked #24 of 24 in MD (top 100%) — low school quality limits family demand, transient renter base, plan for 1-2y turnover; 79% free/reduced lunch — lower-income household profile, screen leases tightly.
- Market conditions: Rents rising fast (+4.4%/yr); 173 active listings in the ZIP; 26 comparable units currently listed for rent nearby; rentals at typical pace (median 24d on market — plan ~3-4 weeks tenant-placement turnaround); 42% of comp listings sitting > 30 days — soft ceiling on asking rent; 1,273 units permitted in Baltimore city in 2024 (1,104 in 5+ unit buildings).
- This rent runs 39% of the median local income ($65k/yr) — at the standard rent-burdened threshold; future hikes will face affordability resistance.
Forward outlook
- Local home prices are declining (-3.0%/yr); year-one equity from $553 of loan paydown is wiped out by about $2k of value loss. Plan a longer hold.
- Baltimore County population projected to shrink 4% by 2050 — rents likely to lag national; underwrite the cash flow, not the appreciation.
- At projected returns (-3.0% appreciation + 4.4% rent growth), your $22k cash investment doubles in ~3 years — after that, you're playing with house money.
Negotiation context
- It's been on market 18 days — a 2% lower offer ($79k) is reasonable based on typical stale-listing flexibility.
- 2 sale attempts since 23y ago with the ask held roughly flat each time — persistent listings suggest the price (not the market) is what's stuck; bring a comps-based counter.
Risks & watch-outs
- Watch-outs: property tax is 3.8% of price; built in 1959 — expect roof / HVAC / electrical / plumbing capex.
- Climate carrying-cost: major wind risk, 27% chance of damaging wind over 30y; extreme-heat days projected 7→15/yr by 2055 (HVAC capex compounding) — expect insurance premiums to compound above CPI over the hold.
Questions for the listing agent
- Built in 1959 — when were the roof, HVAC, electrical panel, plumbing, and water heater last replaced?
- Property tax is high relative to price — has the assessment been appealed recently, and will the sale trigger a re-assessment?
- Is there a deadline driving the sale (1031 exchange, divorce, estate, relocation)? That informs how much negotiation room exists.
- Schools are D-rated, which usually means shorter tenancies and higher turnover. Who's the typical renter profile here, and what's been the actual vacancy rate?
- Crime grade is F in this area — have there been break-ins, vandalism, or insurance claims at this property in the last 3 years? What carrier currently insures it and at what premium?
- What's the average days-on-market for RENTAL listings here right now (not sales)? A rising rental-DOM trend means longer vacancies and softer asking-rent achievability than the comps imply.
- What's the recent tenant-quality profile in this submarket — average credit score on applications, eviction rate, late-payment / NSF rate, and stable-employment percentage? A property-management company in the area should have these aggregated.
- How much new for-sale + rental construction is in the pipeline within 1–3 miles? Heavy new supply typically softens prices + rents 12–24 months out; constrained supply supports both.
Investment metrics
- 1% rule
- 2.65% ✓
- Cap rate
- 20.81%
- Cash-on-cash
- 51.84%
- DSCR
- 3.31
- GRM
- 3.1
CMA / ARV
- ARV (median comp)
- $216,040
- List price
- $80,000
- Delta
- -62.97%
- Verdict
- UNDERPRICED
- Comps
- 20 within 1.0 mi
Show comp detail 12 sales within ~0.75 mi
| Address | Dist | Beds/Ba | Sqft | Sold | Price | $/sf | Match |
|---|---|---|---|---|---|---|---|
| 4705 Bayonne Ave | 0.37mi | 3/1.5 | 1,760 (+2%) | 1mo | $190,000 | $108 | 79 |
| 5727 Utrecht Rd | 0.52mi | 3/1.5 | 1,684 (-2%) | 2mo | $205,000 | $122 | 70 |
| 5724 Cedella Ave | 0.21mi | 4/2.0 (+1) | 1,850 (+7%) | 4mo | $252,000 | $136 | 68 |
| 1 Boymans Ct | 0.52mi | 3/2.0 | 1,734 (+0%) | 8mo | $257,000 | $148 | 67 |
| 5655 Leiden Rd | 0.40mi | 3/2.0 | 1,628 (-6%) | 9mo | $253,500 | $156 | 62 |
| 5269 Darien Rd | 0.47mi | 3/2.0 | 1,582 (-8%) | 1mo | $242,760 | $153 | 61 |
| 5529 Todd Ave | 0.24mi | 3/1.5 | 1,500 (-13%) | 8mo | $195,000 | $130 | 61 |
| 5637 Utrecht Rd | 0.37mi | 3/1.5 | 1,480 (-14%) | 6mo | $193,980 | $131 | 54 |
| 5631 Utrecht Rd | 0.37mi | 3/1.5 | 1,484 (-14%) | 9mo | $249,999 | $168 | 52 |
| 5912 Willet Ave | 0.61mi | 2/1.0 (-1) | 1,882 (+9%) | 1mo | $195,000 | $104 | 49 |
| 4300 Berger Ave | 0.72mi | 3/2.5 | 1,935 (+12%) | 0mo | $200,000 | $103 | 42 |
| 4227 Berger Ave | 0.74mi | 3/2.0 | 1,519 (-12%) | 3mo | $98,123 | $65 | 41 |
Match score weights: distance 35% · size 25% · config 20% · recency 20%. Top-matched comps best support the ARV.
Projected returns pro-forma
-3.0% appreciation · 4.43% rent growth · sell at horizon
- IRR
- 51.6%
- Equity multiple
- 3.32×
- Total profit
- $51,880
- Equity at exit
- $11,928
- IRR
- 57.6%
- Equity multiple
- 7.17×
- Total profit
- $138,096
- Equity at exit
- $6,917
Cash invested: $22,400 (down + closing). Projections, not guarantees.
Landlord ↔ Tenant lean methodology
- Overall (CITY)
- 12 Strongly Tenant-Friendly
- State Maryland
- 27 Tenant-Leaning · D+14
- County
- — inherits STATE
- City Baltimore
- 12 Strongly Tenant-Friendly · D+58
ZIP-level market 21206
- Rents YoY
- 4.4%
- Active inventory
- 173
- Price-to-rent
- 3.1×
Monthly cashflow live
- Estimated rent
- $2,117 high interval (Pro) →
- Mortgage (P&I)
- −$420
- Tax from tax record
- −$252 /mo · $3,025/yr
- Insurance
- −$33
- HOA
- −$0
- Vacancy / Maint / Mgmt
- −$445
- Net cashflow
- $968
Break-even live
UW: 25.0% down · 7.5% · 30yr · 1.5% tax · 5.0% vac · 8.0% maint · 8.0% mgmt
Financing live
Cash to close
- Down payment
- $20,000
- Closing costs
- $2,400
- Reserves months
- —
- Total cash needed
- —
Loan-product check · same deal, 3 products live
Conventional
25% down · 7.5% · 30yr
- Down + closing
- —
- Monthly P&I
- —
- Monthly cashflow
- —
- DSCR
- —
- Eligible?
- —
Personal DTI + credit; lowest rate.
DSCR
20% down · 8.5% · 30yr
- Down + closing
- —
- Monthly P&I
- —
- Monthly cashflow
- —
- DSCR
- —
- Eligible?
- —
No personal income docs; deal must DSCR.
Hard money
10% down · 12.0% · 12mo
- Down + closing
- —
- Monthly P&I
- —
- Monthly cashflow
- —
- DSCR
- —
- Eligible?
- —
Short-term bridge; refi at stabilization.
Rent comps 26 comps
| Address | Beds | Baths | Sqft | Rent | $/sqft | DOM | Units | Dist |
|---|---|---|---|---|---|---|---|---|
| 5307 Valiquet Ave Unit A Baltimore, MD | 2.0 | 1.0 | 1672 | $1,375 | $0.82 | 43d | 1 | 0.25mi |
| 5313 Todd Ave Baltimore, MD | 3.0 | 1.5 | 1280 | $1,800 | $1.41 | 16d | 1 | 0.49mi |
| 5253 Cedgate Rd Unit 1 Baltimore, MD | 3.0 | 1.5 | 1152 | $2,200 | $1.91 | 43d | 1 | 0.49mi |
| 5248 Darien Rd Baltimore, MD | 3.0 | 1.0 | 1584 | $2,100 | $1.33 | 43d | 1 | 0.50mi |
| 4924 Frankford Ave Baltimore, MD | 4.0 | 2.0 | 1176 | $2,600 | $2.21 | 24d | 1 | 0.51mi |
| 4308 Hamilton Ave Baltimore, MD | 2.0 | 1.0 | 1110 | $1,416 | $1.28 | 24d | 1 | 0.61mi |
| 8133 Bartholomew Ct Baltimore, MD | 3.0 | 2.5 | 1600 | $2,700 | $1.69 | 24d | 1 | 0.76mi |
| 5632 Belair Rd Baltimore, MD | 3.0 | 1.5 | 1260 | $2,100 | $1.67 | 24d | 1 | 0.79mi |
| 4905 Greencrest Rd Baltimore, MD | 3.0 | 1.5 | 1536 | $1,950 | $1.27 | 43d | 1 | 0.80mi |
| 4111 Century Rd Baltimore, MD | 3.0 | 1.5 | 1432 | $2,500 | $1.75 | 43d | 1 | 0.84mi |
| 1732 Chesaco Ave Rosedale, MD | 3.0 | 1.0 | 1260 | $2,295 | $1.82 | 43d | 1 | 0.89mi |
| 5938 Clayton Ave Baltimore, MD | 4.0 | 2.0 | 1296 | $2,872 | $2.22 | 16d | 1 | 0.92mi |
| 5611 Force Rd Baltimore, MD | 3.0 | 1.5 | 1296 | $1,850 | $1.43 | 43d | 1 | 0.93mi |
| 4517 Woodlea Ave Baltimore, MD | 2.0 | 2.0 | 1326 | $1,900 | $1.43 | 2d | 1 | 1.01mi |
| 4023 Belwood Ave Baltimore, MD | 3.0 | 1.0 | 1080 | $1,995 | $1.85 | 43d | 1 | 1.08mi |
| 4104 Parkwood Ave Baltimore, MD | 3.0 | 1.0 | 1224 | $2,800 | $2.29 | 24d | 1 | 1.10mi |
| 4718 Blue Ridge Ave Baltimore, MD | 4.0 | 3.0 | 1744 | $2,400 | $1.38 | 11d | 1 | 1.10mi |
| 3721 Frankford Ave Baltimore, MD | 3.0 | 2.0 | 1600 | $2,050 | $1.28 | 43d | 1 | 1.18mi |
| 3802 Biddison Ln Baltimore, MD | 4.0 | 1.5 | 1443 | $2,024 | $1.40 | 11d | 1 | 1.21mi |
| 2009 Longview Ave Rosedale, MD | 3.0 | 2.0 | 1062 | $2,500 | $2.35 | 14d | 1 | 1.25mi |
| 8006 Woodhaven Ct Rosedale, MD | 4.0 | 3.0 | 1680 | $3,200 | $1.90 | 24d | 1 | 1.27mi |
| 8212 Dorset Ave Rosedale, MD | 4.0 | 1.5 | 1479 | $2,250 | $1.52 | 43d | 1 | 1.32mi |
| 5731 Denwood Ave Baltimore, MD | 3.0 | 1.5 | 1152 | $1,700 | $1.48 | 22d | 1 | 1.34mi |
| 5731 Denwood Ave Baltimore, MD | 3.0 | 1.5 | 1440 | $1,700 | $1.18 | 24d | 1 | 1.34mi |
| 3510 Hamilton Ave Baltimore, MD | 3.0 | 2.5 | 2100 | $2,300 | $1.10 | 24d | 1 | 1.36mi |
| 3514 Ailsa Ave Baltimore, MD | 3.0 | 2.0 | 1800 | $2,200 | $1.22 | 43d | 1 | 1.44mi |
Listing history 5 events
-
2026-05-08$80,000 Active 797-char remark
-
2003-06-19soldstatus $88,900
-
2003-05-28soldstatus $88,900
-
2003-03-29historical
-
2003-03-13$87,900
ⓘ Source: listings_history table (triggers on properties + properties_extension) + one-shot
backfill from property_details.listing_events for pre-trigger history.
Tax reassessment forecast MD · Partial reset (capped growth)
- Current annual tax
- $3,025 · $252/mo
- Projected year-2 tax
- $3,025 · $252/mo
- Expected delta
- $0/yr ($0/mo · 0.0%)
ⓘ Screening estimate from a state-policy table — verify with the county assessor before closing.
Climate risk First Street
- Flood 1/10 Low FEMA zone X (unshaded) · 0% chance over 30 yrs
- Wildfire 1/10 Low
- Heat 8/10 Severe 7 d/yr ≥103°F today · 15 d/yr by 30 yrs out
- Wind 6/10 Major 27% chance of damaging wind over 30 yrs
- Air quality 5/10 Major 6 unhealthy d/yr today · 8 by 30 yrs out
Nearby sold comps map
Loading sold comps map…
Walkable amenities ~0.75 mi
Loading nearby amenities…
Taxation est. · year 1
- Rental income
- $25,406
- − Mortgage interest
- −$4,481
- − Property taxes
- −$3,025
- − Insurance
- −$400
- − Repairs & maintenance
- −$2,032
- − Management
- −$2,032
- − Depreciation
- −$2,327
- Taxable income
- $11,108
- Est. tax owed @ 24.0%
- −$2,666
- After-tax cash flow
- $8,946/yr
For passive investors: Depreciation is non-cash, so a rental often shows a tax loss while cash-flowing — sheltering income. Rental losses are passive: they offset passive income freely, and up to $25,000/yr can offset ordinary (W-2) income if you actively participate and your MAGI is under $100k (phasing out to $0 by $150k); unused losses carry forward. On sale, claimed depreciation is recaptured at up to 25%, and gains may owe capital-gains tax (a 1031 exchange can defer both). Figures are a year-1 estimate at your 24.0% rate — not tax advice; consult a CPA.
Schools (NCES district)
- District
- Baltimore City Public Schools
- NCES district ID
- 2400090
- Math proficiency
- 7% ▼ -9.00%
- Reading proficiency
- 16% ▼ -5.00%
- Median HH income
- $42,108
- Composite
- 10.08/100
- National rank
- #9805
- State rank
- #24 of 24 in MD
Livability — Baltimore
- Score
- 76/100
- State rank
- #90
- US rank
- #3396
Category grades
Schools grade is shown separately in the Schools card above.
Census & demographics
- Census place
- Baltimore, MD
- County
- Baltimore City · 558,601 people
- City population
- 588,727
- Metro
- Baltimore-Columbia-Towson, MD
- Population (ZIP)
- 48,902
- Household income
- $64,531
- Rent vs Own
- Severe rent burden
- 2317.0
Population outlook (Baltimore County) Hauer SSP2
- Today (2025)
- 624,249 people
- By 2030
- 621,541 · -0.4%
- By 2040
- 609,756 · -2.3%
- By 2050
- 597,249 · -4.3%
- By 2075
- 552,236 · -11.5%
- By 2100
- 513,934 · -17.7%
Race, ethnicity, and origin ACS 2023
- Neighborhood character
- Predominantly Black (73%)
- Race & ethnicity
- Black 73% White 20% Two or more races 3% Hispanic / Latino 3% Asian 2%
- Common ancestry
- Romanian 3% Ukrainian 1%
- Foreign-born
- 8% · Canada
- Languages at home
- 92% English-only · Spanish 2% Arabic 2% Other Indo-European 1%
Political lean MEDSL · Baltimore
- 2024 margin
- Solid D (+73.0) · D 85.2% · R 12.2% · Other 2.6%
- 2008→2024 swing
- -2.5pp toward R · 2008: 75.5pp · 2024: 73.0pp
- All cycles
- 2024: D+73.0 2020: D+76.6 2016: D+74.6 2012: D+76.4 2008: D+75.5
Not yet ingested
- Civics
- —
Market trends
- HPI YoY
- ▼ -191.83%
- Current HPI
- 284.5645
- Rent YoY
- ▲ 4.43%
- Metro
- Baltimore-Columbia-Towson, MD
- State GDP YoY
- ▲ 2.97%
- F500 in state
- 12
Industry mix (Fortune 500 HQ in MD)
| Industry | F500 HQs | Revenue |
|---|---|---|
| Aerospace / Defense | 1 | $71B |
|
||
| Utilities | 1 | $25B |
|
||
| Hotels | 1 | $24B |
|
||
| Consumer Goods | 1 | $7B |
|
||
| Real Estate | 1 | $6B |
|
||
| Chemicals | 1 | $2B |
|
||
Price history
-9.0% since first listed6 events — show timeline
- 2026-05-28 Listing Removed — BRIGHT MLS
- 2026-05-08 Listed $80,000 BRIGHT MLS
- 2003-06-19 Sold (Public Records) $88,900 Public Records
- 2003-05-28 Sold (MLS) $88,900 MRIS
- 2003-03-29 Delisted — MRIS
- 2003-03-13 Listed $87,900 MRIS
Property tax history
+0.5%/yrLatest (2025): $3,025 · +2.7% YoY. Source: county tax records.
Cash-flow waterfall
monthlySold comps — $/sqft
last 12 mo · ≤1 miLoading sold comps…