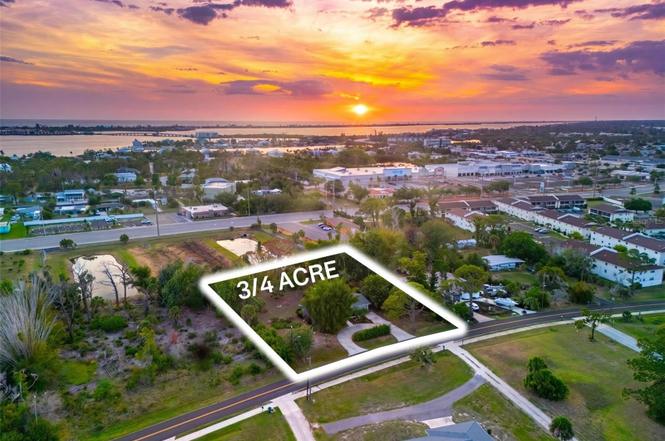
1620 Manor Rd · Englewood, FL
Flood risk 9/10 · Severe
- FEMA flood zone
- AE
- Chance of flooding over 30 yrs
- 0.99%
- Est. flood insurance / yr
- $1,737 – $8,500
Fire risk 2/10 · Minimal
- Est. fire insurance / yr
- $947 – $1,759
Heat risk 10/10 · Severe
- Hot days now (above 107°F)
- 7 days/yr
- Hot days in 30 yrs
- 28 days/yr
Wind risk 10/10 · Severe
- Chance of severe wind over 30 yrs
- 99.0%
Air-quality risk 2/10 · Minimal
- Unhealthy air days now
- 1 days/yr
- Unhealthy air days in 30 yrs
- 1 days/yr
Risk factors via First Street. Map © Google.
Why this score? — see what drove the D+ grade
The composite is a weighted blend of 9 inputs, each scored 0–100. Each bar is that input's sub-score; the figure is the points it added to the 100-point composite (weight × sub-score).
- Cash flow +16.6/30.0
- ARV discount +7.5/15.0
- DSCR +5.2/10.0
- Rent growth +4.8/5.0
- Schools +4.6/10.0
- Livability +3.7/5.0
- 1% rule +3.5/10.0
- Condition / age +2.5/5.0
- Appreciation +0.0/10.0
$430,000
🖨 Deal sheet 📄 Offer letter ✓ Due diligence
Listing remarks MLS
Rare find! Country living on 3/4 of an acre in town with this 3/2/1 pool home with beautiful shade and fruit trees. Conveniently located, close to a public boat ramp on Ainger creek. 5-10 minutes to beach, close to shopping and numerous golf coursesnearby. 2 sheds, one large metal shed 1/2 air conditioned office, 1/2 storage area and another shed for tools etc. Pool is 30x15 and there is a big concrete block smoke house on premises. This is a great buy!!!
Key facts
- Circular driveway
- New roof
- Impact rated windows
Tags
Property features AI
Finance
- Other: Property zoned RSF3.5; Total acreage approximately 0.76 acres (165 x 200 lot)
- HOA & community: No HOA listed; Pets allowed
Exterior
- Parking: Attached garage (1 car)
- Utilities: Public water; Public sewer; Electricity connected
- Home design: Single-family residence; One story; Northeast facing; Homestead exempt; Completed condition
- Construction: Block construction; Shingle roof; Slab foundation; Built as existing (year not provided)
- Exterior features: Rear porch; Outdoor shower; Private mailbox; Chain link fencing; Shed(s) and workshop; Flood insurance may be required; Landscaped grounds; Oversized lot; Paved surfaces
Interior
- Kitchen: Dishwasher; Range; Refrigerator
- Bedrooms: 3 bedrooms
- Flooring: Terrazzo
- Bathrooms: 2 full bathrooms
- Heating & cooling: Electric heating; Central air conditioning
- Interior features: Ceiling fans; Solid surface counters; Storm windows
- Laundry & utility: Laundry area in garage
Neighborhood map
What this means for you Summary
Snapshot
- This is a 3-bed/2.0-bath single-family listed at $430k.
Deal economics
- At list price, monthly cash flow is $-167 ($-2k/yr) — negative.
- To cash-flow at today's rent, offer at most $400k (6.9% below list).
- To meet the 1% rule (rent ≥ 1% of price), the offer needs to be $365k (15.2% below list).
- Recommended offer: $365k (15.2% below list) — sets the bar for 1% rule.
- Cap rate 7.0% vs local median 3.8% in Englewood — top-decile yield for the area; either an underpriced asset or a hidden risk that comps aren't pricing in. Stress-test before assuming the spread holds.
Location & tenants
- Location reads 73/100 on livability (#321 in FL) — a middle-class / working-renter tenant base. Strengths: housing A+, cost of living A, health & safety A; Watch: employment C-, amenities F, commute F.
- Charlotte (suburban): math 54% / reading 54% proficiency, ranked #22 of 73 in FL (top 30%) — acceptable for families but not a draw, mixed tenant base, ~2y average lease.
- Market conditions: Rents rising fast (+9.0%/yr); 717 active listings in the ZIP; 17 comparable units currently listed for rent nearby; rentals at typical pace (median 21d on market — plan ~3-4 weeks tenant-placement turnaround); solid renter incomes; 4,585 units permitted in Charlotte County in 2024 (703 in 5+ unit buildings).
- At $3,646/mo this rent would consume 58% of the median local household income ($76k/yr) (locally 290% of renters already pay >50% of income on rent) — very limited rent-growth headroom before tenants either downsize or default.
Forward outlook
- Local home prices are declining (-3.0%/yr); year-one equity from $3k of loan paydown is wiped out by about $13k of value loss. Plan a longer hold.
- Charlotte County population projected at +24% by 2050 — long-run rental-demand tailwind backs the buy-and-hold thesis.
Negotiation context
- Only 8 days on market — expect competitive offers; lowballing is unlikely to land.
- 4 sale attempts since 22y ago with the ask held roughly flat each time — persistent listings suggest the price (not the market) is what's stuck; bring a comps-based counter.
- Current owner paid $185k; list at $430k implies a 132% gain — meaningful room to come down on a strong offer.
Risks & watch-outs
- Watch-outs: flood insurance adds $427/mo.
- Climate carrying-cost: in FEMA flood zone AE (mandatory federal flood insurance); severe wind risk, 99% chance of damaging wind over 30y; extreme-heat days projected 7→28/yr by 2055 (HVAC capex compounding) — expect insurance premiums to compound above CPI over the hold.
Questions for the listing agent
- What do current leases actually rent for vs. the listed asking? Can we see a recent rent roll and the last 12 months of T-12 income?
- Built in 1969 — when were the roof, HVAC, electrical panel, plumbing, and water heater last replaced?
- What's the actual annual flood-insurance premium (NFIP or private), and is the property in a SFHA with mandatory coverage?
- Is there a deadline driving the sale (1031 exchange, divorce, estate, relocation)? That informs how much negotiation room exists.
- Schools are A-rated — typically a magnet for longer-tenancy family renters. What's the average tenant stay here, and is there a school-zone premium baked into asking?
- The area grade is low — what's the realistic commute time and amenity access for the typical tenant pool here? Any planned neighborhood developments (good or bad) we should know about?
- What's the average days-on-market for RENTAL listings here right now (not sales)? A rising rental-DOM trend means longer vacancies and softer asking-rent achievability than the comps imply.
- What's the recent tenant-quality profile in this submarket — average credit score on applications, eviction rate, late-payment / NSF rate, and stable-employment percentage? A property-management company in the area should have these aggregated.
- How much new for-sale + rental construction is in the pipeline within 1–3 miles? Heavy new supply typically softens prices + rents 12–24 months out; constrained supply supports both.
Investment metrics
- 1% rule
- 0.85% ✗
- Cap rate
- 7.02%
- Cash-on-cash
- 2.59%
- DSCR
- 1.12
- GRM
- 9.8
CMA / ARV
- ARV (on-the-fly)
- $262,361
- Comps found
- 10
Show comp detail 10 sales within ~0.75 mi
| Address | Dist | Beds/Ba | Sqft | Sold | Price | $/sf | Match |
|---|---|---|---|---|---|---|---|
| 6 Cove Ln | 0.53mi | 4/2.5 (+1) | 1,400 (-0%) | 7mo | $430,000 | $307 | 62 |
| 1665 Manor Rd | 0.14mi | 2/1.0 (-1) | 1,298 (-8%) | 14mo | $230,000 | $177 | 61 |
| 2090 S Pine St | 0.46mi | 2/2.0 (-1) | 1,492 (+6%) | 14mo | $225,000 | $151 | 51 |
| 1720 Florence Ave | 0.44mi | 2/2.0 (-1) | 1,293 (-8%) | 14mo | $250,000 | $193 | 50 |
| 1157 North Ln | 0.64mi | 2/1.0 (-1) | 1,356 (-3%) | 9mo | $187,000 | $138 | 48 |
| 1575 Loralin Dr | 0.57mi | 3/2.0 | 1,322 (-6%) | 22mo | $410,000 | $310 | 46 |
| 1740 Edith Ave | 0.57mi | 2/2.0 (-1) | 1,219 (-13%) | 6mo | $215,000 | $176 | 42 |
| 1060 Haste Ln | 0.50mi | 2/2.0 (-1) | 1,212 (-14%) | 10mo | $325,000 | $268 | 40 |
| 1220 Greaza St | 0.61mi | 2/2.0 (-1) | 1,527 (+9%) | 17mo | $285,500 | $187 | 38 |
| 1725 Blue Bird Ln | 0.75mi | 2/2.0 (-1) | 1,238 (-12%) | 6mo | $215,000 | $174 | 36 |
Match score weights: distance 35% · size 25% · config 20% · recency 20%. Top-matched comps best support the ARV.
Projected returns pro-forma
-3.0% appreciation · 8.0% rent growth · sell at horizon
- IRR
- -13.4%
- Equity multiple
- 0.49×
- Total profit
- $-60,950
- Equity at exit
- $64,114
- IRR
- 2.0%
- Equity multiple
- 1.18×
- Total profit
- $21,331
- Equity at exit
- $37,179
Cash invested: $120,400 (down + closing). Projections, not guarantees.
Landlord ↔ Tenant lean methodology
- Overall (STATE)
- 87 Strongly Landlord-Friendly
- State Florida
- 87 Strongly Landlord-Friendly · R+3
- County
- — inherits STATE
- City
- — inherits STATE
ZIP-level market 34223
- Home prices YoY
- -34.2%
- Rents YoY
- 9.0%
- Active inventory
- 717
- Price-to-rent
- 9.8×
Monthly cashflow live
- Estimated rent
- $3,646 high interval (Pro) →
- Mortgage (P&I)
- −$2,255
- Tax from tax record
- −$187 /mo · $2,240/yr
- Insurance
- −$179
- Flood insurance flood zone
- −$427 /mo · $5,118/yr
- HOA
- −$0
- Vacancy / Maint / Mgmt
- −$766
- Net cashflow
- $-167
Break-even live
UW: 25.0% down · 7.5% · 30yr · 1.5% tax · 5.0% vac · 8.0% maint · 8.0% mgmt
Financing live
Cash to close
- Down payment
- $107,500
- Closing costs
- $12,900
- Reserves months
- —
- Total cash needed
- —
Loan-product check · same deal, 3 products live
Conventional
25% down · 7.5% · 30yr
- Down + closing
- —
- Monthly P&I
- —
- Monthly cashflow
- —
- DSCR
- —
- Eligible?
- —
Personal DTI + credit; lowest rate.
DSCR
20% down · 8.5% · 30yr
- Down + closing
- —
- Monthly P&I
- —
- Monthly cashflow
- —
- DSCR
- —
- Eligible?
- —
No personal income docs; deal must DSCR.
Hard money
10% down · 12.0% · 12mo
- Down + closing
- —
- Monthly P&I
- —
- Monthly cashflow
- —
- DSCR
- —
- Eligible?
- —
Short-term bridge; refi at stabilization.
Rent comps 17 comps
| Address | Beds | Baths | Sqft | Rent | $/sqft | DOM | Units | Dist |
|---|---|---|---|---|---|---|---|---|
| 1531 Placida Rd #203 Englewood, FL | 2.0 | 2.0 | 1056 | $3,900 | $3.69 | 20d | 1 | 0.10mi |
| 1531 Placida Rd #204 Englewood, FL | 2.0 | 2.0 | 1056 | $3,500 | $3.31 | 20d | 1 | 0.10mi |
| 1081 Humboldt St Englewood, FL | 3.0 | 2.0 | 1838 | $2,400 | $1.31 | 20d | 1 | 0.40mi |
| 1575 Loralin Dr Englewood, FL | 3.0 | 2.0 | 1322 | $5,000 | $3.78 | 20d | 1 | 0.58mi |
| 1501 Helene Ave Englewood, FL | 3.0 | 2.0 | 1608 | $3,200 | $1.99 | 13d | 1 | 0.59mi |
| 1120 Lampp Dr Englewood, FL | 3.0 | 2.0 | 1212 | $4,000 | $3.30 | 20d | 1 | 0.74mi |
| 1210 S Maryknoll Rd Englewood, FL | 2.0 | 2.0 | 1063 | $2,600 | $2.45 | 20d | 1 | 0.74mi |
| 1401 S McCall Rd Unit 301A Englewood, FL | 2.0 | 2.0 | 1093 | $3,300 | $3.02 | 20d | 1 | 0.74mi |
| 858 E 7th St Englewood, FL | 3.0 | 2.0 | 1244 | $1,995 | $1.60 | 20d | 1 | 0.80mi |
| 2275 S McCall Rd #201 Englewood, FL | 2.0 | 2.0 | 1050 | $2,000 | $1.90 | 13d | 1 | 0.89mi |
| 1960 Oregon Trl Unit 2A Englewood, FL | 2.0 | 2.0 | 1360 | $3,750 | $2.76 | 20d | 1 | 0.93mi |
| 1375 Beach Rd #311 Englewood, FL | 3.0 | 2.0 | 1686 | $4,950 | $2.94 | 20d | 1 | 0.94mi |
| 1945 Michigan Ave Englewood, FL | 4.0 | 3.0 | 1579 | $8,000 | $5.07 | 20d | 1 | 1.14mi |
| 1970 Georgia Ave Englewood, FL | 3.0 | 2.0 | 1160 | $11,790 | $10.16 | 20d | 1 | 1.17mi |
| 2643 Lear Rd Englewood, FL | 2.0 | 2.0 | 1206 | $5,800 | $4.81 | 20d | 1 | 1.35mi |
| 6699 San Casa Dr Englewood, FL | 2.0 | 2.0 | 1028 | $1,900 | $1.85 | 20d | 1 | 1.40mi |
| 1915 Pennsylvania Ave Englewood, FL | 2.0 | 2.0 | 1394 | $7,500 | $5.38 | 20d | 1 | 1.45mi |
Listing history 7 events
-
2026-06-18days on market $430,000 Active 8 DOM
-
2026-06-17days on market $430,000 Active 7 DOM
-
2026-06-16days on market $430,000 Active 6 DOM
-
2026-06-15days on market $430,000 Active 5 DOM
-
2026-06-14days on market $430,000 Active 3 DOM
-
2026-06-13remarks 689-char remark
-
2026-06-13$430,000 Active 2 DOM
ⓘ Source: listings_history table (triggers on properties + properties_extension) + one-shot
backfill from property_details.listing_events for pre-trigger history.
Tax reassessment forecast FL · Resets to sale price
- Current annual tax
- $2,240 · $187/mo
- Projected year-2 tax
- $3,569 · $297/mo
- Expected delta
- +$1,329/yr (+$111/mo · 59.3%)
ⓘ Screening estimate from a state-policy table — verify with the county assessor before closing.
Climate risk First Street
- Flood 9/10 Extreme FEMA zone AE · 99% chance over 30 yrs
- Wildfire 2/10 Low
- Heat 10/10 Extreme 7 d/yr ≥107°F today · 28 d/yr by 30 yrs out
- Wind 10/10 Extreme 99% chance of damaging wind over 30 yrs
- Air quality 2/10 Low 1 unhealthy d/yr today · 1 by 30 yrs out
Nearby sold comps map
Loading sold comps map…
Walkable amenities ~0.75 mi
Loading nearby amenities…
Taxation est. · year 1
- Rental income
- $43,751
- − Mortgage interest
- −$24,087
- − Property taxes
- −$2,240
- − Insurance
- −$7,268
- − Repairs & maintenance
- −$3,500
- − Management
- −$3,500
- − Depreciation
- −$12,509
- Taxable loss
- −$9,354
- Est. tax savings @ 24.0%
- +$2,245
- After-tax cash flow
- $240/yr
For passive investors: Depreciation is non-cash, so a rental often shows a tax loss while cash-flowing — sheltering income. Rental losses are passive: they offset passive income freely, and up to $25,000/yr can offset ordinary (W-2) income if you actively participate and your MAGI is under $100k (phasing out to $0 by $150k); unused losses carry forward. On sale, claimed depreciation is recaptured at up to 25%, and gains may owe capital-gains tax (a 1031 exchange can defer both). Figures are a year-1 estimate at your 24.0% rate — not tax advice; consult a CPA.
Schools (NCES district)
- District
- Charlotte
- NCES district ID
- 1200240
- Math proficiency
- 54% ▼ -6.00%
- Reading proficiency
- 54% ▼ -1.00%
- Median HH income
- $44,864
- Composite
- 45.62/100
- National rank
- #2586
- State rank
- #22 of 73 in FL
Livability — Englewood
- Score
- 73/100
- State rank
- #321
- US rank
- #5655
Category grades
Schools grade is shown separately in the Schools card above.
Census & demographics
- Census place
- Englewood, FL
- County
- Sarasota County · 448,376 people
- City population
- 35,420
- Metro
- North Port-Sarasota-Bradenton, FL
- Population (ZIP)
- 19,884
- Household income
- $76,016
- Rent vs Own
- Severe rent burden
- 290.0
Population outlook (Charlotte County) Hauer SSP2
- Today (2025)
- 198,646 people
- By 2030
- 210,507 · +6.0%
- By 2040
- 230,857 · +16.2%
- By 2050
- 247,148 · +24.4%
- By 2075
- 281,777 · +41.8%
- By 2100
- 293,609 · +47.8%
Race, ethnicity, and origin ACS 2023
- Neighborhood character
- Predominantly White (94%)
- Race & ethnicity
- White 94% Two or more races 3% Hispanic / Latino 3% Asian 1%
- Common ancestry
- Romanian 7% Lithuanian 4% Iranian 2%
- Foreign-born
- 9% · Canada
- Languages at home
- 94% English-only · German/W. Germanic 2% Spanish 1% Other Indo-European 1%
Political lean MEDSL · Charlotte
- 2024 margin
- Solid R (+34.0) · D 32.7% · R 66.7%
- 2008→2024 swing
- -26.7pp toward R · 2008: -7.2pp · 2024: -34.0pp
- All cycles
- 2024: R+34.0 2020: R+26.6 2016: R+27.8 2012: R+14.3 2008: R+7.2
Not yet ingested
- Civics
- —
Market trends
- HPI YoY
- ▼ -146.26%
- Current HPI
- 281.0529
- Rent YoY
- ▲ 9.02%
- Metro
- North Port-Sarasota-Bradenton, FL
- State GDP YoY
- ▲ 3.28%
- F500 in state
- 36
Industry mix (Fortune 500 HQ in FL)
| Industry | F500 HQs | Revenue |
|---|---|---|
| Industrial Technology | 2 | $29B |
|
||
| Insurance | 2 | $17B |
|
||
| Retail | 1 | $60B |
|
||
| Technology Distribution | 1 | $58B |
|
||
| Homebuilding | 1 | $35B |
|
||
| Technology Manufacturing | 1 | $35B |
|
||
Price history
+485.0% since first listed10 events — show timeline
- 2026-06-10 Listed $430,000 Stellar MLS as Distributed by MLS Grid
- 2026-04-29 Listed for Rent $4,200 TURBOTENANT
- 2026-04-28 Rental Removed $4,200 TURBOTENANT
- 2026-04-14 Price Changed $4,200 TURBOTENANT
- 2026-02-16 Listed for Rent $4,500 TURBOTENANT
- 2004-07-28 Sold (Public Records) $185,000 Public Records
- 2004-06-15 Sold (MLS) $185,000 Stellar MLS as Distributed by MLS Grid
- 2004-04-24 Listing Removed — Stellar MLS as Distributed by MLS Grid
- 2004-02-04 Listed $189,900 Stellar MLS as Distributed by MLS Grid
- 1993-04-16 Sold (Public Records) $73,500 Public Records
Property tax history
+7.3%/yrLatest (2025): $2,240 · -8.7% YoY. Source: county tax records.
Cash-flow waterfall
monthlySold comps — $/sqft
last 12 mo · ≤1 miLoading sold comps…