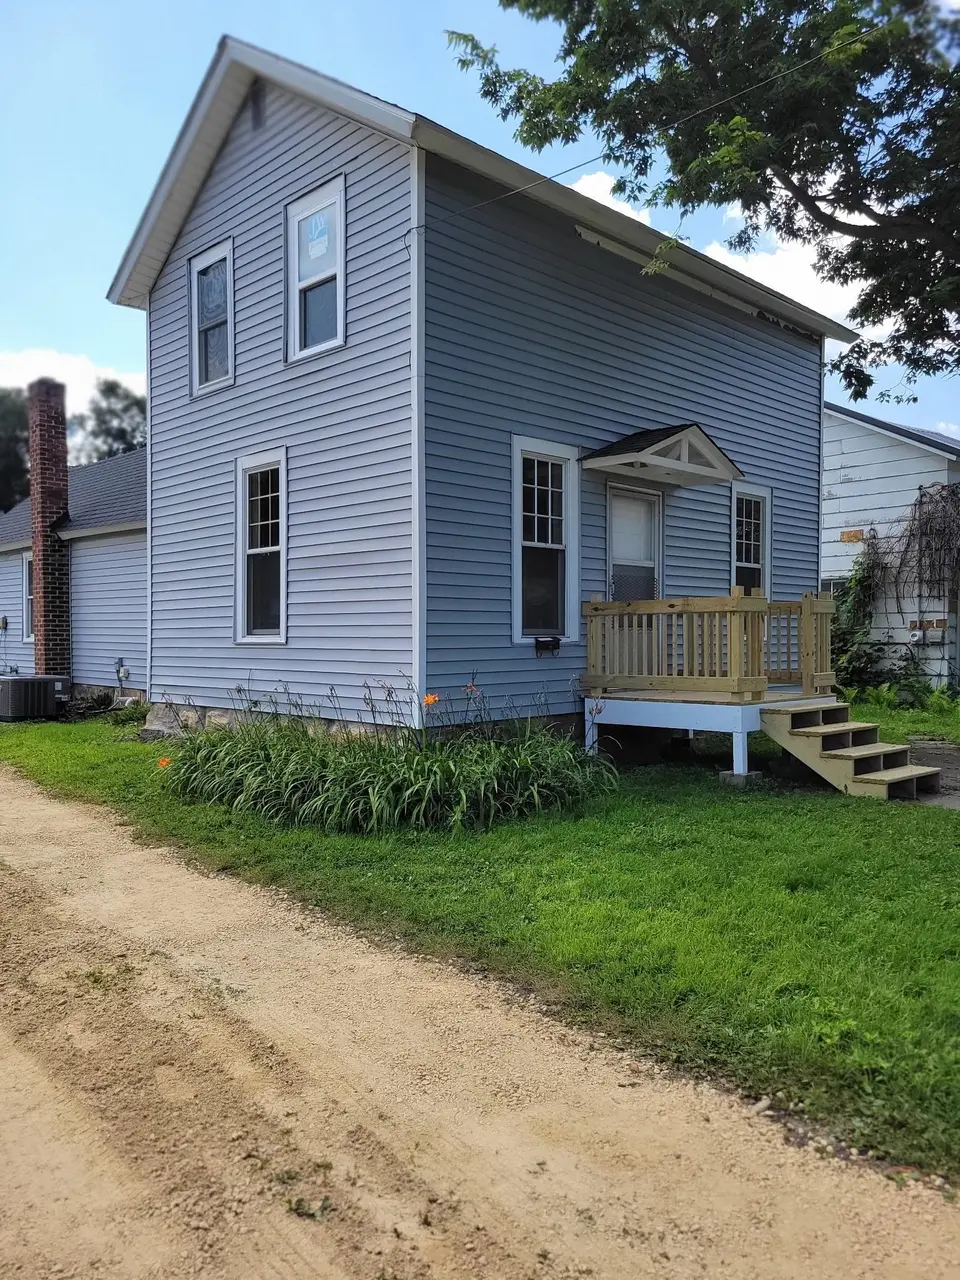
225 E 5th St · Red Wing, MN
Flood risk 5/10 · Moderate
- FEMA flood zone
- X (unshaded)
- Chance of flooding over 30 yrs
- 0.48%
- Est. flood insurance / yr
- $473 – $860
Fire risk 2/10 · Minimal
- Est. fire insurance / yr
- $888 – $1,650
Heat risk 2/10 · Minimal
- Hot days now (above 100°F)
- 7 days/yr
- Hot days in 30 yrs
- 15 days/yr
Wind risk 2/10 · Minimal
- Chance of severe wind over 30 yrs
- —
Air-quality risk 1/10 · Minimal
- Unhealthy air days now
- 0 days/yr
- Unhealthy air days in 30 yrs
- 0 days/yr
Risk factors via First Street. Map © Google.
Why this score? — see what drove the D+ grade
The composite is a weighted blend of 9 inputs, each scored 0–100. Each bar is that input's sub-score; the figure is the points it added to the 100-point composite (weight × sub-score).
- Cash flow +14.5/30.0
- ARV discount +14.0/15.0
- DSCR +4.4/10.0
- Livability +4.0/5.0
- Schools +3.5/10.0
- 1% rule +3.2/10.0
- Rent growth +2.5/5.0
- Condition / age +2.5/5.0
- Appreciation +0.0/10.0
$209,900
🖨 Deal sheet (PDF) 📄 Offer letter ✓ Due diligence
Listing remarks
Fully renovated home offering a perfect blend of charm and modern updates. Features include a new everything! brand-new kitchen with breakfast bar, a newly added bathroom, and new front and back porches ideal for relaxing or entertaining. Enjoy comfort year-round with a new furnace and A/C, all new kitchen appliances, not forgetting some new windows plus cozy up by the fireplace in the living area flooring and laundry. Move-in ready with stylish finishes throughout—this is a must-see property. home offers a prime location nestled between the scenic beauty of Barn Bluff and the vibrant charm of downtown. Just a short walk east leads to trailheads for He Mni Can/Barn Bluff, perfect for
Key facts
- New furnace
- New kitchen
- Newly added bathroom
Tags
Property features AI
Exterior
- Parking: 2-car garage (36 x 24 x 12)
- Utilities: City water connected; City sewer connected; Natural gas
- Home design: Residential property; One-and-one-half story; Facing direction not specified; Entry level details not specified
- Construction: Frame construction; Asphalt roof; Stone foundation; Foundation area approximately 384
- Exterior features: Wood exterior; City street frontage; Lot approximately 0.1 acre (131 x 47)
Interior
- Kitchen: Kitchen on main level
- Bedrooms: 3 bedrooms (1 on main level, 2 on upper level)
- Bathrooms: 1 full bath; 1 three-quarter bath
- Heating & cooling: Hot water heating; No central air
- Interior features: Main floor bedroom; Main floor laundry; Unfinished basement
- Laundry & utility: Laundry room in basement; Main floor laundry
Neighborhood map
What this means for you Summary
Snapshot
- This is a 3-bed/1.0-bath single-family listed at $210k.
Deal economics
- At list price, monthly cash flow is $48 ($576/yr) — positive.
- The deal already cash-flows at list — no discount required.
- To meet the 1% rule (rent ≥ 1% of price), the offer needs to be $172k (18.1% below list).
- Recommended offer: $172k (18.1% below list) — sets the bar for 1% rule.
- Cap rate 6.6% vs local median 3.6% in Red Wing — top-decile yield for the area; either an underpriced asset or a hidden risk that comps aren't pricing in. Stress-test before assuming the spread holds.
Location & tenants
- Location reads 81/100 on livability (#64 in MN, #1,570 nationally) — a professional / high-income tenant draw. Strengths: cost of living A+, housing A+, health & safety A+; Watch: amenities D.
- Red Wing Public School District (rural): math 36% / reading 44% proficiency, ranked #220 of 301 in MN (top 73%) — families likely to look elsewhere, expect single-tenant / working-renter base with shorter leases.
- Market conditions: 143 active listings in the ZIP; 5 comparable units currently listed for rent nearby; rentals lingering (median 44d on market — plan ~5-8 weeks vacancy on turnover, expect pricing pressure); 60% of comp listings sitting > 30 days — soft ceiling on asking rent; 86 units permitted in Goodhue County in 2024 (0 in 5+ unit buildings).
Forward outlook
- Local home prices are declining (-3.0%/yr); year-one equity from $1k of loan paydown is wiped out by about $6k of value loss. Plan a longer hold.
- Goodhue County population projected at -11% by 2050 — secular population decline; favor cash flow + early exit over multi-decade hold.
Negotiation context
- It's been on market 15 days — a 2% lower offer ($207k) is reasonable based on typical stale-listing flexibility.
- 5 sale attempts since 2y ago with the ask held roughly flat each time — persistent listings suggest the price (not the market) is what's stuck; bring a comps-based counter.
- Current owner paid $80k; list at $210k implies a 162% gain — meaningful room to come down on a strong offer.
Risks & watch-outs
- Watch-outs: built in 1880 — expect roof / HVAC / electrical / plumbing capex.
- Climate carrying-cost: moderate flood risk — expect insurance premiums to compound above CPI over the hold.
Questions for the listing agent
- Built in 1880 — when were the roof, HVAC, electrical panel, plumbing, and water heater last replaced?
- Is there a deadline driving the sale (1031 exchange, divorce, estate, relocation)? That informs how much negotiation room exists.
- The area grade is low — what's the realistic commute time and amenity access for the typical tenant pool here? Any planned neighborhood developments (good or bad) we should know about?
- What's the average days-on-market for RENTAL listings here right now (not sales)? A rising rental-DOM trend means longer vacancies and softer asking-rent achievability than the comps imply.
- What's the recent tenant-quality profile in this submarket — average credit score on applications, eviction rate, late-payment / NSF rate, and stable-employment percentage? A property-management company in the area should have these aggregated.
- How much new for-sale + rental construction is in the pipeline within 1–3 miles? Heavy new supply typically softens prices + rents 12–24 months out; constrained supply supports both.
Investment metrics
- 1% rule
- 0.82% ✗
- Cap rate
- 6.57%
- Cash-on-cash
- 0.98%
- DSCR
- 1.04
- GRM
- 10.2
CMA / ARV
- ARV (median comp)
- $245,617
- List price
- $209,900
- Delta
- -10.47%
- Verdict
- UNDERPRICED
- Comps
- 5 within 2.0 mi
Projected returns pro-forma
-3.0% appreciation · 3.0% rent growth · sell at horizon
- IRR
- -14.8%
- Equity multiple
- 0.47×
- Total profit
- $-31,015
- Equity at exit
- $31,297
- IRR
- -6.2%
- Equity multiple
- 0.60×
- Total profit
- $-23,315
- Equity at exit
- $18,148
Cash invested: $58,772 (down + closing). Projections, not guarantees.
Landlord ↔ Tenant lean methodology
- Overall (STATE)
- 46 Balanced
- State Minnesota
- 46 Balanced · D+2
- County
- — inherits STATE
- City
- — inherits STATE
ZIP-level market 55066
- Home prices YoY
- -28.1%
- Active inventory
- 143
- Price-to-rent
- 10.2×
Monthly cashflow live
- Estimated rent
- $1,718 high interval (Pro) →
- Mortgage (P&I)
- −$1,101
- Tax from tax record
- −$121 /mo · $1,456/yr
- Insurance
- −$87
- HOA
- −$0
- Vacancy / Maint / Mgmt
- −$361
- Net cashflow
- $48
Break-even live
Sensitivity live
| Price | -10% $167 | -5% $107 | +0% $48 | +5% $-11 | +10% $-71 |
|---|---|---|---|---|---|
| Rent | -10% $-88 | -5% $-20 | +0% $48 | +5% $116 | +10% $184 |
| Rate | -1.0pp $154 | -0.5pp $101 | base $48 | +0.5pp $-6 | +1.0pp $-62 |
UW: 25.0% down · 7.5% · 30yr · 1.5% tax · 5.0% vac · 8.0% maint · 8.0% mgmt
Financing live
Cash to close
- Down payment
- $52,475
- Closing costs
- $6,297
- Reserves months
- —
- Total cash needed
- —
Loan-product check · same deal, 3 products live
Conventional
25% down · 7.5% · 30yr
- Down + closing
- —
- Monthly P&I
- —
- Monthly cashflow
- —
- DSCR
- —
- Eligible?
- —
Personal DTI + credit; lowest rate.
DSCR
20% down · 8.5% · 30yr
- Down + closing
- —
- Monthly P&I
- —
- Monthly cashflow
- —
- DSCR
- —
- Eligible?
- —
No personal income docs; deal must DSCR.
Hard money
10% down · 12.0% · 12mo
- Down + closing
- —
- Monthly P&I
- —
- Monthly cashflow
- —
- DSCR
- —
- Eligible?
- —
Short-term bridge; refi at stabilization.
Rent comps 5 comps
| Address | Beds | Baths | Sqft | Rent | $/sqft | DOM | Units | Dist |
|---|---|---|---|---|---|---|---|---|
| 222 Bush St Unit 111 Red Wing, MN | 2.0 | 1.0 | 998 | $1,895 | $1.90 | 44d | 1 | 0.38mi |
| 222 Bush St Unit 12 Red Wing, MN | 2.0 | 1.0 | 1007 | $1,900 | $1.89 | 44d | 1 | 0.38mi |
| 222 Bush St Unit 115 Red Wing, MN | 2.0 | 1.0 | 948 | $1,800 | $1.90 | 44d | 1 | 0.38mi |
| 821 W 5th St Apt 5 Red Wing, MN | 2.0 | 1.0 | 950 | $1,300 | $1.37 | 0d | 1 | 0.66mi |
| 821 W 5th St Unit 2 Red Wing, MN | 2.0 | 1.0 | 950 | $1,150 | $1.21 | 13d | 1 | 0.66mi |
Listing history 27 events
-
2026-06-18days on market $209,900 Active 15 DOM
-
2026-06-17days on market $209,900 Active 14 DOM
-
2026-06-16days on market $209,900 Active 13 DOM
-
2026-06-15days on market $209,900 Active 12 DOM
-
2026-06-13days on market $209,900 Active 10 DOM
-
2026-06-09days on market $209,900 Active 6 DOM
-
2026-06-08days on market $209,900 Active 5 DOM
-
2026-06-07days on market $209,900 Active 4 DOM
-
2026-06-03pricedays on market $209,900 Active 1 DOM
-
2026-05-31days on market $219,900 Active 101 DOM
-
2026-04-22price $219,900 1078-char remark
-
2026-02-21price $227,900 1078-char remark
-
2026-02-19$229,900 Active 1078-char remark
-
2026-02-16historical
-
2025-11-19price $229,900
-
2025-10-30price $239,900
-
2025-10-16$244,400 Active
-
2025-08-28status Active
-
2025-08-28historical
-
2025-08-23historical
-
2025-08-22historical
-
2025-08-16historical
-
2025-03-05soldstatus $80,000
-
2025-02-28soldstatus $80,000 Sold
-
2024-12-20status Pending
-
2024-12-10$80,000 Active
-
1994-05-01soldstatus $33,000
ⓘ Source: listings_history table (triggers on properties + properties_extension) + one-shot
backfill from property_details.listing_events for pre-trigger history.
Tax reassessment forecast MN · Partial reset (capped growth)
- Current annual tax
- $1,456 · $121/mo
- Projected year-2 tax
- $1,903 · $159/mo
- Expected delta
- +$447/yr (+$37/mo · 30.7%)
ⓘ Screening estimate from a state-policy table — verify with the county assessor before closing.
Climate risk First Street
- Flood 5/10 Major FEMA zone X (unshaded) · 48% chance over 30 yrs
- Wildfire 2/10 Low
- Heat 2/10 Low 7 d/yr ≥100°F today · 15 d/yr by 30 yrs out
- Wind 2/10 Low
- Air quality 1/10 Low 0 unhealthy d/yr today · 0 by 30 yrs out
Nearby sold comps map
Loading sold comps map…
Walkable amenities ~0.75 mi
Loading nearby amenities…
Taxation est. · year 1
- Rental income
- $20,621
- − Mortgage interest
- −$11,758
- − Property taxes
- −$1,456
- − Insurance
- −$1,050
- − Repairs & maintenance
- −$1,650
- − Management
- −$1,650
- − Depreciation
- −$6,106
- Taxable loss
- −$3,048
- Est. tax savings @ 24.0%
- +$731
- After-tax cash flow
- $1,308/yr
For passive investors: Depreciation is non-cash, so a rental often shows a tax loss while cash-flowing — sheltering income. Rental losses are passive: they offset passive income freely, and up to $25,000/yr can offset ordinary (W-2) income if you actively participate and your MAGI is under $100k (phasing out to $0 by $150k); unused losses carry forward. On sale, claimed depreciation is recaptured at up to 25%, and gains may owe capital-gains tax (a 1031 exchange can defer both). Figures are a year-1 estimate at your 24.0% rate — not tax advice; consult a CPA.
Schools (NCES district)
- District
- Red Wing Public School District
- NCES district ID
- 2730480
- Math proficiency
- 36% ▼ -13.00%
- Reading proficiency
- 44% ▼ -11.00%
- Median HH income
- $53,206
- Composite
- 34.77/100
- National rank
- #5122
- State rank
- #220 of 301 in MN
Livability — Red Wing
- Score
- 81/100
- State rank
- #64
- US rank
- #1570
Category grades
Schools grade is shown separately in the Schools card above.
Census & demographics
- Census place
- Red Wing, MN
- County
- Goodhue County · 19,226 people
- City population
- 19,226
- Metro
- Red Wing, MN
- Population (ZIP)
- 19,226
- Household income
- $73,584
- Rent vs Own
- Severe rent burden
- 504.0
Population outlook (Goodhue County) Hauer SSP2
- Today (2025)
- 46,532 people
- By 2030
- 46,185 · -0.7%
- By 2040
- 44,531 · -4.3%
- By 2050
- 41,532 · -10.7%
- By 2075
- 33,745 · -27.5%
- By 2100
- 23,716 · -49.0%
Race, ethnicity, and origin ACS 2023
- Neighborhood character
- Predominantly White (87%)
- Race & ethnicity
- White 87% Hispanic / Latino 6% Two or more races 4% Black 3%
- Hispanic origin (detail)
- Mexican 3%
- Common ancestry
- Portuguese 14% Romanian 3% Scottish 2%
- Foreign-born
- 4% · Canada
- Languages at home
- 95% English-only · Spanish 4%
Political lean MEDSL · Goodhue
- 2024 margin
- R (+16.4) · D 40.8% · R 57.3% · Other 1.9%
- 2008→2024 swing
- -15.1pp toward R · 2008: -1.4pp · 2024: -16.4pp
- All cycles
- 2024: R+16.4 2020: R+14.8 2016: R+18.0 2012: R+3.0 2008: R+1.4
Not yet ingested
- Civics
- —
Market trends
- HPI YoY
- ▼ -97.16%
- Current HPI
- 247.9899
- Rent YoY
- —
- Metro
- Red Wing, MN
- State GDP YoY
- ▲ 2.41%
- F500 in state
- 34
Industry mix (Fortune 500 HQ in MN)
| Industry | F500 HQs | Revenue |
|---|---|---|
| Healthcare | 2 | $407B |
|
||
| Retail | 2 | $150B |
|
||
| Consumer Goods | 2 | $32B |
|
||
| Industrial Machinery | 2 | $6B |
|
||
| Agriculture | 1 | $40B |
|
||
| Healthcare / Medical Devices | 1 | $32B |
|
||
Price history
+536.1% since first listed19 events — show timeline
- 2026-06-03 Listed $209,900 NORTHSTARMLS as Distributed by MLS Grid
- 2026-06-01 Listing Removed — NORTHSTARMLS as Distributed by MLS Grid
- 2026-04-22 Price Changed $219,900 NORTHSTARMLS as Distributed by MLS Grid
- 2026-02-21 Price Changed $227,900 NORTHSTARMLS as Distributed by MLS Grid
- 2026-02-19 Listed $229,900 NORTHSTARMLS as Distributed by MLS Grid
- 2026-02-16 Listing Removed — NORTHSTARMLS as Distributed by MLS Grid
- 2025-11-19 Price Changed $229,900 NORTHSTARMLS as Distributed by MLS Grid
- 2025-10-30 Price Changed $239,900 NORTHSTARMLS as Distributed by MLS Grid
- 2025-10-16 Listed $244,400 NORTHSTARMLS as Distributed by MLS Grid
- 2025-08-28 Relisted — NORTHSTARMLS as Distributed by MLS Grid
- 2025-08-28 Listing Removed — NORTHSTARMLS as Distributed by MLS Grid
- 2025-08-23 Coming Soon — NORTHSTARMLS as Distributed by MLS Grid
- 2025-08-22 Listing Removed — NORTHSTARMLS as Distributed by MLS Grid
- 2025-08-16 Coming Soon — NORTHSTARMLS as Distributed by MLS Grid
- 2025-03-05 Sold (Public Records) $80,000 Public Records
- 2025-02-28 Sold (MLS) $80,000 NORTHSTARMLS as Distributed by MLS Grid
- 2024-12-20 Pending — NORTHSTARMLS as Distributed by MLS Grid
- 2024-12-10 Listed $80,000 NORTHSTARMLS as Distributed by MLS Grid
- 1994-05-01 Sold (Public Records) $33,000 Public Records
Property tax history
+5.0%/yrLatest (2025): $1,456 · -80.5% YoY. Source: county tax records.
Cash-flow waterfall
monthlySold comps — $/sqft
last 12 mo · ≤1 miLoading sold comps…