 Multi-family
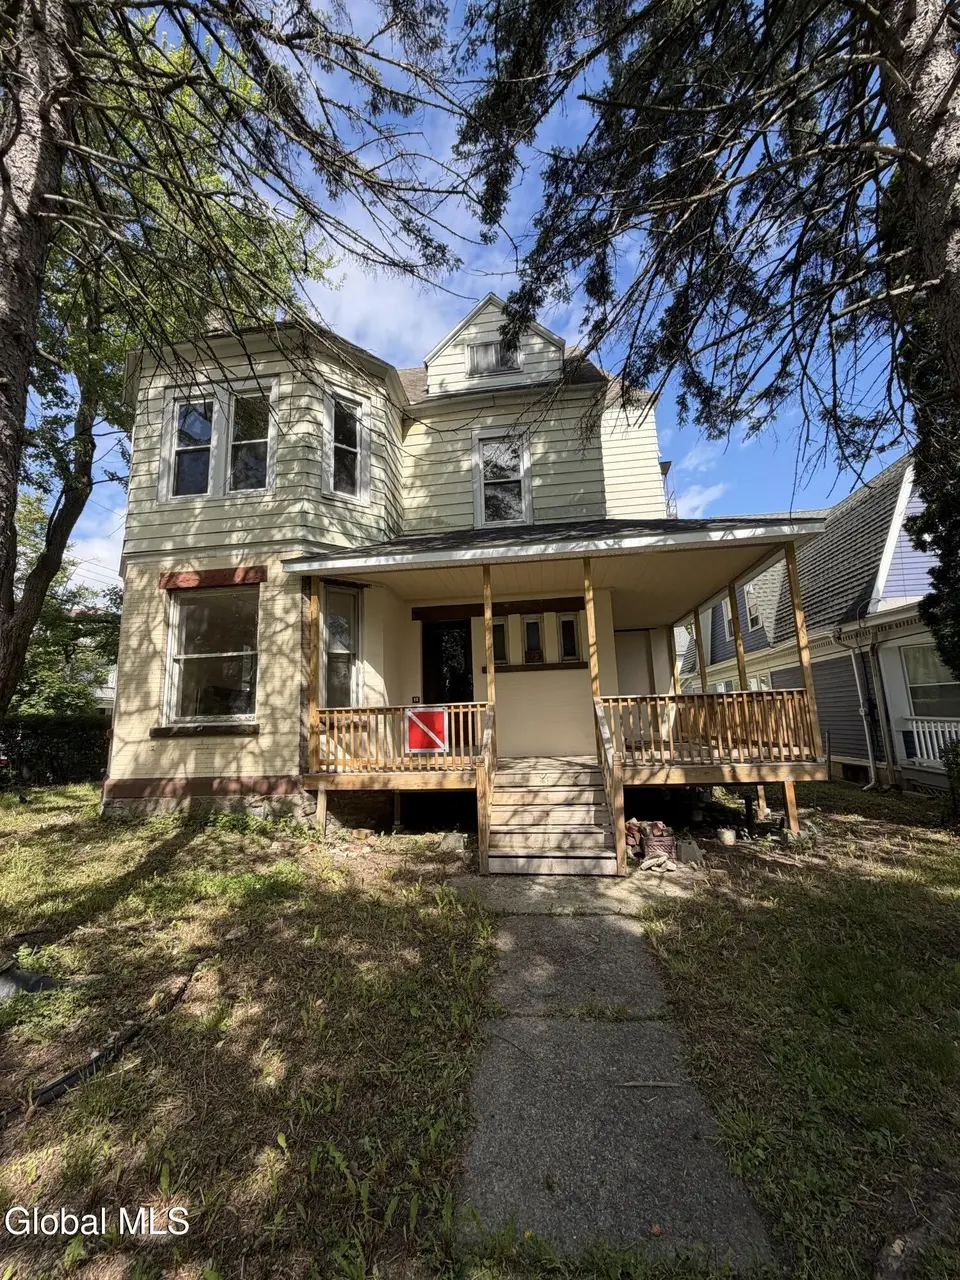
103 Delaware Ave · Albany, NY
Flood risk 1/10 · Minimal
- FEMA flood zone
- X (unshaded)
- Chance of flooding over 30 yrs
- 0.0%
- Est. flood insurance / yr
- $473 – $860
Fire risk 3/10 · Minor
- Est. fire insurance / yr
- $691 – $1,283
Heat risk 4/10 · Minor
- Hot days now (above 99°F)
- 7 days/yr
- Hot days in 30 yrs
- 16 days/yr
Wind risk 3/10 · Minor
- Chance of severe wind over 30 yrs
- 6.0%
Air-quality risk 1/10 · Minimal
- Unhealthy air days now
- 0 days/yr
- Unhealthy air days in 30 yrs
- 0 days/yr
Risk factors via First Street. Map © Google.
Why this score? — see what drove the A grade
The composite is a weighted blend of 9 inputs, each scored 0–100. Each bar is that input's sub-score; the figure is the points it added to the 100-point composite (weight × sub-score).
- Cash flow +30.0/30.0
- ARV discount +15.0/15.0
- 1% rule +10.0/10.0
- DSCR +10.0/10.0
- Appreciation +10.0/10.0
- Rent growth +4.7/5.0
- Livability +4.0/5.0
- Schools +3.2/10.0
- Condition / age +2.5/5.0
$250,000
🖨 Deal sheet 📄 Offer letter ✓ Due diligence
Multi-family units
County records classify this as Multi-Family (2-4 Unit). Listing-text estimate: 1 unit. estimate disagrees with records
Listing remarks MLS
Spacious Victorian - being sold occupied by lender . Could be a savvy inestement! There is NO ACCESS to this property and is being sold occupied. DO NOT go on the property under any circumstances.
Key facts
- Three unit property
- Access to schools
- Access to services
Tags
Property features AI
Finance
- Financial info: Property is a 3-unit multifamily (triplex); Tenant responsibilities include hot water and other tenant-paid items; owner pays other specified items
Exterior
- Parking: Driveway with space for 2 vehicles
- Utilities: Public water; Public sewer
- Home design: Triplex; Combination foundation; Aluminum siding; Asphalt roof
- Construction: Aluminum siding construction; Combination foundation; Asphalt roof
- Exterior features: Pressure-treated deck; Porch; Chain link fencing; Lot features: other
Interior
- Bedrooms: Unit 1: 3 bedrooms; Unit 2: 3 bedrooms; Unit 3: 1 bedroom
- Flooring: Wood flooring
- Bathrooms: 3 full bathrooms total; Full bathrooms located on 1st and 2nd levels
- Heating & cooling: Baseboard heating; Heating present
- Interior features: Wood flooring; Fireplace (other type); Basement (other)
- Laundry & utility: Tenants pay hot water; Owner pays other utilities
Neighborhood map
What this means for you Summary
Snapshot
- This is a 8-bed/3.0-bath multifamily listed at $250k.
Deal economics
- At list price, monthly cash flow is $2k ($25k/yr) — positive.
- The deal already cash-flows at list — no discount required.
- Meets the 1% rule at list price ($5k rent vs $250k).
- Recommended offer: $246k (1.5% below list) — sets the bar for market timing.
Location & tenants
- Location reads 79/100 on livability (#129 in NY, #2,083 nationally) — a middle-class / working-renter tenant base. Strengths: amenities A+, commute A+, housing A+; Watch: employment C-, crime F.
- Albany City School District (urban): math 37% / reading 40% proficiency, ranked #543 of 590 in NY (top 92%) — families likely to look elsewhere, expect single-tenant / working-renter base with shorter leases; 66% free/reduced lunch — lower-income household profile, screen leases tightly.
- Zoned schools: Albany High School (math 74% / reading 67%, grade B+, #710 of 1,100 statewide, top 65%, 2,676 students, 69% FRL) — zoned schools at 69% FRL track the district average.
- Zoned-school proficiency averages 70% at this address vs 38% district-wide (+32 pts) — the actual schools serving this property are materially stronger than the Albany City School District average implies; a family-tenant draw the district grade alone would hide.
- Market conditions: Rents rising fast (+8.7%/yr); 58 active listings in the ZIP; 675 units permitted in Albany County in 2024 (451 in 5+ unit buildings).
Forward outlook
- In year one you build about $27k of equity ($2k loan paydown + $25k appreciation (10.0% local appreciation)).
- Albany County population projected at +9% by 2050 — modest demand growth; plan on rents tracking national, not racing it.
- At projected returns (10.0% appreciation + 8.0% rent growth), your $70k cash investment doubles in ~2 years — after that, you're playing with house money.
- By year 2, paydown + projected appreciation supports a ~$43k cash-out refi (75% LTV) — recoverable capital for the next deal without selling this one.
Negotiation context
- It's been on market 16 days — a 2% lower offer ($246k) is reasonable based on typical stale-listing flexibility.
- 3 sale attempts since 27y ago with the ask held roughly flat each time — persistent listings suggest the price (not the market) is what's stuck; bring a comps-based counter.
- Current owner paid $165k; list at $250k implies a 52% gain — meaningful room to come down on a strong offer.
Risks & watch-outs
- Watch-outs: property tax is 2.7% of price; built in 1890 — expect roof / HVAC / electrical / plumbing capex.
Questions for the listing agent
- Built in 1890 — when were the roof, HVAC, electrical panel, plumbing, and water heater last replaced?
- Property tax is high relative to price — has the assessment been appealed recently, and will the sale trigger a re-assessment?
- Is there a deadline driving the sale (1031 exchange, divorce, estate, relocation)? That informs how much negotiation room exists.
- Crime grade is F in this area — have there been break-ins, vandalism, or insurance claims at this property in the last 3 years? What carrier currently insures it and at what premium?
- What's the average days-on-market for RENTAL listings here right now (not sales)? A rising rental-DOM trend means longer vacancies and softer asking-rent achievability than the comps imply.
- What's the recent tenant-quality profile in this submarket — average credit score on applications, eviction rate, late-payment / NSF rate, and stable-employment percentage? A property-management company in the area should have these aggregated.
- How much new apartment / multifamily construction is in the pipeline within 1–3 miles? Heavy new supply (>2% of stock underway) typically softens rents 12–24 months out; light construction supports rent growth.
Investment metrics
- 1% rule
- 2.08% ✓
- Cap rate
- 16.46%
- Cash-on-cash
- 36.32%
- DSCR
- 2.62
- GRM
- 4.0
CMA / ARV
- ARV (on-the-fly)
- $396,405
- Comps found
- 8
Show comp detail 8 sales within ~0.75 mi
| Address | Dist | Beds/Ba | Sqft | Sold | Price | $/sf | Match |
|---|---|---|---|---|---|---|---|
| 89 Delaware Ave | 0.06mi | 8/4.0 | 3,510 (+2%) | 15mo | $385,000 | $110 | 78 |
| 292 Catherine St | 0.19mi | 9/4.0 (+1) | 3,200 (-7%) | 1mo | $404,250 | $126 | 70 |
| 224 Delaware Ave | 0.28mi | 7/4.0 (-1) | 3,196 (-7%) | 10mo | $300,000 | $94 | 57 |
| 44 Park Ave | 0.55mi | 9/3.0 (+1) | 3,316 (-4%) | 8mo | $382,000 | $115 | 57 |
| 167 2nd Ave | 0.56mi | 8/3.0 | 3,375 (-2%) | 18mo | $370,000 | $110 | 55 |
| 184 S Swan St | 0.29mi | 8/3.0 | 3,132 (-9%) | 22mo | $417,000 | $133 | 53 |
| 248 Morris St | 0.68mi | 7/3.0 (-1) | 3,048 (-12%) | 3mo | $359,000 | $118 | 42 |
| 11 Trinity Pl | 0.74mi | 8/3.0 | 3,744 (+9%) | 17mo | $225,000 | $60 | 37 |
Match score weights: distance 35% · size 25% · config 20% · recency 20%. Top-matched comps best support the ARV.
Projected returns pro-forma
10.0% appreciation · 8.0% rent growth · sell at horizon
- IRR
- 55.8%
- Equity multiple
- 5.27×
- Total profit
- $298,760
- Equity at exit
- $225,220
- IRR
- 51.6%
- Equity multiple
- 13.03×
- Total profit
- $842,097
- Equity at exit
- $485,695
Cash invested: $70,000 (down + closing). Projections, not guarantees.
Landlord ↔ Tenant lean methodology
- Overall (STATE)
- 15 Strongly Tenant-Friendly
- State New York
- 15 Strongly Tenant-Friendly · D+10
- County
- — inherits STATE
- City
- — inherits STATE
ZIP-level market 12202
- Home prices YoY
- 14.3%
- Rents YoY
- 8.7%
- Active inventory
- 58
- Price-to-rent
- 11.5×
Monthly cashflow live
- Estimated rent
- $5,190 high interval (Pro) →
- Mortgage (P&I)
- −$1,311
- Tax from tax record
- −$566 /mo · $6,794/yr
- Insurance
- −$104
- HOA
- −$0
- Vacancy / Maint / Mgmt
- −$1,090
- Net cashflow
- $2,119
Break-even live
3-unit breakdown (identical units grouped — click to expand)
| Units | Beds | Baths | Est. rent |
|---|---|---|---|
| 2× units | 3 | 1 | $3,622 |
| #1 | 3 | 1 | $1,811 |
| #2 | 3 | 1 | $1,811 |
| 1× unit | 1 | 1 | $1,568 |
| Total (3 units) | $5,190 | ||
UW: 25.0% down · 7.5% · 30yr · 1.5% tax · 5.0% vac · 8.0% maint · 8.0% mgmt
Financing live
Cash to close
- Down payment
- $62,500
- Closing costs
- $7,500
- Reserves months
- —
- Total cash needed
- —
Loan-product check · same deal, 3 products live
Conventional
25% down · 7.5% · 30yr
- Down + closing
- —
- Monthly P&I
- —
- Monthly cashflow
- —
- DSCR
- —
- Eligible?
- —
Personal DTI + credit; lowest rate.
DSCR
20% down · 8.5% · 30yr
- Down + closing
- —
- Monthly P&I
- —
- Monthly cashflow
- —
- DSCR
- —
- Eligible?
- —
No personal income docs; deal must DSCR.
Hard money
10% down · 12.0% · 12mo
- Down + closing
- —
- Monthly P&I
- —
- Monthly cashflow
- —
- DSCR
- —
- Eligible?
- —
Short-term bridge; refi at stabilization.
Listing history 10 events
-
2026-06-18days on market $250,000 Active 16 DOM
-
2026-06-17days on market $250,000 Active 15 DOM
-
2026-06-16days on market $250,000 Active 14 DOM
-
2026-06-15days on market $250,000 Active 13 DOM
-
2026-06-14days on market $250,000 Active 11 DOM
-
2026-06-10days on market $250,000 Active 8 DOM
-
2026-06-08days on market $250,000 Active 6 DOM
-
2026-06-07days on market $250,000 Active 5 DOM
-
2026-06-03remarks 326-char remark
-
2026-06-03$250,000 Active 1 DOM
ⓘ Source: listings_history table (triggers on properties + properties_extension) + one-shot
backfill from property_details.listing_events for pre-trigger history.
Tax reassessment forecast NY · Partial reset (capped growth)
- Current annual tax
- $6,794 · $566/mo
- Projected year-2 tax
- $6,794 · $566/mo
- Expected delta
- $0/yr ($0/mo · 0.0%)
ⓘ Screening estimate from a state-policy table — verify with the county assessor before closing.
Climate risk First Street
- Flood 1/10 Low FEMA zone X (unshaded) · 0% chance over 30 yrs
- Wildfire 3/10 Moderate
- Heat 4/10 Moderate 7 d/yr ≥99°F today · 16 d/yr by 30 yrs out
- Wind 3/10 Moderate 6% chance of damaging wind over 30 yrs
- Air quality 1/10 Low 0 unhealthy d/yr today · 0 by 30 yrs out
Nearby sold comps map
Loading sold comps map…
Walkable amenities ~0.75 mi
Loading nearby amenities…
Taxation est. · year 1
- Rental income
- $62,280
- − Mortgage interest
- −$14,004
- − Property taxes
- −$6,794
- − Insurance
- −$1,250
- − Repairs & maintenance
- −$4,982
- − Management
- −$4,982
- − Depreciation
- −$7,273
- Taxable income
- $22,994
- Est. tax owed @ 24.0%
- −$5,519
- After-tax cash flow
- $19,906/yr
For passive investors: Depreciation is non-cash, so a rental often shows a tax loss while cash-flowing — sheltering income. Rental losses are passive: they offset passive income freely, and up to $25,000/yr can offset ordinary (W-2) income if you actively participate and your MAGI is under $100k (phasing out to $0 by $150k); unused losses carry forward. On sale, claimed depreciation is recaptured at up to 25%, and gains may owe capital-gains tax (a 1031 exchange can defer both). Figures are a year-1 estimate at your 24.0% rate — not tax advice; consult a CPA.
Schools (NCES district)
- District
- Albany City School District
- NCES district ID
- 3602460
- Math proficiency
- 37% ▲ 6.00%
- Reading proficiency
- 40% ▲ 7.00%
- Median HH income
- $40,568
- Composite
- 32.34/100
- National rank
- #5744
- State rank
- #543 of 590 in NY
Livability — Albany
- Score
- 79/100
- State rank
- #129
- US rank
- #2083
Category grades
Schools grade is shown separately in the Schools card above.
Census & demographics
- Census place
- Albany, NY
- County
- Albany County · 196,626 people
- City population
- 116,921
- Metro
- Albany-Schenectady-Troy, NY
- Population (ZIP)
- 10,166
- Household income
- $52,868
- Rent vs Own
- Severe rent burden
- 935.0
Population outlook (Albany County) Hauer SSP2
- Today (2025)
- 320,794 people
- By 2030
- 327,401 · +2.1%
- By 2040
- 338,218 · +5.4%
- By 2050
- 348,467 · +8.6%
- By 2075
- 381,693 · +19.0%
- By 2100
- 393,809 · +22.8%
Race, ethnicity, and origin ACS 2023
- Neighborhood character
- Highly diverse neighborhood (Simpson 0.73)
- Race & ethnicity
- Black 40% White 28% Hispanic / Latino 15% Two or more races 14% Asian 7%
- Hispanic origin (detail)
- Mexican 3% Puerto Rican 5% Dominican 5%
- Common ancestry
- Iranian 2% Romanian 1% Serbian 1%
- Foreign-born
- 14% · Canada, Philippines, China
- Languages at home
- 80% English-only · Spanish 10% Other Asian/Pacific 4% Arabic 1%
Political lean MEDSL · Albany
- 2024 margin
- Strong D (+25.8) · D 62.9% · R 37.1%
- 2008→2024 swing
- -3.6pp toward R · 2008: 29.4pp · 2024: 25.8pp
- All cycles
- 2024: D+25.8 2020: D+31.4 2016: D+24.3 2012: D+31.0 2008: D+29.4
Not yet ingested
- Civics
- —
Market trends
- HPI YoY
- ▲ 38.05%
- Current HPI
- 303.8939
- Rent YoY
- ▲ 8.70%
- Metro
- Albany-Schenectady-Troy, NY
- State GDP YoY
- ▲ 2.60%
- F500 in state
- 92
Industry mix (Fortune 500 HQ in NY)
| Industry | F500 HQs | Revenue |
|---|---|---|
| Financial Services | 10 | $950B |
|
||
| Consumer Goods | 9 | $162B |
|
||
| Insurance | 4 | $225B |
|
||
| Telecommunications | 2 | $144B |
|
||
| Pharmaceuticals | 2 | $112B |
|
||
| Media / Entertainment | 2 | $69B |
|
||
Price history
+119.5% since first listed9 events — show timeline
- 2026-06-02 Listed $250,000 Global MLS
- 2023-06-09 Sold (MLS) $165,000 Global MLS
- 2023-03-29 Pending — Global MLS
- 2023-03-18 Pending — Global MLS
- 2023-02-22 Listed $169,900 Global MLS
- 2000-02-16 Sold (MLS) $90,000 Global MLS
- 2000-02-11 Sold (Public Records) $90,000 Public Records
- 1999-12-04 Listing Removed — Global MLS
- 1999-08-24 Listed $113,900 Global MLS
Property tax history
+0.1%/yrLatest (2025): $6,794 · -21.4% YoY. Source: county tax records.
Cash-flow waterfall
monthlySold comps — $/sqft
last 12 mo · ≤1 miLoading sold comps…