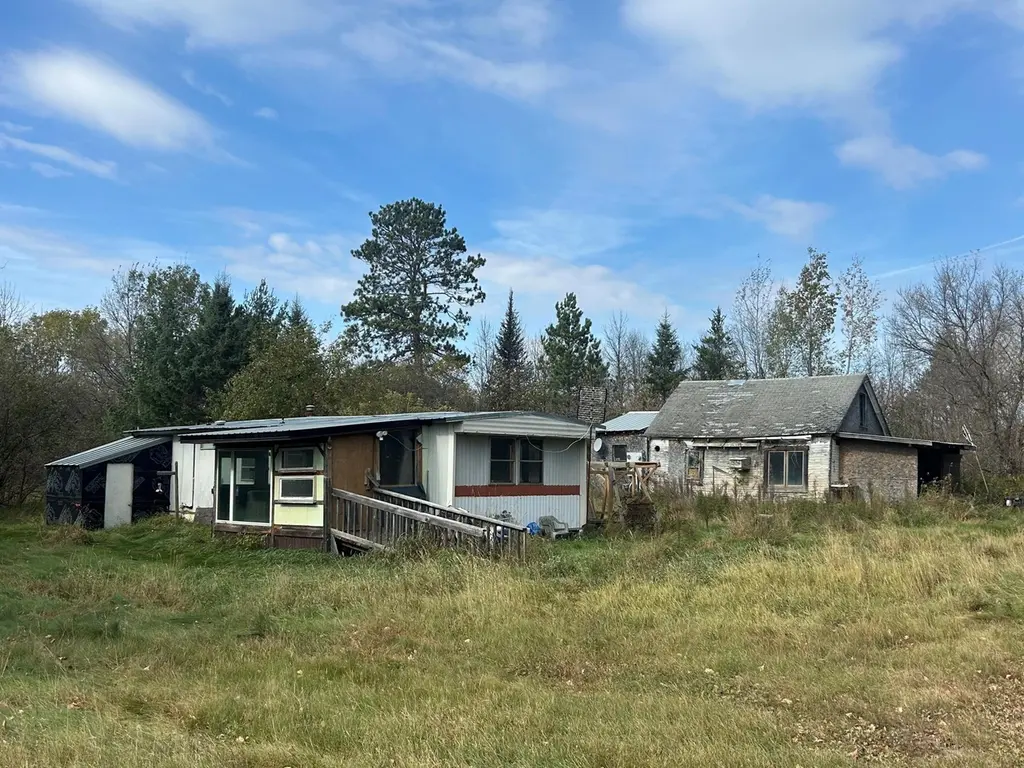
27462 Raven Rd · Guthrie, MN
Flood risk 1/10 · Minimal
- FEMA flood zone
- —
- Chance of flooding over 30 yrs
- 0.0%
- Est. flood insurance / yr
- —
Fire risk 4/10 · Minor
- Est. fire insurance / yr
- $888 – $1,650
Heat risk 1/10 · Minimal
- Hot days now (above 93°F)
- 7 days/yr
- Hot days in 30 yrs
- 12 days/yr
Wind risk 1/10 · Minimal
- Chance of severe wind over 30 yrs
- —
Air-quality risk 2/10 · Minimal
- Unhealthy air days now
- 2 days/yr
- Unhealthy air days in 30 yrs
- 2 days/yr
Risk factors via First Street. Map © Google.
Why this score? — see what drove the B+ grade
The composite is a weighted blend of 9 inputs, each scored 0–100. Each bar is that input's sub-score; the figure is the points it added to the 100-point composite (weight × sub-score).
- Cash flow +30.0/30.0
- 1% rule +10.0/10.0
- DSCR +10.0/10.0
- Appreciation +10.0/10.0
- ARV discount +7.5/15.0
- Schools +3.9/10.0
- Rent growth +2.5/5.0
- Livability +2.5/5.0
- Condition / age +2.5/5.0
$33,000
🖨 Deal sheet (PDF) 📄 Offer letter ✓ Due diligence
Listing remarks
Sitting on a private . 72 acre lot at 27462 Raven Rd, this property offers an excellent opportunity for the right buyer or investor. The lot includes a 47’ x 14’ trailer home that is currently uninhabitable and being sold as-is, likely best suited for removal or full renovation. The detached garage is also being sold as-is and contains various tools and parts that will remain with the property. Utilities, including septic and water, are already in place, providing a solid foundation for future development or a new home build. This is a fixer-upper property with potential, ideal for someone looking to start fresh or invest in a rebuild on a private, established lot.
Key facts
- Private lot
- Utilities in place
- Detached garage
Tags
Property features AI
Finance
- Other: Lot approximately 0.72 acres (dimensions about 180 x 180)
Exterior
- Parking: Open parking
- Utilities: Other water source; Other sewer; Other fuel
- Home design: Residential manufactured home; One story; Main living area on a single level; Facing direction not specified
- Construction: Built on other foundation type
- Exterior features: Other exterior features
Interior
- Bedrooms: 2 bedrooms
- Bathrooms: 1 full bathroom
- Heating & cooling: No heating; No cooling
- Interior features: No basement; Single-level living
Neighborhood map
What this means for you Summary
Snapshot
- This is a 2-bed/1.0-bath manufactured listed at $33k.
Deal economics
- At list price, monthly cash flow is $433 ($5k/yr) — positive.
- The deal already cash-flows at list — no discount required.
- Meets the 1% rule at list price ($823 rent vs $33k).
- Recommended offer: $33k (1.5% below list) — sets the bar for market timing.
Location & tenants
- Location reads: area grade B — affects rentability + tenant quality, not the cash-flow math above.
- Bemidji Public School District (rural): math 42% / reading 50% proficiency, ranked #173 of 301 in MN (top 58%) — families likely to look elsewhere, expect single-tenant / working-renter base with shorter leases.
- Zoned schools: Horace May Elementary (math 47% / reading 32%, grade F, #604 of 857 statewide, top 74%, 316 students, 45% FRL); Bemidji Middle (math 37% / reading 46%, grade F, #138 of 258 statewide, top 55%, 1,013 students, 48% FRL); Bemidji Senior High (math 47% / reading 67%, grade C, #64 of 471 statewide, top 16%, 1,432 students, 38% FRL) — zoned schools at 44% FRL track the district average.
- Market conditions: 55 active listings in the ZIP; 27 units permitted in Hubbard County in 2024 (0 in 5+ unit buildings).
Forward outlook
- In year one you build about $4k of equity ($228 loan paydown + $3k appreciation (10.0% local appreciation)).
- Hubbard County population projected at -12% by 2050 — secular population decline; favor cash flow + early exit over multi-decade hold.
- At projected returns (10.0% appreciation + 3.0% rent growth), your $9k cash investment doubles in ~2 years — after that, you're playing with house money.
- By year 8, paydown + projected appreciation supports a ~$31k cash-out refi (75% LTV) — recoverable capital for the next deal without selling this one.
Negotiation context
- It's been on market 24 days — a 2% lower offer ($33k) is reasonable based on typical stale-listing flexibility.
- 2 sale attempts with the ask held roughly flat each time — persistent listings suggest the price (not the market) is what's stuck; bring a comps-based counter.
Questions for the listing agent
- Built in 1975 — when were the roof, HVAC, electrical panel, plumbing, and water heater last replaced?
- Is there a deadline driving the sale (1031 exchange, divorce, estate, relocation)? That informs how much negotiation room exists.
- What's the average days-on-market for RENTAL listings here right now (not sales)? A rising rental-DOM trend means longer vacancies and softer asking-rent achievability than the comps imply.
- What's the recent tenant-quality profile in this submarket — average credit score on applications, eviction rate, late-payment / NSF rate, and stable-employment percentage? A property-management company in the area should have these aggregated.
- How much new for-sale + rental construction is in the pipeline within 1–3 miles? Heavy new supply typically softens prices + rents 12–24 months out; constrained supply supports both.
Investment metrics
- 1% rule
- 2.49% ✓
- Cap rate
- 22.03%
- Cash-on-cash
- 56.19%
- DSCR
- 3.50
- GRM
- 3.3
CMA / ARV
No comps found within radius.
Projected returns pro-forma
10.0% appreciation · 3.0% rent growth · sell at horizon
- IRR
- 68.9%
- Equity multiple
- 5.93×
- Total profit
- $45,534
- Equity at exit
- $29,729
- IRR
- 62.6%
- Equity multiple
- 13.17×
- Total profit
- $112,433
- Equity at exit
- $64,112
Cash invested: $9,240 (down + closing). Projections, not guarantees.
Landlord ↔ Tenant lean methodology
- Overall (STATE)
- 46 Balanced
- State Minnesota
- 46 Balanced · D+2
- County
- — inherits STATE
- City
- — inherits STATE
ZIP-level market 56461
- Home prices YoY
- 18.2%
- Active inventory
- 55
- Price-to-rent
- 3.3×
Monthly cashflow live
- Estimated rent
- $823 medium interval (Pro) →
- Mortgage (P&I)
- −$173
- Tax from tax record
- −$30 /mo · $366/yr
- Insurance
- −$14
- HOA
- −$0
- Vacancy / Maint / Mgmt
- −$173
- Net cashflow
- $433
Break-even live
Sensitivity live
| Price | -10% $451 | -5% $442 | +0% $433 | +5% $423 | +10% $414 |
|---|---|---|---|---|---|
| Rent | -10% $368 | -5% $400 | +0% $433 | +5% $465 | +10% $498 |
| Rate | -1.0pp $449 | -0.5pp $441 | base $433 | +0.5pp $424 | +1.0pp $415 |
UW: 25.0% down · 7.5% · 30yr · 1.5% tax · 5.0% vac · 8.0% maint · 8.0% mgmt
Financing live
Cash to close
- Down payment
- $8,250
- Closing costs
- $990
- Reserves months
- —
- Total cash needed
- —
Loan-product check · same deal, 3 products live
Conventional
25% down · 7.5% · 30yr
- Down + closing
- —
- Monthly P&I
- —
- Monthly cashflow
- —
- DSCR
- —
- Eligible?
- —
Personal DTI + credit; lowest rate.
DSCR
20% down · 8.5% · 30yr
- Down + closing
- —
- Monthly P&I
- —
- Monthly cashflow
- —
- DSCR
- —
- Eligible?
- —
No personal income docs; deal must DSCR.
Hard money
10% down · 12.0% · 12mo
- Down + closing
- —
- Monthly P&I
- —
- Monthly cashflow
- —
- DSCR
- —
- Eligible?
- —
Short-term bridge; refi at stabilization.
Listing history 19 events
-
2026-06-22days on market $33,000 Active 24 DOM
-
2026-06-21days on market $33,000 Active 23 DOM
-
2026-06-19days on market $33,000 Active 21 DOM
-
2026-06-18days on market $33,000 Active 20 DOM
-
2026-06-17days on market $33,000 Active 19 DOM
-
2026-06-16days on market $33,000 Active 18 DOM
-
2026-06-15days on market $33,000 Active 17 DOM
-
2026-06-14days on market $33,000 Active 15 DOM
-
2026-06-12days on market $33,000 Active 14 DOM
-
2026-06-09days on market $33,000 Active 11 DOM
-
2026-06-08days on market $33,000 Active 10 DOM
-
2026-06-07days on market $33,000 Active 9 DOM
-
2026-06-05days on market $33,000 Active 6 DOM
-
2026-06-02days on market $33,000 Active 4 DOM
-
2026-06-01days on market $33,000 Active 3 DOM
-
2026-05-31days on market $33,000 Active 2 DOM
-
2026-05-28$33,000 Active
-
2026-05-01historical
-
2025-10-09$33,000 Active
ⓘ Source: listings_history table (triggers on properties + properties_extension) + one-shot
backfill from property_details.listing_events for pre-trigger history.
Tax reassessment forecast MN · Partial reset (capped growth)
- Current annual tax
- $366 · $30/mo
- Projected year-2 tax
- $368 · $31/mo
- Expected delta
- +$2/yr ($0/mo · 0.5%)
ⓘ Screening estimate from a state-policy table — verify with the county assessor before closing.
Climate risk First Street
- Flood 1/10 Low 0% chance over 30 yrs
- Wildfire 4/10 Moderate
- Heat 1/10 Low 7 d/yr ≥93°F today · 12 d/yr by 30 yrs out
- Wind 1/10 Low
- Air quality 2/10 Low 2 unhealthy d/yr today · 2 by 30 yrs out
Nearby sold comps map
Loading sold comps map…
Walkable amenities ~0.75 mi
Loading nearby amenities…
Taxation est. · year 1
- Rental income
- $9,873
- − Mortgage interest
- −$1,849
- − Property taxes
- −$366
- − Insurance
- −$165
- − Repairs & maintenance
- −$790
- − Management
- −$790
- − Depreciation
- −$960
- Taxable income
- $4,954
- Est. tax owed @ 24.0%
- −$1,189
- After-tax cash flow
- $4,003/yr
For passive investors: Depreciation is non-cash, so a rental often shows a tax loss while cash-flowing — sheltering income. Rental losses are passive: they offset passive income freely, and up to $25,000/yr can offset ordinary (W-2) income if you actively participate and your MAGI is under $100k (phasing out to $0 by $150k); unused losses carry forward. On sale, claimed depreciation is recaptured at up to 25%, and gains may owe capital-gains tax (a 1031 exchange can defer both). Figures are a year-1 estimate at your 24.0% rate — not tax advice; consult a CPA.
Schools (NCES district)
- District
- Bemidji Public School District
- NCES district ID
- 2704440
- Math proficiency
- 42% ▼ -9.00%
- Reading proficiency
- 50% ▼ -5.00%
- Median HH income
- $47,735
- Composite
- 39.22/100
- National rank
- #4013
- State rank
- #173 of 301 in MN
Livability — Guthrie
No livability data for this city. (Only ~50 U.S. cities are tracked.)
Census & demographics
- Population (ZIP)
- 3,316
Population outlook (Hubbard County) Hauer SSP2
- Today (2025)
- 20,512 people
- By 2030
- 20,275 · -1.2%
- By 2040
- 19,429 · -5.3%
- By 2050
- 18,093 · -11.8%
- By 2075
- 14,903 · -27.3%
- By 2100
- 10,994 · -46.4%
Race, ethnicity, and origin ACS 2023
- Neighborhood character
- Predominantly White (88%)
- Race & ethnicity
- White 88% Two or more races 7% Hispanic / Latino 5% Native American 2%
- Common ancestry
- Portuguese 17% Lithuanian 5% Romanian 3%
- Foreign-born
- 1% · Canada
- Languages at home
- 97% English-only · Spanish 1% German/W. Germanic 1%
Political lean MEDSL · Hubbard
- 2024 margin
- Solid R (+31.5) · D 33.4% · R 64.9% · Other 1.7%
- 2008→2024 swing
- -17.0pp toward R · 2008: -14.5pp · 2024: -31.5pp
- All cycles
- 2024: R+31.5 2020: R+28.8 2016: R+33.6 2012: R+16.9 2008: R+14.5
Not yet ingested
- Civics
- —
Market trends
- HPI YoY
- ▲ 44.15%
- Current HPI
- 287.2417
- Rent YoY
- —
- Metro
- —
- State GDP YoY
- ▲ 2.41%
- F500 in state
- 34
Industry mix (Fortune 500 HQ in MN)
| Industry | F500 HQs | Revenue |
|---|---|---|
| Healthcare | 2 | $407B |
|
||
| Retail | 2 | $150B |
|
||
| Consumer Goods | 2 | $32B |
|
||
| Industrial Machinery | 2 | $6B |
|
||
| Agriculture | 1 | $40B |
|
||
| Healthcare / Medical Devices | 1 | $32B |
|
||
Price history
+0.0% since first listed3 events — show timeline
- 2026-05-28 Listed $33,000 NORTHSTARMLS as Distributed by MLS Grid
- 2026-05-01 Listing Removed — NORTHSTARMLS as Distributed by MLS Grid
- 2025-10-09 Listed $33,000 NORTHSTARMLS as Distributed by MLS Grid
Property tax history
+2.8%/yrLatest (2025): $366 · +10.9% YoY. Source: county tax records.
Cash-flow waterfall
monthlySold comps — $/sqft
last 12 mo · ≤1 miLoading sold comps…