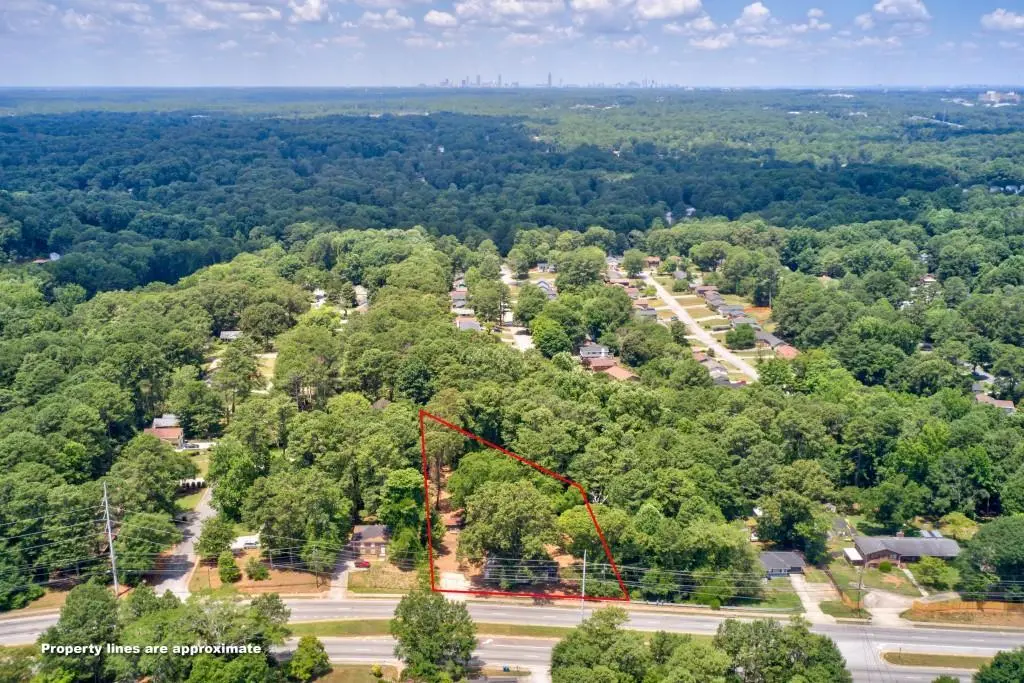
1491 S Hairston Rd · Redan, GA
Flood risk No data
- FEMA flood zone
- —
- Chance of flooding over 30 yrs
- —
- Est. flood insurance / yr
- —
Fire risk No data
- Est. fire insurance / yr
- —
Heat risk No data
- Hot days now (above threshold)
- —
- Hot days in 30 yrs
- —
Wind risk No data
- Chance of severe wind over 30 yrs
- —
Air-quality risk No data
- Unhealthy air days now
- —
- Unhealthy air days in 30 yrs
- —
Risk factors via First Street. Map © Google.
Why this score? — see what drove the C+ grade
The composite is a weighted blend of 9 inputs, each scored 0–100. Each bar is that input's sub-score; the figure is the points it added to the 100-point composite (weight × sub-score).
- Cash flow +22.1/30.0
- ARV discount +15.0/15.0
- DSCR +7.1/10.0
- 1% rule +5.5/10.0
- Rent growth +3.4/5.0
- Livability +3.2/5.0
- Condition / age +2.5/5.0
- Schools +2.1/10.0
- Appreciation +0.0/10.0
$159,000
🖨 Deal sheet (PDF) 📄 Offer letter ✓ Due diligence
Listing remarks
There is a shell of a house on the property. The property has gas, electric, and public water/sewer already running to the lot. Can be subdivided. Homes are selling between $300-350k for resales in the area, new construction could sell for more. Zoned residential R3. Three miles to Indian Creek Marta Station.
Key facts
- Can be subdivided
- Zoned residential r3
- 1.4 acre lot
Tags
Neighborhood map
What this means for you Summary
Snapshot
- This is a 2-bed/1.0-bath single-family listed at $159k.
Deal economics
- At list price, monthly cash flow is $255 ($3k/yr) — positive.
- The deal already cash-flows at list — no discount required.
- Meets the 1% rule at list price ($2k rent vs $159k).
- Recommended offer: $140k (12.0% below list) — sets the bar for market timing.
- Cap rate 8.2% vs local median 5.3% in Redan — top-decile yield for the area; either an underpriced asset or a hidden risk that comps aren't pricing in. Stress-test before assuming the spread holds.
Location & tenants
- Location reads 64/100 on livability (#274 in GA) — a middle-class / working-renter tenant base. Strengths: cost of living A+, housing A+; Watch: crime D, amenities F, commute F.
- Dekalb County (suburban): math 19% / reading 28% proficiency, ranked #125 of 174 in GA (top 72%) — low school quality limits family demand, transient renter base, plan for 1-2y turnover; 68% free/reduced lunch — lower-income household profile, screen leases tightly.
- Market conditions: Rents rising (+3.7%/yr); 215 active listings in the ZIP; 33 comparable units currently listed for rent nearby; rentals leasing fast (median 6d on market — plan ~1-2 weeks tenant-placement turnaround); 1,240 units permitted in DeKalb County in 2024 (385 in 5+ unit buildings).
Forward outlook
- Local home prices are declining (-3.0%/yr); year-one equity from $1k of loan paydown is wiped out by about $5k of value loss. Plan a longer hold.
- DeKalb County population projected at +28% by 2050 — long-run rental-demand tailwind backs the buy-and-hold thesis.
Negotiation context
- It's been on market 489 days — a 12% lower offer ($140k) is reasonable based on typical stale-listing flexibility.
- 18 sale attempts since 16y ago; this cycle's ask has dropped $31k (16%) from the opening price — seller is motivated, your offer sets the floor, not the list.
- Current owner paid $118k; 35% above their basis — modest negotiation headroom, anchor on the comps not their cost.
Risks & watch-outs
- Watch-outs: built in 1940 — expect roof / HVAC / electrical / plumbing capex.
Questions for the listing agent
- It's been on market 489 days. Have you received any prior offers? Is the seller open to a 12% concession, seller financing, or rate buy-down credit?
- Built in 1940 — when were the roof, HVAC, electrical panel, plumbing, and water heater last replaced?
- Why hasn't it sold? Are there any deal-killer items the seller is aware of (foundation, flood, title, zoning, code violations)?
- Is there a deadline driving the sale (1031 exchange, divorce, estate, relocation)? That informs how much negotiation room exists.
- Schools are B-rated — typically a magnet for longer-tenancy family renters. What's the average tenant stay here, and is there a school-zone premium baked into asking?
- Crime grade is D in this area — have there been break-ins, vandalism, or insurance claims at this property in the last 3 years? What carrier currently insures it and at what premium?
- What's the average days-on-market for RENTAL listings here right now (not sales)? A rising rental-DOM trend means longer vacancies and softer asking-rent achievability than the comps imply.
- What's the recent tenant-quality profile in this submarket — average credit score on applications, eviction rate, late-payment / NSF rate, and stable-employment percentage? A property-management company in the area should have these aggregated.
- How much new for-sale + rental construction is in the pipeline within 1–3 miles? Heavy new supply typically softens prices + rents 12–24 months out; constrained supply supports both.
Investment metrics
- 1% rule
- 1.05% ✓
- Cap rate
- 8.22%
- Cash-on-cash
- 6.88%
- DSCR
- 1.31
- GRM
- 8.0
CMA / ARV
- ARV (median comp)
- $221,854
- List price
- $159,000
- Delta
- -28.33%
- Verdict
- UNDERPRICED
- Comps
- 20 within 1.0 mi
Show comp detail 12 sales within ~0.75 mi
| Address | Dist | Beds/Ba | Sqft | Sold | Price | $/sf | Match |
|---|---|---|---|---|---|---|---|
| 4767 White Oak Path | 0.19mi | 3/2.0 (+1) | 1,274 (-3%) | 7mo | $209,000 | $164 | 72 |
| 1487 Walnut Ridge Way | 0.51mi | 3/2.0 (+1) | 1,304 (-0%) | 1mo | $111,400 | $85 | 65 |
| 4623 Birch Ridge Trl | 0.33mi | 3/2.0 (+1) | 1,373 (+5%) | 5mo | $300,000 | $218 | 64 |
| 4766 White Oak Path | 0.19mi | 3/2.0 (+1) | 1,450 (+11%) | 8mo | $206,000 | $142 | 58 |
| 1596 Allgood Rd | 0.36mi | 3/2.0 (+1) | 1,381 (+6%) | 8mo | $215,000 | $156 | 58 |
| 4812 White Oak Path | 0.30mi | 3/2.0 (+1) | 1,460 (+12%) | 6mo | $224,000 | $153 | 53 |
| 1619 Creekford Way | 0.33mi | 3/2.0 (+1) | 1,456 (+11%) | 16mo | $180,000 | $124 | 43 |
| 4821 Mainstreet Valley Trce | 0.72mi | 3/2.0 (+1) | 1,134 (-13%) | 5mo | $160,000 | $141 | 31 |
| 1643 Pine Glen Cir | 0.66mi | 3/2.0 (+1) | 1,150 (-12%) | 12mo | $214,000 | $186 | 30 |
| 4032 Big Valley Trl | 0.69mi | 3/2.0 (+1) | 1,120 (-14%) | 7mo | $165,000 | $147 | 29 |
| 1241 To Lani Path | 0.69mi | 3/2.5 (+1) | 1,468 (+12%) | 13mo | $270,000 | $184 | 26 |
| 4649 Big Valley Ct | 0.73mi | 3/2.0 (+1) | 1,120 (-14%) | 9mo | $175,000 | $156 | 25 |
Match score weights: distance 35% · size 25% · config 20% · recency 20%. Top-matched comps best support the ARV.
Projected returns pro-forma
-3.0% appreciation · 3.72% rent growth · sell at horizon
- IRR
- -5.0%
- Equity multiple
- 0.81×
- Total profit
- $-8,298
- Equity at exit
- $23,707
- IRR
- 5.5%
- Equity multiple
- 1.42×
- Total profit
- $18,762
- Equity at exit
- $13,747
Cash invested: $44,520 (down + closing). Projections, not guarantees.
Landlord ↔ Tenant lean methodology
- Overall (STATE)
- 90 Strongly Landlord-Friendly
- State Georgia
- 90 Strongly Landlord-Friendly · R+3
- County
- — inherits STATE
- City
- — inherits STATE
ZIP-level market 30088
- Rents YoY
- 3.7%
- Active inventory
- 215
- Price-to-rent
- 8.0×
Monthly cashflow live
- Estimated rent
- $1,665 high interval (Pro) →
- Mortgage (P&I)
- −$834
- Tax from tax record
- −$160 /mo · $1,921/yr
- Insurance
- −$66
- HOA
- −$0
- Vacancy / Maint / Mgmt
- −$350
- Net cashflow
- $255
Break-even live
Sensitivity live
| Price | -10% $345 | -5% $300 | +0% $255 | +5% $210 | +10% $165 |
|---|---|---|---|---|---|
| Rent | -10% $124 | -5% $189 | +0% $255 | +5% $321 | +10% $387 |
| Rate | -1.0pp $335 | -0.5pp $296 | base $255 | +0.5pp $214 | +1.0pp $172 |
UW: 25.0% down · 7.5% · 30yr · 1.5% tax · 5.0% vac · 8.0% maint · 8.0% mgmt
Financing live
Cash to close
- Down payment
- $39,750
- Closing costs
- $4,770
- Reserves months
- —
- Total cash needed
- —
Loan-product check · same deal, 3 products live
Conventional
25% down · 7.5% · 30yr
- Down + closing
- —
- Monthly P&I
- —
- Monthly cashflow
- —
- DSCR
- —
- Eligible?
- —
Personal DTI + credit; lowest rate.
DSCR
20% down · 8.5% · 30yr
- Down + closing
- —
- Monthly P&I
- —
- Monthly cashflow
- —
- DSCR
- —
- Eligible?
- —
No personal income docs; deal must DSCR.
Hard money
10% down · 12.0% · 12mo
- Down + closing
- —
- Monthly P&I
- —
- Monthly cashflow
- —
- DSCR
- —
- Eligible?
- —
Short-term bridge; refi at stabilization.
Rent comps 33 comps
| Address | Beds | Baths | Sqft | Rent | $/sqft | DOM | Units | Dist |
|---|---|---|---|---|---|---|---|---|
| 1420 S Hairston Rd Stone Mountain, GA | 1.0–2.0 | 1.0–2.5 | 1011 | $1,358 | $1.34 | 20d | 31 | 0.20mi |
| 4701 Lost Colony Ct Stone Mountain, GA | 3.0 | 2.0 | 1120 | $1,565 | $1.40 | 44d | 1 | 0.28mi |
| 1576 Canberra Dr Stone Mountain, GA | 3.0 | 2.0 | 1850 | $1,900 | $1.03 | 3d | 1 | 0.36mi |
| 1576 Canberra Dr Stone Mountain, GA | 3.0 | 2.0 | 1850 | $1,000 | $0.54 | 4d | 1 | 0.36mi |
| 1247 Adcox Rd Stone Mountain, GA | 1.0–2.0 | 1.0–2.0 | 919 | $1,259 | $1.37 | 2d | 10 | 0.41mi |
| 4169 Cedar Ridge Trl Stone Mountain, GA | 3.0 | 2.0 | 1591 | $1,870 | $1.18 | 5d | 1 | 0.54mi |
| 1299 To Lani Path Stone Mountain, GA | 3.0 | 2.0 | 1507 | $1,675 | $1.11 | 13d | 1 | 0.68mi |
| 1217 To Lani Path Stone Mountain, GA | 3.0 | 2.5 | 1404 | $1,754 | $1.25 | 2d | 1 | 0.74mi |
| 4935 Millstone Walk Stone Mountain, GA | 3.0 | 2.5 | 1248 | $1,950 | $1.56 | 5d | 1 | 0.76mi |
| 1163 Mainstreet Valley Dr Stone Mountain, GA | 3.0 | 2.0 | 1024 | $1,476 | $1.44 | 25d | 1 | 0.76mi |
| 1127 Mainstreet Valley Dr Stone Mountain, GA | 2.0 | 2.0 | 1074 | $1,681 | $1.57 | 0d | 1 | 0.79mi |
| 1406 High Meadow Dr Stone Mountain, GA | 3.0 | 2.0 | 1621 | $900 | $0.56 | 22d | 1 | 0.80mi |
| 1406 High Meadow Dr Stone Mountain, GA | 3.0 | 2.0 | 1621 | $1,625 | $1.00 | 13d | 1 | 0.80mi |
| 1183 Mill Lake Cir Stone Mountain, GA | 3.0 | 2.0 | 1373 | $1,751 | $1.28 | 5d | 1 | 0.82mi |
| 1373 Mill Lake Cir Stone Mountain, GA | 3.0 | 2.0 | 1296 | $1,738 | $1.34 | 0d | 1 | 0.84mi |
| 1401 Mill Lake Cir Stone Mountain, GA | 3.0 | 2.0 | 1320 | $1,675 | $1.27 | 13d | 1 | 0.85mi |
| 1338 Mill Lake Cir Stone Mountain, GA | 3.0 | 2.0 | 1844 | $1,900 | $1.03 | 2d | 1 | 0.86mi |
| 1563 Pine Glen Cir Decatur, GA | 3.0 | 2.0 | 1608 | $1,695 | $1.05 | 5d | 1 | 0.87mi |
| 1228 Mill Lake Cir Stone Mountain, GA | 3.0 | 2.0 | 1344 | $1,645 | $1.22 | 44d | 1 | 0.88mi |
| 1038 S Hairston Rd Stone Mountain, GA | 1.0–3.0 | 1.0–2.0 | 912 | $1,092 | $1.20 | 5d | 1 | 0.98mi |
| 1922 Manhattan Pkwy Decatur, GA | 2.0 | 2.5 | 1814 | $2,000 | $1.10 | 5d | 1 | 1.05mi |
| 1380 Colony Hill Ct Stone Mountain, GA | 3.0 | 1.5 | 1350 | $1,500 | $1.11 | 11d | 1 | 1.08mi |
| 2014 Manhattan Pkwy Decatur, GA | 3.0 | 2.5 | 1620 | $1,956 | $1.21 | 5d | 1 | 1.14mi |
| 4612 Grand Central Pkwy Decatur, GA | 2.0 | 2.5 | 1328 | $2,100 | $1.58 | 25d | 1 | 1.17mi |
| 4808 Brasac Dr Stone Mountain, GA | 1.0 | 1.0 | 1680 | $617 | $0.37 | 4d | 1 | 1.17mi |
| 1859 Broadway St Decatur, GA | 3.0 | 2.5 | 1620 | $2,200 | $1.36 | 4d | 1 | 1.20mi |
| 4236 Glenhaven Dr Decatur, GA | 3.0 | 2.0 | 1120 | $1,770 | $1.58 | 0d | 1 | 1.21mi |
| 924 Lake Drive Ter Stone Mountain, GA | 3.0 | 2.0 | 1380 | $1,670 | $1.21 | 44d | 1 | 1.23mi |
| 867 Oakhill Ct Stone Mountain, GA | 3.0 | 2.5 | 1556 | $1,850 | $1.19 | 44d | 1 | 1.35mi |
| 869 Heritage Oaks Dr Stone Mountain, GA | 3.0 | 2.5 | 1400 | $1,199 | $0.86 | 0d | 1 | 1.38mi |
| 841 Arbor Ct Stone Mountain, GA | 3.0 | 2.0 | 1448 | $1,845 | $1.27 | 22d | 1 | 1.40mi |
| 887 Ellis Rd Stone Mountain, GA | 3.0 | 2.0 | 1778 | $1,923 | $1.08 | 25d | 1 | 1.41mi |
| 1467 Muirfield Dr Stone Mountain, GA | 3.0 | 2.0 | 1630 | $1,870 | $1.15 | 22d | 1 | 1.42mi |
Listing history 50 events
-
2026-06-18days on market $159,000 Active 489 DOM
-
2026-06-17days on market $159,000 Active 488 DOM
-
2026-06-16days on market $159,000 Active 487 DOM
-
2026-06-15days on market $159,000 Active 486 DOM
-
2026-06-13days on market $159,000 Active 484 DOM
-
2026-06-09days on market $159,000 Active 480 DOM
-
2026-06-08days on market $159,000 Active 479 DOM
-
2026-06-07days on market $159,000 Active 478 DOM
-
2026-06-04days on market $159,000 Active 475 DOM
-
2026-06-03days on market $159,000 Active 474 DOM
-
2026-06-02days on market $159,000 Active 473 DOM
-
2026-06-01days on market $159,000 Active 472 DOM
-
2026-05-31days on market $159,000 Active 471 DOM
-
2025-10-29historical
-
2025-10-29historical
-
2025-08-04status Price Change
-
2025-08-04status Active
-
2025-08-04price $159,000
-
2025-08-04price $159,000
-
2025-07-30historical
-
2025-07-30historical
-
2025-07-29price $159,000
-
2025-07-29price $159,000
-
2025-04-15price $159,900
-
2025-04-15price $159,900
-
2025-04-15price $159,900
-
2025-04-15price $159,900
-
2025-02-14$189,900 Active
-
2025-02-14$189,900 New
-
2025-02-14$189,900 New
-
2025-02-14$189,900 Active
-
2025-01-23historical
-
2025-01-23historical
-
2025-01-23historical
-
2025-01-23historical
-
2024-11-11price $189,900
-
2024-11-11price $189,900
-
2024-11-11price $189,900
-
2024-11-11price $189,900
-
2024-07-26historical
-
2024-07-23$204,900 Active
-
2024-07-23$204,900 New
-
2024-07-23$204,900 Active
-
2024-07-23$204,900 New
-
2024-07-23$204,900 New
-
2023-10-19soldstatus $118,000
-
2023-10-11soldstatus $118,000 Closed
-
2023-10-11soldstatus $118,000 Sold
-
2023-09-21status Under Contract
-
2023-09-21historical Active Under Contract
ⓘ Source: listings_history table (triggers on properties + properties_extension) + one-shot
backfill from property_details.listing_events for pre-trigger history.
Tax reassessment forecast GA · Resets to sale price
- Current annual tax
- $1,921 · $160/mo
- Projected year-2 tax
- $1,921 · $160/mo
- Expected delta
- $0/yr ($0/mo · -0.0%)
ⓘ Screening estimate from a state-policy table — verify with the county assessor before closing.
Nearby sold comps map
Loading sold comps map…
Walkable amenities ~0.75 mi
Loading nearby amenities…
Taxation est. · year 1
- Rental income
- $19,979
- − Mortgage interest
- −$8,906
- − Property taxes
- −$1,921
- − Insurance
- −$795
- − Repairs & maintenance
- −$1,598
- − Management
- −$1,598
- − Depreciation
- −$4,625
- Taxable income
- $535
- Est. tax owed @ 24.0%
- −$128
- After-tax cash flow
- $2,933/yr
For passive investors: Depreciation is non-cash, so a rental often shows a tax loss while cash-flowing — sheltering income. Rental losses are passive: they offset passive income freely, and up to $25,000/yr can offset ordinary (W-2) income if you actively participate and your MAGI is under $100k (phasing out to $0 by $150k); unused losses carry forward. On sale, claimed depreciation is recaptured at up to 25%, and gains may owe capital-gains tax (a 1031 exchange can defer both). Figures are a year-1 estimate at your 24.0% rate — not tax advice; consult a CPA.
Schools (NCES district)
- District
- Dekalb County
- NCES district ID
- 1301740
- Math proficiency
- 19% ▼ -12.00%
- Reading proficiency
- 28% ▼ -7.00%
- Median HH income
- $51,448
- Composite
- 20.92/100
- National rank
- #8482
- State rank
- #125 of 174 in GA
Livability — Redan
- Score
- 64/100
- State rank
- #274
- US rank
- #14766
Category grades
Schools grade is shown separately in the Schools card above.
Census & demographics
- County
- Dekalb County · 782,738 people
- City population
- 29,279
- Metro
- Atlanta-Sandy Springs-Alpharetta, GA
- Population (ZIP)
- 29,240
- Household income
- $70,325
- Rent vs Own
- Severe rent burden
- 1106.0
Population outlook (DeKalb County) Hauer SSP2
- Today (2025)
- 839,977 people
- By 2030
- 891,768 · +6.2%
- By 2040
- 988,894 · +17.7%
- By 2050
- 1,074,583 · +27.9%
- By 2075
- 1,245,026 · +48.2%
- By 2100
- 1,303,135 · +55.1%
Race, ethnicity, and origin ACS 2023
- Neighborhood character
- Predominantly Black (84%)
- Race & ethnicity
- Black 84% White 5% Hispanic / Latino 5% Two or more races 5%
- Common ancestry
- Swedish 1% Russian 1%
- Foreign-born
- 11% · Canada
- Languages at home
- 90% English-only · Spanish 4% French/Haitian/Cajun 1% Other Indo-European 1%
Political lean MEDSL · DeKalb
- 2024 margin
- Solid D (+64.8) · D 81.9% · R 17.1% · Other 1.0%
- 2008→2024 swing
- +6.1pp toward D · 2008: 58.6pp · 2024: 64.8pp
- All cycles
- 2024: D+64.8 2020: D+67.4 2016: D+64.8 2012: D+56.8 2008: D+58.6
Not yet ingested
- Civics
- —
Market trends
- HPI YoY
- ▼ -169.92%
- Current HPI
- 206.5421
- Rent YoY
- ▲ 3.72%
- Metro
- Atlanta-Sandy Springs-Alpharetta, GA
- State GDP YoY
- ▲ 2.66%
- F500 in state
- 28
Industry mix (Fortune 500 HQ in GA)
| Industry | F500 HQs | Revenue |
|---|---|---|
| Paper / Packaging | 2 | $29B |
|
||
| Retail | 1 | $160B |
|
||
| Transportation / Logistics | 1 | $91B |
|
||
| Airlines | 1 | $62B |
|
||
| Consumer Goods | 1 | $47B |
|
||
| Utilities | 1 | $25B |
|
||
Price history
+156.5% since first listed54 events — show timeline
- 2025-10-29 Listing Removed — GAMLS
- 2025-10-29 Listing Removed — FMLS
- 2025-08-04 Relisted — GAMLS
- 2025-08-04 Relisted — FMLS
- 2025-08-04 Price Changed $159,000 GAMLS
- 2025-08-04 Price Changed $159,000 FMLS
- 2025-07-30 Listing Removed — GAMLS
- 2025-07-30 Listing Removed — FMLS
- 2025-07-29 Price Changed $159,000 GAMLS
- 2025-07-29 Price Changed $159,000 FMLS
- 2025-04-15 Price Changed $159,900 GAMLS
- 2025-04-15 Price Changed $159,900 FMLS
- 2025-04-15 Price Changed $159,900 GAMLS
- 2025-04-15 Price Changed $159,900 FMLS
- 2025-02-14 Listed $189,900 FMLS
- 2025-02-14 Listed $189,900 GAMLS
- 2025-02-14 Listed $189,900 GAMLS
- 2025-02-14 Listed $189,900 FMLS
- 2025-01-23 Listing Removed — GAMLS
- 2025-01-23 Listing Removed — FMLS
- 2025-01-23 Listing Removed — GAMLS
- 2025-01-23 Listing Removed — FMLS
- 2024-11-11 Price Changed $189,900 GAMLS
- 2024-11-11 Price Changed $189,900 FMLS
- 2024-11-11 Price Changed $189,900 GAMLS
- 2024-11-11 Price Changed $189,900 FMLS
- 2024-07-26 Listing Removed — GAMLS
- 2024-07-23 Listed $204,900 GAMLS
- 2024-07-23 Listed $204,900 GAMLS
- 2024-07-23 Listed $204,900 FMLS
- 2024-07-23 Listed $204,900 GAMLS
- 2024-07-23 Listed $204,900 FMLS
- 2023-10-19 Sold (Public Records) $118,000 Public Records
- 2023-10-11 Sold (MLS) $118,000 GAMLS
- 2023-10-11 Sold (MLS) $118,000 FMLS
- 2023-09-21 Pending — GAMLS
- 2023-09-21 Contingent — FMLS
- 2023-08-29 Listed $125,000 GAMLS
- 2023-08-29 Listed $125,000 FMLS
- 2022-11-15 Listing Removed — GAMLS
- 2022-08-13 Listed $185,000 GAMLS
- 2020-06-04 Listing Removed — GAMLS
- 2020-02-07 Listing Removed — GAMLS
- 2020-02-07 Price Changed $55,000 GAMLS
- 2020-02-05 Listed $59,500 GAMLS
- 2019-09-16 Price Changed $59,500 GAMLS
- 2019-08-07 Listing Removed — GAMLS
- 2019-08-06 Listed $69,500 GAMLS
- 2019-02-18 Listed $70,000 GAMLS
- 2010-12-20 Listing Removed — FMLS
- 2010-12-08 Sold (MLS) $23,500 FMLS
- 2010-09-23 Pending — FMLS
- 2010-09-02 Listed $30,000 FMLS
- 2000-12-14 Sold (Public Records) $62,000 Public Records
Property tax history
+6.2%/yrLatest (2025): $1,921 · -6.9% YoY. Source: county tax records.
Cash-flow waterfall
monthlySold comps — $/sqft
last 12 mo · ≤1 miLoading sold comps…