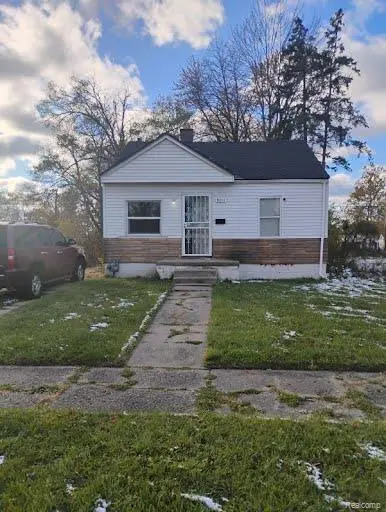
9011 Heyden St · Detroit, MI
Flood risk 1/10 · Minimal
- FEMA flood zone
- X (unshaded)
- Chance of flooding over 30 yrs
- 0.0%
- Est. flood insurance / yr
- $473 – $860
Fire risk 1/10 · Minimal
- Est. fire insurance / yr
- $784 – $1,456
Heat risk 3/10 · Minor
- Hot days now (above 99°F)
- 7 days/yr
- Hot days in 30 yrs
- 15 days/yr
Wind risk 2/10 · Minimal
- Chance of severe wind over 30 yrs
- —
Air-quality risk 3/10 · Minor
- Unhealthy air days now
- 2 days/yr
- Unhealthy air days in 30 yrs
- 5 days/yr
Risk factors via First Street. Map © Google.
Why this score? — see what drove the B- grade
The composite is a weighted blend of 9 inputs, each scored 0–100. Each bar is that input's sub-score; the figure is the points it added to the 100-point composite (weight × sub-score).
- Cash flow +30.0/30.0
- 1% rule +10.0/10.0
- DSCR +10.0/10.0
- ARV discount +9.7/15.0
- Livability +3.7/5.0
- Condition / age +2.5/5.0
- Rent growth +1.9/5.0
- Schools +1.3/10.0
- Appreciation +0.0/10.0
$45,000
🖨 Deal sheet 📄 Offer letter ✓ Due diligence
Listing remarks MLS
Great 2BD/1BA property. Modest updates, fresh paint and carpet throughout, good bones, well maintained. Mechanicals are in place and good working order. You won't regret this place! Come inquire about it today before it's too late!
Key facts
- 4,792 sq ft lot
- Built 1950
- Listed 43 days
Property features AI
Exterior
- Parking: Driveway (no garage)
- Utilities: Public water; Public sewer
- Home design: Single-family residence; One story; Ground-level entry
- Construction: Vinyl siding; Block foundation
- Exterior features: Paved road access; Lot approximately 0.11 acres (35 x 134.02)
Interior
- Bathrooms: 1 full bathroom
- Heating & cooling: Forced air heating (natural gas); No cooling
- Interior features: Unfinished basement; Total of 4 rooms
Neighborhood map
What this means for you Summary
Snapshot
- This is a 2-bed/1.0-bath single-family listed at $45k.
Deal economics
- At list price, monthly cash flow is $483 ($6k/yr) — positive.
- The deal already cash-flows at list — no discount required.
- Meets the 1% rule at list price ($1k rent vs $45k).
- Recommended offer: $44k (3.0% below list) — sets the bar for market timing.
- Cap rate 19.2% vs local median 10.2% in Detroit — top-decile yield for the area; either an underpriced asset or a hidden risk that comps aren't pricing in. Stress-test before assuming the spread holds.
Location & tenants
- Location reads 73/100 on livability (#218 in MI) — a middle-class / working-renter tenant base. Strengths: amenities A+, commute A+, cost of living A+; Watch: schools F, crime F, employment F.
- Detroit Public Schools Community District (urban): math 10% / reading 24% proficiency, ranked #499 of 540 in MI (top 92%) — low school quality limits family demand, transient renter base, plan for 1-2y turnover; 90% free/reduced lunch — lower-income household profile, screen leases tightly.
- Market conditions: Rents soft (-2.3%/yr); 363 active listings in the ZIP; 6 comparable units currently listed for rent nearby; rentals lingering (median 44d on market — plan ~5-8 weeks vacancy on turnover, expect pricing pressure); 67% of comp listings sitting > 30 days — soft ceiling on asking rent; lower-income renter base — watch delinquency; 2,639 units permitted in Wayne County in 2024 (1,216 in 5+ unit buildings).
- This rent runs 41% of the median local income ($31k/yr) — at the standard rent-burdened threshold; future hikes will face affordability resistance.
Forward outlook
- Local home prices are declining (-3.0%/yr); year-one equity from $311 of loan paydown is wiped out by about $1k of value loss. Plan a longer hold.
- Wayne County population projected at -17% by 2050 — secular population decline; favor cash flow + early exit over multi-decade hold.
- At projected returns (-3.0% appreciation + 0.0% rent growth), your $13k cash investment doubles in ~3 years — after that, you're playing with house money.
Negotiation context
- It's been on market 43 days — a 3% lower offer ($44k) is reasonable based on typical stale-listing flexibility.
- 4 sale attempts since 21y ago with the ask held roughly flat each time — persistent listings suggest the price (not the market) is what's stuck; bring a comps-based counter.
- Current owner paid $1k; list at $45k implies a 4400% gain — meaningful room to come down on a strong offer.
Risks & watch-outs
- Watch-outs: built in 1950 — expect roof / HVAC / electrical / plumbing capex.
Questions for the listing agent
- It's been on market 43 days. Have you received any prior offers? Is the seller open to a 3% concession, seller financing, or rate buy-down credit?
- Built in 1950 — when were the roof, HVAC, electrical panel, plumbing, and water heater last replaced?
- Is there a deadline driving the sale (1031 exchange, divorce, estate, relocation)? That informs how much negotiation room exists.
- Schools are F-rated, which usually means shorter tenancies and higher turnover. Who's the typical renter profile here, and what's been the actual vacancy rate?
- Crime grade is F in this area — have there been break-ins, vandalism, or insurance claims at this property in the last 3 years? What carrier currently insures it and at what premium?
- What's the average days-on-market for RENTAL listings here right now (not sales)? A rising rental-DOM trend means longer vacancies and softer asking-rent achievability than the comps imply.
- What's the recent tenant-quality profile in this submarket — average credit score on applications, eviction rate, late-payment / NSF rate, and stable-employment percentage? A property-management company in the area should have these aggregated.
- How much new for-sale + rental construction is in the pipeline within 1–3 miles? Heavy new supply typically softens prices + rents 12–24 months out; constrained supply supports both.
Investment metrics
- 1% rule
- 2.30% ✓
- Cap rate
- 19.16%
- Cash-on-cash
- 45.96%
- DSCR
- 3.05
- GRM
- 3.6
CMA / ARV
- ARV (median comp)
- $47,282
- List price
- $45,000
- Delta
- -4.83%
- Verdict
- FAIR
- Comps
- 20 within 1.0 mi
Show comp detail 12 sales within ~0.75 mi
| Address | Dist | Beds/Ba | Sqft | Sold | Price | $/sf | Match |
|---|---|---|---|---|---|---|---|
| 8645 Fielding St | 0.25mi | 2/1.0 | 693 (+3%) | 2mo | $39,000 | $56 | 81 |
| 8411 Fielding St | 0.39mi | 2/1.0 | 693 (+3%) | 1mo | $47,000 | $68 | 76 |
| 8611 Stout St | 0.26mi | 2/1.0 | 693 (+3%) | 13mo | $35,000 | $51 | 72 |
| 9107 Vaughan St | 0.11mi | 2/1.0 | 732 (+9%) | 12mo | $47,000 | $64 | 70 |
| 9101 Heyden St | 0.09mi | 2/1.0 | 740 (+10%) | 13mo | $40,000 | $54 | 68 |
| 8883 Plainview Ave | 0.19mi | 2/1.0 | 708 (+5%) | 18mo | $48,900 | $69 | 67 |
| 8499 Braile St | 0.38mi | 2/1.0 | 726 (+8%) | 8mo | $55,000 | $76 | 62 |
| 9271 Minock St | 0.38mi | 3/1.0 (+1) | 736 (+10%) | 12mo | $85,714 | $116 | 52 |
| 8257 Minock St | 0.55mi | 2/1.0 | 737 (+10%) | 8mo | $32,000 | $43 | 52 |
| 8062 Grandville Ave | 0.73mi | 2/1.0 | 732 (+9%) | 6mo | $60,000 | $82 | 46 |
| 8900 Artesian St | 0.65mi | 2/1.0 | 746 (+11%) | 10mo | $35,000 | $47 | 42 |
| 9962 Evergreen Ave | 0.61mi | 3/1.0 (+1) | 762 (+13%) | 16mo | $52,000 | $68 | 30 |
Match score weights: distance 35% · size 25% · config 20% · recency 20%. Top-matched comps best support the ARV.
Projected returns pro-forma
-3.0% appreciation · 0.0% rent growth · sell at horizon
- IRR
- 39.6%
- Equity multiple
- 2.62×
- Total profit
- $20,440
- Equity at exit
- $6,710
- IRR
- 44.5%
- Equity multiple
- 4.63×
- Total profit
- $45,768
- Equity at exit
- $3,891
Cash invested: $12,600 (down + closing). Projections, not guarantees.
Landlord ↔ Tenant lean methodology
- Overall (STATE)
- 62 Landlord-Friendly
- State Michigan
- 62 Landlord-Friendly · EVEN
- County
- — inherits STATE
- City
- — inherits STATE
ZIP-level market 48228
- Rents YoY
- -2.3%
- Active inventory
- 363
- Price-to-rent
- 3.6×
Monthly cashflow live
- Estimated rent
- $1,036 high interval (Pro) →
- Mortgage (P&I)
- −$236
- Tax from tax record
- −$81 /mo · $976/yr
- Insurance
- −$19
- HOA
- −$0
- Vacancy / Maint / Mgmt
- −$218
- Net cashflow
- $483
Break-even live
UW: 25.0% down · 7.5% · 30yr · 1.5% tax · 5.0% vac · 8.0% maint · 8.0% mgmt
Financing live
Cash to close
- Down payment
- $11,250
- Closing costs
- $1,350
- Reserves months
- —
- Total cash needed
- —
Loan-product check · same deal, 3 products live
Conventional
25% down · 7.5% · 30yr
- Down + closing
- —
- Monthly P&I
- —
- Monthly cashflow
- —
- DSCR
- —
- Eligible?
- —
Personal DTI + credit; lowest rate.
DSCR
20% down · 8.5% · 30yr
- Down + closing
- —
- Monthly P&I
- —
- Monthly cashflow
- —
- DSCR
- —
- Eligible?
- —
No personal income docs; deal must DSCR.
Hard money
10% down · 12.0% · 12mo
- Down + closing
- —
- Monthly P&I
- —
- Monthly cashflow
- —
- DSCR
- —
- Eligible?
- —
Short-term bridge; refi at stabilization.
Rent comps 6 comps
| Address | Beds | Baths | Sqft | Rent | $/sqft | DOM | Units | Dist |
|---|---|---|---|---|---|---|---|---|
| 20237 W Chicago Detroit, MI | 1.0 | 1.0 | 650 | $850 | $1.31 | 43d | 1 | 0.31mi |
| 19301 Joy Rd Apt 1 Detroit, MI | 2.0 | 1.0 | 750 | $1,100 | $1.47 | 43d | 1 | 0.49mi |
| 7635 Evergreen Ave Detroit, MI | 3.0 | 1.0 | 690 | $1,350 | $1.96 | 43d | 1 | 0.88mi |
| 18401 Joy Rd Unit 8 Detroit, MI | 1.0 | 1.0 | 600 | $875 | $1.46 | 43d | 1 | 0.96mi |
| 18450 W Chicago Detroit, MI | 1.0–2.0 | 1.0 | 687 | $1,117 | $1.62 | 1d | 15 | 0.98mi |
| 6980 Town Ln Dearborn Heights, MI | 1.0 | 1.0 | 600 | $895 | $1.49 | 17d | 1 | 1.38mi |
Listing history 20 events
-
2026-06-18days on market $45,000 Active 43 DOM
-
2026-06-17days on market $45,000 Active 42 DOM
-
2026-06-15days on market $45,000 Active 40 DOM
-
2026-06-13days on market $45,000 Active 38 DOM
-
2026-06-13days on market $45,000 Active 37 DOM
-
2026-06-09days on market $45,000 Active 34 DOM
-
2026-06-08days on market $45,000 Active 33 DOM
-
2026-06-07days on market $45,000 Active 32 DOM
-
2026-06-04days on market $45,000 Active 29 DOM
-
2026-06-03days on market $45,000 Active 28 DOM
-
2026-06-02days on market $45,000 Active 27 DOM
-
2026-06-01days on market $45,000 Active 26 DOM
-
2026-05-31days on market $45,000 Active 25 DOM
-
2026-05-06$45,000 Active 231-char remark
Show marketing remark (231 chars)
Great 2BD/1BA property. Modest updates, fresh paint and carpet throughout, good bones, well maintained. Mechanicals are in place and good working order. You won't regret this place! Come inquire about it today before it's too late!
-
2008-07-03soldstatus $1,000
Show marketing remark (315 chars)
$1,000 selling bonus if sold before 4/30/08!!!! West Side Investment special !! Two Bedroom home with a full basement great for extra storage space. Nice Rental Property or starter home. This home has lots of potential. Bank owned proeprty to be sold in as condition, buyers agent to verfiy all data and measurement
-
2007-10-10$3,000
Show marketing remark (315 chars)
$1,000 selling bonus if sold before 4/30/08!!!! West Side Investment special !! Two Bedroom home with a full basement great for extra storage space. Nice Rental Property or starter home. This home has lots of potential. Bank owned proeprty to be sold in as condition, buyers agent to verfiy all data and measurement
-
2006-06-22soldstatus $80,000
-
2005-10-04historical
-
2005-07-28$22,000
ⓘ Source: listings_history table (triggers on properties + properties_extension) + one-shot
backfill from property_details.listing_events for pre-trigger history.
Tax reassessment forecast MI · Partial reset (capped growth)
- Current annual tax
- $976 · $81/mo
- Projected year-2 tax
- $976 · $81/mo
- Expected delta
- $0/yr ($0/mo · 0.0%)
ⓘ Screening estimate from a state-policy table — verify with the county assessor before closing.
Climate risk First Street
- Flood 1/10 Low FEMA zone X (unshaded) · 0% chance over 30 yrs
- Wildfire 1/10 Low
- Heat 3/10 Moderate 7 d/yr ≥99°F today · 15 d/yr by 30 yrs out
- Wind 2/10 Low
- Air quality 3/10 Moderate 2 unhealthy d/yr today · 5 by 30 yrs out
Nearby sold comps map
Loading sold comps map…
Walkable amenities ~0.75 mi
Loading nearby amenities…
Taxation est. · year 1
- Rental income
- $12,435
- − Mortgage interest
- −$2,521
- − Property taxes
- −$976
- − Insurance
- −$225
- − Repairs & maintenance
- −$995
- − Management
- −$995
- − Depreciation
- −$1,309
- Taxable income
- $5,415
- Est. tax owed @ 24.0%
- −$1,300
- After-tax cash flow
- $4,492/yr
For passive investors: Depreciation is non-cash, so a rental often shows a tax loss while cash-flowing — sheltering income. Rental losses are passive: they offset passive income freely, and up to $25,000/yr can offset ordinary (W-2) income if you actively participate and your MAGI is under $100k (phasing out to $0 by $150k); unused losses carry forward. On sale, claimed depreciation is recaptured at up to 25%, and gains may owe capital-gains tax (a 1031 exchange can defer both). Figures are a year-1 estimate at your 24.0% rate — not tax advice; consult a CPA.
Schools (NCES district)
- District
- Detroit Public Schools Community District
- NCES district ID
- 2601103
- Math proficiency
- 10% ▼ -2.00%
- Reading proficiency
- 24% ▲ 6.00%
- Median HH income
- $25,815
- Composite
- 13.06/100
- National rank
- #9564
- State rank
- #499 of 540 in MI
Livability — Detroit
- Score
- 73/100
- State rank
- #218
- US rank
- #5427
Category grades
Schools grade is shown separately in the Schools card above.
Census & demographics
- Census place
- Detroit, MI
- County
- Wayne County · 1,562,939 people
- City population
- 572,865
- Metro
- Detroit-Warren-Dearborn, MI
- Population (ZIP)
- 50,117
- Household income
- $30,680
- Rent vs Own
- Severe rent burden
- 4144.0
Population outlook (Wayne County) Hauer SSP2
- Today (2025)
- 1,675,273 people
- By 2030
- 1,620,300 · -3.3%
- By 2040
- 1,502,341 · -10.3%
- By 2050
- 1,384,039 · -17.4%
- By 2075
- 1,124,592 · -32.9%
- By 2100
- 881,193 · -47.4%
Race, ethnicity, and origin ACS 2023
- Neighborhood character
- Predominantly Black (71%)
- Race & ethnicity
- Black 71% White 16% Two or more races 7% Hispanic / Latino 6%
- Hispanic origin (detail)
- Mexican 3% Puerto Rican 2%
- Common ancestry
- Arab 2% Romanian 2% Lithuanian 1%
- Foreign-born
- 11% · Canada
- Languages at home
- 82% English-only · Arabic 11% Spanish 5%
Political lean MEDSL · Wayne
- 2024 margin
- Strong D (+29.0) · D 62.7% · R 33.7% · Other 3.6%
- 2008→2024 swing
- -20.5pp toward R · 2008: 49.5pp · 2024: 29.0pp
- All cycles
- 2024: D+29.0 2020: D+38.1 2016: D+37.3 2012: D+46.9 2008: D+49.5
Not yet ingested
- Civics
- —
Market trends
- HPI YoY
- ▼ -160.81%
- Current HPI
- 168.6843
- Rent YoY
- ▼ -2.30%
- Metro
- Detroit-Warren-Dearborn, MI
- State GDP YoY
- ▲ 1.37%
- F500 in state
- 28
Industry mix (Fortune 500 HQ in MI)
| Industry | F500 HQs | Revenue |
|---|---|---|
| Automotive Parts | 3 | $48B |
|
||
| Automotive | 2 | $372B |
|
||
| Chemicals | 1 | $45B |
|
||
| Automotive Retail | 1 | $29B |
|
||
| Healthcare / Medical Devices | 1 | $23B |
|
||
| Automotive Technology | 1 | $20B |
|
||
Price history
+104.5% since first listed7 events — show timeline
- 2026-05-06 Listed $45,000 MiRealSource-MiMLS
- 2026-05-06 Listed $45,000 REALCOMP
- 2008-07-03 Sold (MLS) $1,000 REALCOMP
- 2007-10-10 Listed $3,000 REALCOMP
- 2006-06-22 Sold (Public Records) $80,000 Public Records
- 2005-10-04 Listing Removed — REALCOMP
- 2005-07-28 Listed $22,000 REALCOMP
Property tax history
-1.6%/yrLatest (2025): $976 · -49.4% YoY. Source: county tax records.
Cash-flow waterfall
monthlySold comps — $/sqft
last 12 mo · ≤1 miLoading sold comps…