 🏷️ Likely Rental
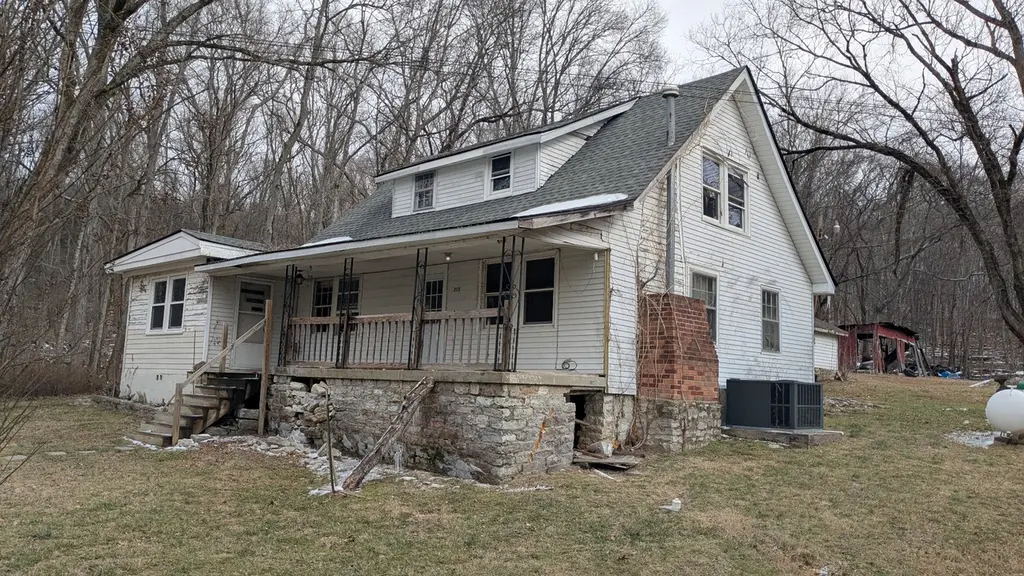
215 Robertson Ln · Hartsville/Trousdale County, TN
Flood risk 1/10 · Minimal
- FEMA flood zone
- X (unshaded)
- Chance of flooding over 30 yrs
- 0.0%
- Est. flood insurance / yr
- $507 – $1,088
Fire risk 4/10 · Minor
- Est. fire insurance / yr
- $949 – $1,763
Heat risk 5/10 · Moderate
- Hot days now (above 107°F)
- 7 days/yr
- Hot days in 30 yrs
- 19 days/yr
Wind risk 3/10 · Minor
- Chance of severe wind over 30 yrs
- 6.0%
Air-quality risk 2/10 · Minimal
- Unhealthy air days now
- 0 days/yr
- Unhealthy air days in 30 yrs
- 2 days/yr
Risk factors via First Street. Map © Google.
Why this score? — see what drove the D+ grade
The composite is a weighted blend of 9 inputs, each scored 0–100. Each bar is that input's sub-score; the figure is the points it added to the 100-point composite (weight × sub-score).
- Cash flow +13.4/30.0
- Appreciation +10.0/10.0
- ARV discount +7.5/15.0
- DSCR +4.0/10.0
- 1% rule +2.6/10.0
- Schools +2.6/10.0
- Rent growth +2.5/5.0
- Livability +2.5/5.0
- Condition / age +2.5/5.0
$180,000
🖨 Deal sheet 📄 Offer letter ✓ Due diligence
Listing remarks MLS
FINANCING FELL THROUGH - BACK ON THE MARKET. This historic home is on 3.01 acres on a quiet, no-through street of other large properties. Property can be purchased AS-IS, but could be a gem with a little love! Tenant damaged the home, so it needs some tender love and care.
Key facts
- 3.01 acre lot
- Built 1940
- Listed 139 days
Neighborhood map
What this means for you Summary
Snapshot
- This is a 3-bed/2.0-bath single-family listed at $180k.
Deal economics
- At list price, monthly cash flow is $2 ($22/yr) — positive.
- The deal already cash-flows at list — no discount required.
- To meet the 1% rule (rent ≥ 1% of price), the offer needs to be $137k (24.0% below list).
- Recommended offer: $137k (24.0% below list) — sets the bar for 1% rule.
- Cap rate 6.3% vs local median 2.4% in Hartsville/Trousdale County — top-decile yield for the area; either an underpriced asset or a hidden risk that comps aren't pricing in. Stress-test before assuming the spread holds.
Location & tenants
- Location reads: area grade D — affects rentability + tenant quality, not the cash-flow math above.
- Trousdale County (rural): math 29% / reading 33% proficiency, ranked #46 of 139 in TN (top 33%) — families likely to look elsewhere, expect single-tenant / working-renter base with shorter leases.
- Market conditions: 35 active listings in the ZIP; 112 units permitted in Trousdale County in 2024 (0 in 5+ unit buildings).
Forward outlook
- In year one you build about $19k of equity ($1k loan paydown + $18k appreciation (10.0% local appreciation)).
- Trousdale County population projected at +8% by 2050 — modest demand growth; plan on rents tracking national, not racing it.
- At projected returns (10.0% appreciation + 3.0% rent growth), your $50k cash investment doubles in ~3 years — after that, you're playing with house money.
- By year 2, paydown + projected appreciation supports a ~$31k cash-out refi (75% LTV) — recoverable capital for the next deal without selling this one.
Negotiation context
- It's been on market 139 days — a 12% lower offer ($158k) is reasonable based on typical stale-listing flexibility.
- 3 sale attempts; this cycle's ask has dropped $20k (10%) from the opening price — seller is motivated, your offer sets the floor, not the list.
Risks & watch-outs
- Watch-outs: built in 1940 — expect roof / HVAC / electrical / plumbing capex.
- Climate carrying-cost: extreme-heat days projected 7→19/yr by 2055 (HVAC capex compounding) — expect insurance premiums to compound above CPI over the hold.
Questions for the listing agent
- It's been on market 139 days. Have you received any prior offers? Is the seller open to a 24% concession, seller financing, or rate buy-down credit?
- Built in 1940 — when were the roof, HVAC, electrical panel, plumbing, and water heater last replaced?
- Why hasn't it sold? Are there any deal-killer items the seller is aware of (foundation, flood, title, zoning, code violations)?
- Is there a deadline driving the sale (1031 exchange, divorce, estate, relocation)? That informs how much negotiation room exists.
- The area grade is low — what's the realistic commute time and amenity access for the typical tenant pool here? Any planned neighborhood developments (good or bad) we should know about?
- What's the average days-on-market for RENTAL listings here right now (not sales)? A rising rental-DOM trend means longer vacancies and softer asking-rent achievability than the comps imply.
- What's the recent tenant-quality profile in this submarket — average credit score on applications, eviction rate, late-payment / NSF rate, and stable-employment percentage? A property-management company in the area should have these aggregated.
- How much new for-sale + rental construction is in the pipeline within 1–3 miles? Heavy new supply typically softens prices + rents 12–24 months out; constrained supply supports both.
Investment metrics
- 1% rule
- 0.76% ✗
- Cap rate
- 6.31%
- Cash-on-cash
- 0.04%
- DSCR
- 1.00
- GRM
- 11.0
CMA / ARV
- ARV (median comp)
- $486,521
- List price
- $180,000
- Delta
- -63.00%
- Verdict
- UNDERPRICED
- Comps
- 4 within 1.0 mi
Projected returns pro-forma
10.0% appreciation · 3.0% rent growth · sell at horizon
- IRR
- 24.3%
- Equity multiple
- 2.95×
- Total profit
- $98,071
- Equity at exit
- $162,158
- IRR
- 21.5%
- Equity multiple
- 6.73×
- Total profit
- $288,548
- Equity at exit
- $349,700
Cash invested: $50,400 (down + closing). Projections, not guarantees.
Landlord ↔ Tenant lean methodology
- Overall (STATE)
- 87 Strongly Landlord-Friendly
- State Tennessee
- 87 Strongly Landlord-Friendly · R+13
- County
- — inherits STATE
- City
- — inherits STATE
ZIP-level market 37031
- Home prices YoY
- 8.3%
- Active inventory
- 35
- Price-to-rent
- 11.0×
Monthly cashflow live
- Estimated rent
- $1,368 medium interval (Pro) →
- Mortgage (P&I)
- −$944
- Tax from tax record
- −$60 /mo · $721/yr
- Insurance
- −$75
- HOA
- −$0
- Vacancy / Maint / Mgmt
- −$287
- Net cashflow
- $2
Break-even live
UW: 25.0% down · 7.5% · 30yr · 1.5% tax · 5.0% vac · 8.0% maint · 8.0% mgmt
Financing live
Cash to close
- Down payment
- $45,000
- Closing costs
- $5,400
- Reserves months
- —
- Total cash needed
- —
Loan-product check · same deal, 3 products live
Conventional
25% down · 7.5% · 30yr
- Down + closing
- —
- Monthly P&I
- —
- Monthly cashflow
- —
- DSCR
- —
- Eligible?
- —
Personal DTI + credit; lowest rate.
DSCR
20% down · 8.5% · 30yr
- Down + closing
- —
- Monthly P&I
- —
- Monthly cashflow
- —
- DSCR
- —
- Eligible?
- —
No personal income docs; deal must DSCR.
Hard money
10% down · 12.0% · 12mo
- Down + closing
- —
- Monthly P&I
- —
- Monthly cashflow
- —
- DSCR
- —
- Eligible?
- —
Short-term bridge; refi at stabilization.
Listing history 18 events
-
2026-06-18days on market $180,000 Active 139 DOM
-
2026-06-17days on market $180,000 Active 138 DOM
-
2026-06-16days on market $180,000 Active 137 DOM
-
2026-06-15days on market $180,000 Active 136 DOM
-
2026-06-13days on market $180,000 Active 134 DOM
-
2026-06-09days on market $180,000 Active 130 DOM
-
2026-06-08days on market $180,000 Active 129 DOM
-
2026-06-07days on market $180,000 Active 128 DOM
-
2026-06-03days on market $180,000 Active 124 DOM
-
2026-06-02days on market $180,000 Active 123 DOM
-
2026-06-01days on market $180,000 Active 122 DOM
-
2026-05-31days on market $180,000 Active 121 DOM
-
2026-05-07status Active 280-char remark
Show marketing remark (280 chars)
FINANCING FELL THROUGH - BACK ON THE MARKET. This historic home is on 3.01 acres on a quiet, no-through street of other large properties. Property can be purchased AS-IS, but could be a gem with a little love! Tenant damaged the home, so it needs some tender love and care.
-
2026-04-13historical Active Under Contract 280-char remark
Show marketing remark (280 chars)
FINANCING FELL THROUGH - BACK ON THE MARKET. This historic home is on 3.01 acres on a quiet, no-through street of other large properties. Property can be purchased AS-IS, but could be a gem with a little love! Tenant damaged the home, so it needs some tender love and care.
-
2026-04-07status Active 280-char remark
Show marketing remark (280 chars)
FINANCING FELL THROUGH - BACK ON THE MARKET. This historic home is on 3.01 acres on a quiet, no-through street of other large properties. Property can be purchased AS-IS, but could be a gem with a little love! Tenant damaged the home, so it needs some tender love and care.
-
2026-04-07price $180,000 280-char remark
Show marketing remark (280 chars)
FINANCING FELL THROUGH - BACK ON THE MARKET. This historic home is on 3.01 acres on a quiet, no-through street of other large properties. Property can be purchased AS-IS, but could be a gem with a little love! Tenant damaged the home, so it needs some tender love and care.
-
2026-03-18historical Active Under Contract 280-char remark
Show marketing remark (280 chars)
FINANCING FELL THROUGH - BACK ON THE MARKET. This historic home is on 3.01 acres on a quiet, no-through street of other large properties. Property can be purchased AS-IS, but could be a gem with a little love! Tenant damaged the home, so it needs some tender love and care.
-
2026-01-30$200,000 Active 280-char remark
Show marketing remark (280 chars)
FINANCING FELL THROUGH - BACK ON THE MARKET. This historic home is on 3.01 acres on a quiet, no-through street of other large properties. Property can be purchased AS-IS, but could be a gem with a little love! Tenant damaged the home, so it needs some tender love and care.
ⓘ Source: listings_history table (triggers on properties + properties_extension) + one-shot
backfill from property_details.listing_events for pre-trigger history.
Tax reassessment forecast TN · Resets to sale price
- Current annual tax
- $721 · $60/mo
- Projected year-2 tax
- $1,278 · $106/mo
- Expected delta
- +$557/yr (+$46/mo · 77.3%)
ⓘ Screening estimate from a state-policy table — verify with the county assessor before closing.
Climate risk First Street
- Flood 1/10 Low FEMA zone X (unshaded) · 0% chance over 30 yrs
- Wildfire 4/10 Moderate
- Heat 5/10 Major 7 d/yr ≥107°F today · 19 d/yr by 30 yrs out
- Wind 3/10 Moderate 6% chance of damaging wind over 30 yrs
- Air quality 2/10 Low 0 unhealthy d/yr today · 2 by 30 yrs out
Nearby sold comps map
Loading sold comps map…
Walkable amenities ~0.75 mi
Loading nearby amenities…
Taxation est. · year 1
- Rental income
- $16,419
- − Mortgage interest
- −$10,083
- − Property taxes
- −$721
- − Insurance
- −$900
- − Repairs & maintenance
- −$1,313
- − Management
- −$1,313
- − Depreciation
- −$5,236
- Taxable loss
- −$3,149
- Est. tax savings @ 24.0%
- +$756
- After-tax cash flow
- $778/yr
For passive investors: Depreciation is non-cash, so a rental often shows a tax loss while cash-flowing — sheltering income. Rental losses are passive: they offset passive income freely, and up to $25,000/yr can offset ordinary (W-2) income if you actively participate and your MAGI is under $100k (phasing out to $0 by $150k); unused losses carry forward. On sale, claimed depreciation is recaptured at up to 25%, and gains may owe capital-gains tax (a 1031 exchange can defer both). Figures are a year-1 estimate at your 24.0% rate — not tax advice; consult a CPA.
Schools (NCES district)
- District
- Trousdale County
- NCES district ID
- 4704170
- Math proficiency
- 29% ▼ -26.00%
- Reading proficiency
- 33% ▼ -11.00%
- Median HH income
- $44,474
- Composite
- 26.49/100
- National rank
- #7207
- State rank
- #46 of 139 in TN
Livability — Hartsville/Trousdale County
No livability data for this city. (Only ~50 U.S. cities are tracked.)
Census & demographics
- Census place
- Hartsville/Trousdale County, TN
- City population
- 11,690
- Population (ZIP)
- 3,984
Population outlook (Trousdale County) Hauer SSP2
- Today (2025)
- 8,557 people
- By 2030
- 8,766 · +2.4%
- By 2040
- 9,076 · +6.1%
- By 2050
- 9,226 · +7.8%
- By 2075
- 9,391 · +9.7%
- By 2100
- 9,000 · +5.2%
Race, ethnicity, and origin ACS 2023
- Neighborhood character
- Predominantly White (91%)
- Race & ethnicity
- White 91% Two or more races 4% Hispanic / Latino 3% Black 2%
- Common ancestry
- Lithuanian 3% Serbian 2% Iranian 2%
- Foreign-born
- 2% · Canada
- Languages at home
- 97% English-only · Spanish 2%
Political lean MEDSL · Trousdale
- 2024 margin
- Solid R (+58.9) · D 20.1% · R 79.0%
- 2008→2024 swing
- -52.3pp toward R · 2008: -6.6pp · 2024: -58.9pp
- All cycles
- 2024: R+58.9 2020: R+48.1 2016: R+36.8 2012: R+12.8 2008: R+6.6
Not yet ingested
- Civics
- —
Market trends
- HPI YoY
- ▲ 28.67%
- Current HPI
- 372.3139
- Rent YoY
- —
- Metro
- —
- State GDP YoY
- ▲ 2.78%
- F500 in state
- 22
Industry mix (Fortune 500 HQ in TN)
| Industry | F500 HQs | Revenue |
|---|---|---|
| Healthcare | 3 | $91B |
|
||
| Retail | 3 | $72B |
|
||
| Transportation / Logistics | 1 | $88B |
|
||
| Paper / Packaging | 1 | $19B |
|
||
| Insurance | 1 | $13B |
|
||
| Energy | 1 | $12B |
|
||
Price history
-10.0% since first listed6 events — show timeline
- 2026-05-07 Relisted — REALTRACS as Distributed by MLS Grid
- 2026-04-13 Contingent — REALTRACS as Distributed by MLS Grid
- 2026-04-07 Relisted — REALTRACS as Distributed by MLS Grid
- 2026-04-07 Price Changed $180,000 REALTRACS as Distributed by MLS Grid
- 2026-03-18 Contingent — REALTRACS as Distributed by MLS Grid
- 2026-01-30 Listed $200,000 REALTRACS as Distributed by MLS Grid
Property tax history
+2.0%/yrLatest (2025): $721 · +5.6% YoY. Source: county tax records.
Cash-flow waterfall
monthlySold comps — $/sqft
last 12 mo · ≤1 miLoading sold comps…