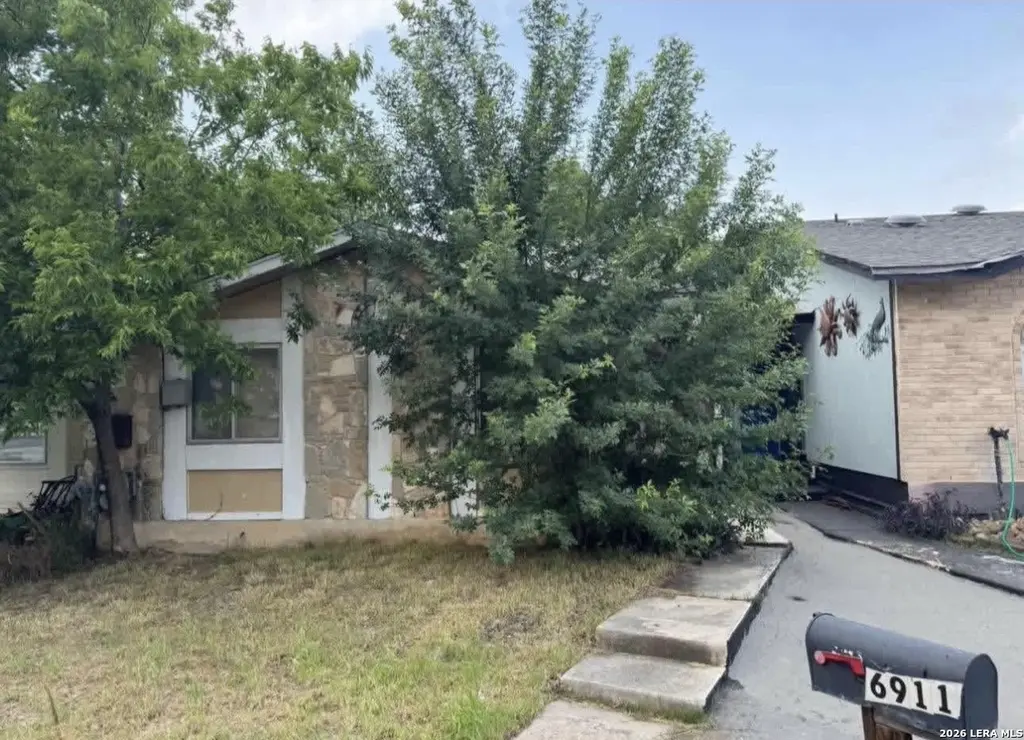
6911 Neston Dr · San Antonio, TX
Flood risk 1/10 · Minimal
- FEMA flood zone
- X (unshaded)
- Chance of flooding over 30 yrs
- 0.0%
- Est. flood insurance / yr
- $507 – $1,088
Fire risk 1/10 · Minimal
- Est. fire insurance / yr
- $1,222 – $2,270
Heat risk 8/10 · Major
- Hot days now (above 108°F)
- 7 days/yr
- Hot days in 30 yrs
- 22 days/yr
Wind risk 8/10 · Major
- Chance of severe wind over 30 yrs
- 80.0%
Air-quality risk 2/10 · Minimal
- Unhealthy air days now
- 0 days/yr
- Unhealthy air days in 30 yrs
- 1 days/yr
Risk factors via First Street. Map © Google.
Why this score? — see what drove the B+ grade
The composite is a weighted blend of 9 inputs, each scored 0–100. Each bar is that input's sub-score; the figure is the points it added to the 100-point composite (weight × sub-score).
- Cash flow +30.0/30.0
- ARV discount +15.0/15.0
- DSCR +10.0/10.0
- 1% rule +9.9/10.0
- Livability +4.0/5.0
- Schools +3.8/10.0
- Condition / age +2.5/5.0
- Rent growth +2.2/5.0
- Appreciation +0.0/10.0
$98,500
🖨 Deal sheet 📄 Offer letter ✓ Due diligence
Listing remarks
Investor Opportunity - Fix & Flip or Rental Hold! MORE PHOTOS COMING SOON. Located in San Antonio, 6911 Neston Drive presents a strong value-add opportunity for seasoned investors and rehabbers. This 3-bedroom, 2 full bath single-story home is being sold as-is and is priced to reflect the work needed. Renovations have already been started but remain incomplete-offering a head start for your next project while still allowing you to finish out to your specifications and maximize returns. With solid fundamentals and a functional layout, this property is well-suited for a fix-and-flip strategy or a long-term rental hold. Strong upside potential with the right vision. Ideal for investors l
Key facts
- Built 1981
- Listed 44 days
Property features AI
Finance
- Financial info: Down payment resource not available
- HOA & community: Subdivision legal name: CAMELOT II TH JD/NE
Exterior
- Parking: Driveway / on-site parking (details not specified)
- Security: Decorative security bars
- Utilities: City water and sewer; Electric service by CPS
- Home design: Pre-owned single-family home; Front of home faces south; Subdivision: CAMELOT II
- Construction: Approximately 45 years old; Wood exterior with rock/stone veneer; Composition roof; Slab foundation
- Exterior features: Patio slab; Partial fence; Decorative bars; Mature trees; Level lot; Street paved with sidewalks and alley access; city street
Interior
- Kitchen: Kitchen approximately 10 x 10; Dishwasher; Refrigerator
- Bedrooms: Master bedroom on lower level with walk-in closet and full bath; Second bedroom; Third bedroom; Master bedroom dimensions approximately 12 x 10; Bedroom 2 dimensions approximately 10 x 10; Bedroom 3 dimensions approximately 10 x 10
- Flooring: Ceramic tile floors; Laminate floors
- Bathrooms: Two full bathrooms; Master bath with tub/shower combination and single vanity; Master bath dimensions approximately 5 x 6
- Heating & cooling: Central heating (electric); Central air conditioning
- Interior features: Washer and dryer connections; Refrigerator included; Dishwasher included; One living area; Separate dining room; Utility room inside; All window coverings remain
- Laundry & utility: Washer connection; Dryer connection; Utility room inside
Neighborhood map
What this means for you Summary
Snapshot
- This is a 3-bed/2.0-bath townhouse listed at $98k.
Deal economics
- At list price, monthly cash flow is $421 ($5k/yr) — positive.
- The deal already cash-flows at list — no discount required.
- Meets the 1% rule at list price ($1k rent vs $98k).
- Recommended offer: $96k (3.0% below list) — sets the bar for market timing.
- Cap rate 11.4% vs local median 3.8% in San Antonio — top-decile yield for the area; either an underpriced asset or a hidden risk that comps aren't pricing in. Stress-test before assuming the spread holds.
Location & tenants
- Location reads 80/100 on livability (#31 in TX, #1,616 nationally) — a professional / high-income tenant draw. Strengths: amenities A+, commute A+, cost of living A+; Watch: crime F.
- North East ISD (urban): math 38% / reading 49% proficiency, ranked #276 of 826 in TX (top 33%) — families likely to look elsewhere, expect single-tenant / working-renter base with shorter leases.
- Zoned schools: Montgomery El (math 17% / reading 22%, grade F, #3,583 of 4,322 statewide, top 86%, 263 students, 92% FRL); Roosevelt H S (math 20% / reading 40%, grade F, #1,096 of 1,632 statewide, top 68%, 2,599 students, 72% FRL) — zoned schools average 82% FRL vs 41% district-wide (41 pts higher); higher-poverty schools than district average — tighter screening recommended.
- Zoned-school proficiency averages 25% at this address vs 44% district-wide (-19 pts) — the specific schools serving this property underperform the North East ISD average; the district grade overstates school quality for this exact location.
- Market conditions: Rents soft (-1.1%/yr); 202 active listings in the ZIP; 40 comparable units currently listed for rent nearby; rentals at typical pace (median 24d on market — plan ~3-4 weeks tenant-placement turnaround); 8,308 units permitted in Bexar County in 2024 (2,506 in 5+ unit buildings).
Forward outlook
- Local home prices are declining (-3.0%/yr); year-one equity from $681 of loan paydown is wiped out by about $3k of value loss. Plan a longer hold.
- Bexar County population projected at +50% by 2050 — long-run rental-demand tailwind backs the buy-and-hold thesis.
- At projected returns (-3.0% appreciation + 0.0% rent growth), your $28k cash investment doubles in ~9 years — after that, you're playing with house money.
Negotiation context
- It's been on market 44 days — a 3% lower offer ($96k) is reasonable based on typical stale-listing flexibility.
Risks & watch-outs
- Climate carrying-cost: severe wind risk, 80% chance of damaging wind over 30y; extreme-heat days projected 7→22/yr by 2055 (HVAC capex compounding) — expect insurance premiums to compound above CPI over the hold.
Questions for the listing agent
- It's been on market 44 days. Have you received any prior offers? Is the seller open to a 3% concession, seller financing, or rate buy-down credit?
- Is there a deadline driving the sale (1031 exchange, divorce, estate, relocation)? That informs how much negotiation room exists.
- Crime grade is F in this area — have there been break-ins, vandalism, or insurance claims at this property in the last 3 years? What carrier currently insures it and at what premium?
- What's the average days-on-market for RENTAL listings here right now (not sales)? A rising rental-DOM trend means longer vacancies and softer asking-rent achievability than the comps imply.
- What's the recent tenant-quality profile in this submarket — average credit score on applications, eviction rate, late-payment / NSF rate, and stable-employment percentage? A property-management company in the area should have these aggregated.
- How much new for-sale + rental construction is in the pipeline within 1–3 miles? Heavy new supply typically softens prices + rents 12–24 months out; constrained supply supports both.
Investment metrics
- 1% rule
- 1.49% ✓
- Cap rate
- 11.42%
- Cash-on-cash
- 18.32%
- DSCR
- 1.81
- GRM
- 5.6
CMA / ARV
- ARV (median comp)
- $136,138
- List price
- $98,500
- Delta
- -27.65%
- Verdict
- UNDERPRICED
- Comps
- 20 within 1.0 mi
Show comp detail 7 sales within ~0.75 mi
| Address | Dist | Beds/Ba | Sqft | Sold | Price | $/sf | Match |
|---|---|---|---|---|---|---|---|
| 6915 Oldham | 0.10mi | 3/2.0 | 1,048 (-4%) | 5mo | $139,900 | $133 | 85 |
| 6901 Oldham | 0.10mi | 3/1.0 | 1,032 (-5%) | 9mo | $142,500 | $138 | 75 |
| 7124 Oldham | 0.22mi | 3/2.0 | 1,074 (-1%) | 16mo | $170,000 | $158 | 75 |
| 7904 Broadwick | 0.23mi | 3/2.0 | 1,104 (+2%) | 17mo | $135,000 | $122 | 72 |
| 7901 Broadwick | 0.22mi | 2/2.0 (-1) | 986 (-9%) | 11mo | $125,000 | $127 | 60 |
| 8002 Mallow | 0.24mi | 3/2.0 | 1,177 (+8%) | 22mo | $100,000 | $85 | 57 |
| 7009 Glen Mist | 0.63mi | 2/2.0 (-1) | 1,232 (+13%) | 3mo | $60,000 | $49 | 41 |
Match score weights: distance 35% · size 25% · config 20% · recency 20%. Top-matched comps best support the ARV.
Projected returns pro-forma
-3.0% appreciation · 0.0% rent growth · sell at horizon
- IRR
- 6.4%
- Equity multiple
- 1.24×
- Total profit
- $6,612
- Equity at exit
- $14,687
- IRR
- 12.8%
- Equity multiple
- 1.87×
- Total profit
- $23,910
- Equity at exit
- $8,516
Cash invested: $27,580 (down + closing). Projections, not guarantees.
Landlord ↔ Tenant lean methodology
- Overall (STATE)
- 87 Strongly Landlord-Friendly
- State Texas
- 87 Strongly Landlord-Friendly · R+5
- County
- — inherits STATE
- City
- — inherits STATE
ZIP-level market 78239
- Home prices YoY
- -5.9%
- Rents YoY
- -1.1%
- Active inventory
- 202
- Price-to-rent
- 5.6×
Monthly cashflow live
- Estimated rent
- $1,466 high interval (Pro) →
- Mortgage (P&I)
- −$517
- Tax from tax record
- −$180 /mo · $2,155/yr
- Insurance
- −$41
- HOA
- −$0
- Vacancy / Maint / Mgmt
- −$308
- Net cashflow
- $421
Break-even live
UW: 25.0% down · 7.5% · 30yr · 1.5% tax · 5.0% vac · 8.0% maint · 8.0% mgmt
Financing live
Cash to close
- Down payment
- $24,625
- Closing costs
- $2,955
- Reserves months
- —
- Total cash needed
- —
Loan-product check · same deal, 3 products live
Conventional
25% down · 7.5% · 30yr
- Down + closing
- —
- Monthly P&I
- —
- Monthly cashflow
- —
- DSCR
- —
- Eligible?
- —
Personal DTI + credit; lowest rate.
DSCR
20% down · 8.5% · 30yr
- Down + closing
- —
- Monthly P&I
- —
- Monthly cashflow
- —
- DSCR
- —
- Eligible?
- —
No personal income docs; deal must DSCR.
Hard money
10% down · 12.0% · 12mo
- Down + closing
- —
- Monthly P&I
- —
- Monthly cashflow
- —
- DSCR
- —
- Eligible?
- —
Short-term bridge; refi at stabilization.
Rent comps 40 comps
| Address | Beds | Baths | Sqft | Rent | $/sqft | DOM | Units | Dist |
|---|---|---|---|---|---|---|---|---|
| 6918 Stockport San Antonio, TX | 3.0 | 2.0 | 1390 | $1,050 | $0.76 | 43d | 1 | 0.11mi |
| 8318 Tuxford San Antonio, TX | 4.0 | 2.0 | 1452 | $1,700 | $1.17 | 4d | 1 | 0.12mi |
| 6814 Oldham San Antonio, TX | 3.0 | 2.0 | 1238 | $1,300 | $1.05 | 24d | 1 | 0.16mi |
| 7923 Langport San Antonio, TX | 3.0 | 2.0 | 1095 | $1,800 | $1.64 | 43d | 1 | 0.18mi |
| 6733 Montgomery Dr San Antonio, TX | 3.0 | 2.0 | 1150 | $860 | $0.75 | 43d | 2 | 0.21mi |
| 7138 Brecon San Antonio, TX | 3.0 | 2.5 | 1276 | $1,065 | $0.83 | 43d | 1 | 0.24mi |
| 8259 Montgomery Oak San Antonio, TX | 3.0 | 2.0 | 1152 | $1,250 | $1.09 | 43d | 5 | 0.28mi |
| 7904 Mallow San Antonio, TX | 3.0 | 2.0 | 1135 | $1,145 | $1.01 | 15d | 1 | 0.29mi |
| 7812 Broadwick San Antonio, TX | 2.0 | 1.0 | 884 | $1,075 | $1.22 | 17d | 1 | 0.31mi |
| 7809 Sarepto San Antonio, TX | 2.0 | 2.0 | 1152 | $950 | $0.82 | 24d | 1 | 0.32mi |
| 7006 Glen Grv San Antonio, TX | 3.0 | 2.0 | 1036 | $1,495 | $1.44 | 43d | 1 | 0.35mi |
| 7210 John Palmer Dr Unit 101 San Antonio, TX | 3.0 | 2.5 | 1426 | $1,700 | $1.19 | 24d | 1 | 0.37mi |
| 7210 John Palmer Dr Unit 101 San Antonio, TX | 3.0 | 2.5 | 1426 | $1,650 | $1.16 | 16d | 1 | 0.37mi |
| 6607 Benhill San Antonio, TX | 3.0 | 2.0 | 1318 | $2,000 | $1.52 | 22d | 1 | 0.40mi |
| 8310 Hastings San Antonio, TX | 2.0 | 1.0 | 1315 | $1,450 | $1.10 | 24d | 1 | 0.40mi |
| 6811 Avila San Antonio, TX | 3.0 | 2.0 | 1260 | $1,555 | $1.23 | 20d | 1 | 0.43mi |
| 8215 Littleport San Antonio, TX | 3.0 | 2.0 | 1344 | $1,600 | $1.19 | 17d | 1 | 0.43mi |
| 8350 Hastings San Antonio, TX | 3.0 | 2.0 | 1247 | $2,000 | $1.60 | 43d | 1 | 0.50mi |
| 7643 Glen Shire San Antonio, TX | 3.0 | 2.0 | 868 | $1,475 | $1.70 | 24d | 1 | 0.54mi |
| 7603 Glen Vis San Antonio, TX | 3.0 | 2.0 | 980 | $1,200 | $1.22 | 7d | 1 | 0.56mi |
| 7662 Oak Chase San Antonio, TX | 3.0 | 2.0 | 1250 | $1,200 | $0.96 | 11d | 1 | 0.57mi |
| 7664 Oak Chase San Antonio, TX | 3.0 | 2.0 | 1250 | $1,350 | $1.08 | 7d | 1 | 0.57mi |
| 7660 Oak Chase San Antonio, TX | 3.0 | 2.0 | 1250 | $1,200 | $0.96 | 11d | 1 | 0.57mi |
| 7658 Oak Chase San Antonio, TX | 3.0 | 2.0 | 1250 | $1,350 | $1.08 | 7d | 1 | 0.57mi |
| 7650 Oak Chase Unit 7650 San Antonio, TX | 4.0 | 2.0 | 1250 | $1,650 | $1.32 | 43d | 1 | 0.58mi |
| 9034 (15/16) Glen Shadow Dr San Antonio, TX | 3.0 | 2.5 | 1225 | $1,550 | $1.27 | 2d | 1 | 0.58mi |
| 9034 (15/16) Glen Shadow Dr San Antonio, TX | 3.0 | 2.5 | 1225 | $1,400 | $1.14 | 43d | 1 | 0.58mi |
| 6721 Brothers Ln Unit 6721 San Antonio, TX | 4.0 | 2.0 | 1250 | $1,300 | $1.04 | 16d | 1 | 0.59mi |
| 6721 Brothers Ln San Antonio, TX | 4.0 | 2.0 | 1250 | $1,300 | $1.04 | 7d | 1 | 0.59mi |
| 7636 Oak Chase Unit 1 San Antonio, TX | 3.0 | 2.0 | 1200 | $1,255 | $1.05 | 43d | 1 | 0.60mi |
| 7222 Glen Hvn San Antonio, TX | 4.0 | 2.0 | 1320 | $1,350 | $1.02 | 24d | 1 | 0.60mi |
| 7648 Windsor Oaks San Antonio, TX | 4.0 | 2.0 | 1500 | $1,295 | $0.86 | 24d | 1 | 0.61mi |
| 7651 Oak Chase San Antonio, TX | 3.0 | 3.5 | 1034 | $1,695 | $1.64 | 24d | 1 | 0.61mi |
| 8454 Braewick Dr San Antonio, TX | 2.0 | 2.0 | 784 | $900 | $1.15 | 16d | 1 | 0.64mi |
| 7318 Glen Trl San Antonio, TX | 3.0 | 2.0 | 1226 | $1,900 | $1.55 | 43d | 1 | 0.66mi |
| 8429 Braewick Dr San Antonio, TX | 2.0 | 2.0 | 1088 | $1,200 | $1.10 | 2d | 1 | 0.66mi |
| 7613 Oak Chase San Antonio, TX | 3.0 | 2.0 | 1200 | $1,100 | $0.92 | 43d | 1 | 0.66mi |
| 7326 Glen Trl San Antonio, TX | 4.0 | 2.0 | 1370 | $1,549 | $1.13 | 3d | 1 | 0.68mi |
| 7614 Glen Hurst San Antonio, TX | 3.0 | 1.0 | 1100 | $1,400 | $1.27 | 2d | 1 | 0.68mi |
| 8219 Glen Lark San Antonio, TX | 4.0 | 2.0 | 1260 | $1,250 | $0.99 | 22d | 1 | 0.69mi |
Listing history 16 events
-
2026-06-18days on market $98,500 Active 44 DOM
-
2026-06-17days on market $98,500 Active 43 DOM
-
2026-06-16days on market $98,500 Active 42 DOM
-
2026-06-13days on market $98,500 Active 39 DOM
-
2026-06-13days on market $98,500 Active 38 DOM
-
2026-06-09days on market $98,500 Active 35 DOM
-
2026-06-08days on market $98,500 Active 34 DOM
-
2026-06-07days on market $98,500 Active 33 DOM
-
2026-06-04days on market $98,500 Active 30 DOM
-
2026-06-03days on market $98,500 Active 29 DOM
-
2026-06-02days on market $98,500 Active 28 DOM
-
2026-06-01days on market $98,500 Active 27 DOM
-
2026-05-31days on market $98,500 Active 26 DOM
-
2026-05-05$110,000 New 929-char remark
-
2006-01-06soldstatus
-
1987-02-01soldstatus
ⓘ Source: listings_history table (triggers on properties + properties_extension) + one-shot
backfill from property_details.listing_events for pre-trigger history.
Tax reassessment forecast TX · Resets to sale price
- Current annual tax
- $2,155 · $180/mo
- Projected year-2 tax
- $2,155 · $180/mo
- Expected delta
- $0/yr ($0/mo · 0.0%)
ⓘ Screening estimate from a state-policy table — verify with the county assessor before closing.
Climate risk First Street
- Flood 1/10 Low FEMA zone X (unshaded) · 0% chance over 30 yrs
- Wildfire 1/10 Low
- Heat 8/10 Severe 7 d/yr ≥108°F today · 22 d/yr by 30 yrs out
- Wind 8/10 Severe 80% chance of damaging wind over 30 yrs
- Air quality 2/10 Low 0 unhealthy d/yr today · 1 by 30 yrs out
Nearby sold comps map
Loading sold comps map…
Walkable amenities ~0.75 mi
Loading nearby amenities…
Taxation est. · year 1
- Rental income
- $17,592
- − Mortgage interest
- −$5,518
- − Property taxes
- −$2,155
- − Insurance
- −$492
- − Repairs & maintenance
- −$1,407
- − Management
- −$1,407
- − Depreciation
- −$2,865
- Taxable income
- $3,747
- Est. tax owed @ 24.0%
- −$899
- After-tax cash flow
- $4,152/yr
For passive investors: Depreciation is non-cash, so a rental often shows a tax loss while cash-flowing — sheltering income. Rental losses are passive: they offset passive income freely, and up to $25,000/yr can offset ordinary (W-2) income if you actively participate and your MAGI is under $100k (phasing out to $0 by $150k); unused losses carry forward. On sale, claimed depreciation is recaptured at up to 25%, and gains may owe capital-gains tax (a 1031 exchange can defer both). Figures are a year-1 estimate at your 24.0% rate — not tax advice; consult a CPA.
Schools (NCES district)
- District
- North East ISD
- NCES district ID
- 4832940
- Math proficiency
- 38% ▼ -14.00%
- Reading proficiency
- 49% ▼ -4.00%
- Median HH income
- $57,715
- Composite
- 38.1/100
- National rank
- #4276
- State rank
- #276 of 826 in TX
Livability — San Antonio
- Score
- 80/100
- State rank
- #31
- US rank
- #1616
Category grades
Schools grade is shown separately in the Schools card above.
Census & demographics
- County
- Bexar County · 1,990,555 people
- City population
- 1,806,925
- Metro
- San Antonio-New Braunfels, TX
- Population (ZIP)
- 28,609
- Household income
- $70,098
- Rent vs Own
- Severe rent burden
- 488.0
Population outlook (Bexar County) Hauer SSP2
- Today (2025)
- 2,336,851 people
- By 2030
- 2,560,728 · +9.6%
- By 2040
- 3,020,569 · +29.3%
- By 2050
- 3,493,522 · +49.5%
- By 2075
- 4,668,459 · +99.8%
- By 2100
- 5,533,242 · +136.8%
Race, ethnicity, and origin ACS 2023
- Neighborhood character
- Diverse neighborhood (Simpson 0.66)
- Race & ethnicity
- Hispanic / Latino 47% White 30% Two or more races 20% Black 16% Asian 4% Pacific Islander 2%
- Hispanic origin (detail)
- Mexican 38% Puerto Rican 4%
- Common ancestry
- Lithuanian 2% Romanian 1% Slovak 1%
- Foreign-born
- 13% · Canada, Vietnam, Jamaica
- Languages at home
- 72% English-only · Spanish 24% Vietnamese 1% Chinese 1%
Political lean MEDSL · Bexar
- 2024 margin
- Lean D (+9.8) · D 54.3% · R 44.6% · Other 1.1%
- 2008→2024 swing
- +4.2pp toward D · 2008: 5.6pp · 2024: 9.8pp
- All cycles
- 2024: D+9.8 2020: D+18.2 2016: D+13.5 2012: D+4.6 2008: D+5.6
Not yet ingested
- Civics
- —
Market trends
- HPI YoY
- ▼ -15.13%
- Current HPI
- 242.1272
- Rent YoY
- ▼ -1.05%
- Metro
- San Antonio-New Braunfels, TX
- State GDP YoY
- ▲ 3.95%
- F500 in state
- 110
Industry mix (Fortune 500 HQ in TX)
| Industry | F500 HQs | Revenue |
|---|---|---|
| Energy | 16 | $1,198B |
|
||
| Technology | 5 | $198B |
|
||
| Engineering / Construction | 4 | $72B |
|
||
| Energy Services | 3 | $60B |
|
||
| Utilities | 3 | $41B |
|
||
| Healthcare | 2 | $330B |
|
||
Price history
-10.5% since first listed4 events — show timeline
- 2026-05-20 Price Changed $98,500 LERA
- 2026-05-05 Listed $110,000 LERA
- 2006-01-06 Sold (Public Records) — Public Records
- 1987-02-01 Sold (Public Records) — Public Records
Property tax history
+11.8%/yrLatest (2025): $2,155 · -1.0% YoY. Source: county tax records.
Cash-flow waterfall
monthlySold comps — $/sqft
last 12 mo · ≤1 miLoading sold comps…