202 W 14 Ave Ave · Tyndall, SD
Flood risk 6/10 · Moderate
- FEMA flood zone
- —
- Chance of flooding over 30 yrs
- 0.7%
- Est. flood insurance / yr
- —
Fire risk 3/10 · Minor
- Est. fire insurance / yr
- $1,342 – $2,492
Heat risk 3/10 · Minor
- Hot days now (above 102°F)
- 7 days/yr
- Hot days in 30 yrs
- 14 days/yr
Wind risk 2/10 · Minimal
- Chance of severe wind over 30 yrs
- —
Air-quality risk 2/10 · Minimal
- Unhealthy air days now
- 1 days/yr
- Unhealthy air days in 30 yrs
- 1 days/yr
Risk factors via First Street. Map © Google.
Why this score? — see what drove the B grade
The composite is a weighted blend of 9 inputs, each scored 0–100. Each bar is that input's sub-score; the figure is the points it added to the 100-point composite (weight × sub-score).
- Cash flow +30.0/30.0
- 1% rule +10.0/10.0
- DSCR +10.0/10.0
- ARV discount +7.5/15.0
- Appreciation +5.0/10.0
- Schools +4.7/10.0
- Livability +3.4/5.0
- Rent growth +2.5/5.0
- Condition / age +1.0/5.0
$44,500
🖨 Deal sheet (PDF) 📄 Offer letter ✓ Due diligence
Listing remarks MLS
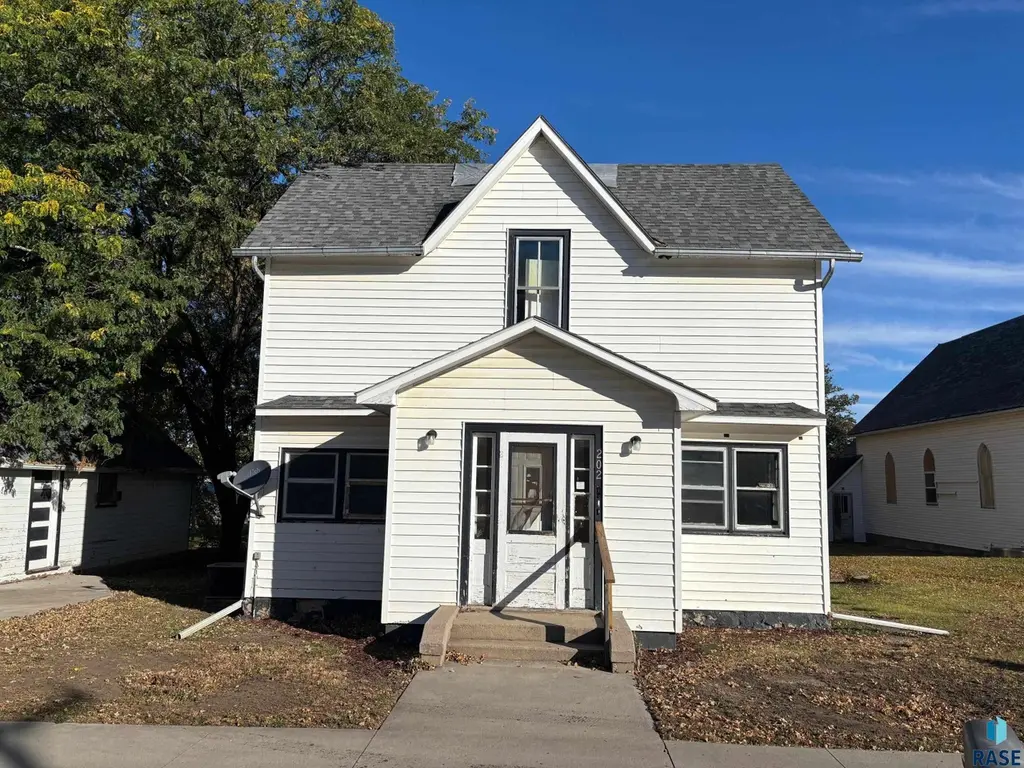
Four bedroom, one bath house in the small town of Tyndall. Close to amenities in town. Call your real estate agent to have a look.
Key facts
- 0.26 acre lot
- 2 garage spots
- Built 1900
Neighborhood map
What this means for you Summary
Snapshot
- This is a 4-bed/1.0-bath single-family listed at $44k. Condition is rated poor.
Deal economics
- At list price, monthly cash flow is $712 ($9k/yr) — positive.
- The deal already cash-flows at list — no discount required.
- Meets the 1% rule at list price ($1k rent vs $44k).
- Recommended offer: $39k (12.0% below list) — sets the bar for market timing.
Location & tenants
- Location reads 67/100 on livability (#92 in SD) — a middle-class / working-renter tenant base. Strengths: crime A+, cost of living A+, housing A+; Watch: employment D, amenities F, commute F.
- Bon Homme School District 04-2 (rural): math 55% / reading 56% proficiency, ranked #15 of 59 in SD (top 25%) — acceptable for families but not a draw, mixed tenant base, ~2y average lease.
- Zoned schools: Bon Homme Middle School - 02 (math 52% / reading 57%, grade B-, #36 of 143 statewide, top 29%, 110 students, 24% FRL); Bon Homme High School - 01 (math 10% / reading 50%, grade F, #129 of 151 statewide, top 89%, 136 students, 24% FRL).
- Zoned-school proficiency averages 42% at this address vs 56% district-wide (-13 pts) — the specific schools serving this property underperform the Bon Homme School District 04-2 average; the district grade overstates school quality for this exact location.
- Market conditions: 8 active listings in the ZIP; 18 units permitted in Bon Homme County in 2024 (0 in 5+ unit buildings).
Forward outlook
- In year one you build about $2k of equity ($308 loan paydown + $1k appreciation (3.0% local appreciation)).
- At projected returns (3.0% appreciation + 3.0% rent growth), your $12k cash investment doubles in ~2 years — after that, you're playing with house money.
Negotiation context
- It's been on market 237 days — a 12% lower offer ($39k) is reasonable based on typical stale-listing flexibility.
- 2 sale attempts; this cycle's ask has dropped $38k (46%) from the opening price — seller is motivated, your offer sets the floor, not the list.
Risks & watch-outs
- Watch-outs: built in 1900 — expect roof / HVAC / electrical / plumbing capex.
- Climate carrying-cost: major flood risk — expect insurance premiums to compound above CPI over the hold.
Questions for the listing agent
- It's been on market 237 days. Have you received any prior offers? Is the seller open to a 12% concession, seller financing, or rate buy-down credit?
- Have any recent inspections been done? Can we get a copy of the seller's disclosures and any deferred-maintenance estimates?
- Built in 1900 — when were the roof, HVAC, electrical panel, plumbing, and water heater last replaced?
- Why hasn't it sold? Are there any deal-killer items the seller is aware of (foundation, flood, title, zoning, code violations)?
- Is there a deadline driving the sale (1031 exchange, divorce, estate, relocation)? That informs how much negotiation room exists.
- What's the average days-on-market for RENTAL listings here right now (not sales)? A rising rental-DOM trend means longer vacancies and softer asking-rent achievability than the comps imply.
- What's the recent tenant-quality profile in this submarket — average credit score on applications, eviction rate, late-payment / NSF rate, and stable-employment percentage? A property-management company in the area should have these aggregated.
- How much new for-sale + rental construction is in the pipeline within 1–3 miles? Heavy new supply typically softens prices + rents 12–24 months out; constrained supply supports both.
Investment metrics
- 1% rule
- 2.90% ✓
- Cap rate
- 25.49%
- Cash-on-cash
- 68.56%
- DSCR
- 4.05
- GRM
- 2.9
CMA / ARV
- ARV (median comp)
- $166,300
- List price
- $44,500
- Delta
- -73.24%
- Verdict
- UNDERPRICED
- Comps
- 20 within 1.0 mi
Show comp detail 7 sales within ~0.75 mi
| Address | Dist | Beds/Ba | Sqft | Sold | Price | $/sf | Match |
|---|---|---|---|---|---|---|---|
| 300 E 14th Ave | 0.29mi | 5/2.0 (+1) | 1,735 (+5%) | 3mo | $245,750 | $142 | 67 |
| 302 E 14th Ave | 0.30mi | 3/1.5 (-1) | 1,534 (-7%) | 2mo | $165,500 | $108 | 65 |
| 1106 Laurel St | 0.25mi | 3/2.0 (-1) | 1,616 (-2%) | 13mo | $225,000 | $139 | 64 |
| 101 E 11th Ave | 0.26mi | 3/2.0 (-1) | 1,680 (+1%) | 18mo | $119,000 | $71 | 61 |
| 401 W 16th St | 0.19mi | 3/2.0 (-1) | 1,780 (+8%) | 11mo | $206,500 | $116 | 60 |
| 1409 Pine St | 0.38mi | 3/1.0 (-1) | 1,544 (-7%) | 17mo | $308,000 | $199 | 52 |
| 1411 Birch St | 0.43mi | 3/2.0 (-1) | 1,568 (-5%) | 14mo | $152,000 | $97 | 50 |
Match score weights: distance 35% · size 25% · config 20% · recency 20%. Top-matched comps best support the ARV.
Projected returns pro-forma
3.0% appreciation · 3.0% rent growth · sell at horizon
- IRR
- 73.2%
- Equity multiple
- 5.07×
- Total profit
- $50,722
- Equity at exit
- $20,009
- IRR
- 72.8%
- Equity multiple
- 10.39×
- Total profit
- $117,053
- Equity at exit
- $30,836
Cash invested: $12,460 (down + closing). Projections, not guarantees.
Landlord ↔ Tenant lean methodology
- Overall (STATE)
- 83 Strongly Landlord-Friendly
- State South Dakota
- 83 Strongly Landlord-Friendly · R+16
- County
- — inherits STATE
- City
- — inherits STATE
ZIP-level market 57066
- Active inventory
- 8
- Price-to-rent
- 2.9×
Monthly cashflow live
- Estimated rent
- $1,290 medium interval (Pro) →
- Mortgage (P&I)
- −$233
- Tax est. 1.5%
- −$56 /mo · $668/yr
- Insurance
- −$19
- HOA
- −$0
- Vacancy / Maint / Mgmt
- −$271
- Net cashflow
- $712
Break-even live
Sensitivity live
| Price | -10% $743 | -5% $727 | +0% $712 | +5% $697 | +10% $681 |
|---|---|---|---|---|---|
| Rent | -10% $610 | -5% $661 | +0% $712 | +5% $763 | +10% $814 |
| Rate | -1.0pp $734 | -0.5pp $723 | base $712 | +0.5pp $700 | +1.0pp $689 |
UW: 25.0% down · 7.5% · 30yr · 1.5% tax · 5.0% vac · 8.0% maint · 8.0% mgmt
Financing live
Cash to close
- Down payment
- $11,125
- Closing costs
- $1,335
- Reserves months
- —
- Total cash needed
- —
Loan-product check · same deal, 3 products live
Conventional
25% down · 7.5% · 30yr
- Down + closing
- —
- Monthly P&I
- —
- Monthly cashflow
- —
- DSCR
- —
- Eligible?
- —
Personal DTI + credit; lowest rate.
DSCR
20% down · 8.5% · 30yr
- Down + closing
- —
- Monthly P&I
- —
- Monthly cashflow
- —
- DSCR
- —
- Eligible?
- —
No personal income docs; deal must DSCR.
Hard money
10% down · 12.0% · 12mo
- Down + closing
- —
- Monthly P&I
- —
- Monthly cashflow
- —
- DSCR
- —
- Eligible?
- —
Short-term bridge; refi at stabilization.
Listing history 23 events
-
2026-06-21days on market $44,500 Active 237 DOM
-
2026-06-21days on market $44,500 Active 236 DOM
-
2026-06-18days on market $44,500 Active 234 DOM
-
2026-06-17days on market $44,500 Active 233 DOM
-
2026-06-16days on market $44,500 Active 232 DOM
-
2026-06-15days on market $44,500 Active 231 DOM
-
2026-06-13days on market $44,500 Active 229 DOM
-
2026-06-12pricedays on market $44,500 Active 228 DOM
-
2026-06-09days on market $51,500 Active 225 DOM
-
2026-06-08days on market $51,500 Active 224 DOM
-
2026-06-08days on market $51,500 Active 223 DOM
-
2026-06-05days on market $51,500 Active 221 DOM
-
2026-06-04days on market $51,500 Active 219 DOM
-
2026-06-02days on market $51,500 Active 218 DOM
-
2026-06-01days on market $51,500 Active 217 DOM
-
2026-05-31days on market $51,500 Active 216 DOM
-
2026-05-10price $51,500 130-char remark
Show marketing remark (130 chars)
Four bedroom, one bath house in the small town of Tyndall. Close to amenities in town. Call your real estate agent to have a look.
-
2026-01-21price $68,500 130-char remark
Show marketing remark (130 chars)
Four bedroom, one bath house in the small town of Tyndall. Close to amenities in town. Call your real estate agent to have a look.
-
2025-12-23price $73,000 130-char remark
Show marketing remark (130 chars)
Four bedroom, one bath house in the small town of Tyndall. Close to amenities in town. Call your real estate agent to have a look.
-
2025-11-25price $79,000 130-char remark
Show marketing remark (130 chars)
Four bedroom, one bath house in the small town of Tyndall. Close to amenities in town. Call your real estate agent to have a look.
-
2025-10-27$83,000 Active 130-char remark
Show marketing remark (130 chars)
Four bedroom, one bath house in the small town of Tyndall. Close to amenities in town. Call your real estate agent to have a look.
-
2025-04-18historical
-
2025-02-18$110,000 Active - New
ⓘ Source: listings_history table (triggers on properties + properties_extension) + one-shot
backfill from property_details.listing_events for pre-trigger history.
Climate risk First Street
- Flood 6/10 Major 70% chance over 30 yrs
- Wildfire 3/10 Moderate
- Heat 3/10 Moderate 7 d/yr ≥102°F today · 14 d/yr by 30 yrs out
- Wind 2/10 Low
- Air quality 2/10 Low 1 unhealthy d/yr today · 1 by 30 yrs out
Nearby sold comps map
Loading sold comps map…
Walkable amenities ~0.75 mi
Loading nearby amenities…
Taxation est. · year 1
- Rental income
- $15,485
- − Mortgage interest
- −$2,493
- − Property taxes
- −$668
- − Insurance
- −$222
- − Repairs & maintenance
- −$1,239
- − Management
- −$1,239
- − Depreciation
- −$1,295
- Taxable income
- $8,330
- Est. tax owed @ 24.0%
- −$1,999
- After-tax cash flow
- $6,544/yr
For passive investors: Depreciation is non-cash, so a rental often shows a tax loss while cash-flowing — sheltering income. Rental losses are passive: they offset passive income freely, and up to $25,000/yr can offset ordinary (W-2) income if you actively participate and your MAGI is under $100k (phasing out to $0 by $150k); unused losses carry forward. On sale, claimed depreciation is recaptured at up to 25%, and gains may owe capital-gains tax (a 1031 exchange can defer both). Figures are a year-1 estimate at your 24.0% rate — not tax advice; consult a CPA.
Condition & rehab AI · 1 photo
This home requires extensive repairs and maintenance, including roof and siding repairs, and landscaping improvements. Significant investment is needed to bring it up to a livable condition.
Repairs flagged
- Major roof — Missing or damaged shingles
- Major exterior siding — Weathered siding
- Major landscaping — Overgrown and unkempt
Value-add opportunities
- Both repair roof — Critical to safety and appearance
- Both repair exterior siding — Improves curb appeal and structural integrity
- Both landscaping — Enhances curb appeal and property value
Renovation cost estimate screening
| Repair item | Severity | Est. cost |
|---|---|---|
| roof · Missing or damaged shingles | Major | $15,000–50,000 |
| exterior siding · Weathered siding | Major | $15,000–50,000 |
| landscaping · Overgrown and unkempt | Major | $15,000–50,000 |
| Total estimated repair cost · 3 items | $45,000–150,000 |
Value-add ROI direction
- Both repair roof — Critical to safety and appearance ↑
- Both repair exterior siding — Improves curb appeal and structural integrity ↑
- Both landscaping — Enhances curb appeal and property value ↑
ⓘ Cost ranges are severity-bucket heuristics (US national rule-of-thumb). Get contractor quotes + a written scope before underwriting a rehab budget.
Schools (NCES district)
- District
- Bon Homme School District 04-2
- NCES district ID
- 4607400
- Math proficiency
- 55% ▲ 9.00%
- Reading proficiency
- 56% ▬ 0.00%
- Median HH income
- $44,226
- Composite
- 46.8/100
- National rank
- #2380
- State rank
- #15 of 59 in SD
Livability — Tyndall
- Score
- 67/100
- State rank
- #92
- US rank
- #10144
Category grades
Schools grade is shown separately in the Schools card above.
Census & demographics
- Census place
- Tyndall, SD
- City population
- 1,401
- Population (ZIP)
- 1,401
Population outlook (Bon Homme County) Hauer SSP2
- Today (2025)
- 6,947 people
- By 2030
- 6,956 · +0.1%
- By 2040
- 6,978 · +0.4%
- By 2050
- 7,140 · +2.8%
- By 2075
- 8,411 · +21.1%
- By 2100
- 10,108 · +45.5%
Race, ethnicity, and origin ACS 2023
- Neighborhood character
- Predominantly White (96%)
- Race & ethnicity
- White 96% Native American 2% Two or more races 1%
- Common ancestry
- Slovak 4% Iranian 3% Portuguese 2%
- Foreign-born
- 0%
- Languages at home
- 95% English-only · German/W. Germanic 3% Russian/Polish/Slavic 2%
Political lean MEDSL · Bon Homme
- 2024 margin
- Solid R (+51.4) · D 23.3% · R 74.7% · Other 2.0%
- 2008→2024 swing
- -40.6pp toward R · 2008: -10.9pp · 2024: -51.4pp
- All cycles
- 2024: R+51.4 2020: R+50.5 2016: R+47.1 2012: R+21.6 2008: R+10.9
Not yet ingested
- Civics
- —
Market trends
- HPI YoY
- —
- Current HPI
- —
- Rent YoY
- —
- Metro
- —
- State GDP YoY
- ▲ 0.70%
- F500 in state
- 2
Industry mix (Fortune 500 HQ in SD)
| Industry | F500 HQs | Revenue |
|---|---|---|
| Utilities | 1 | $1B |
|
||
Price history
-53.2% since first listed7 events — show timeline
- 2026-05-10 Price Changed $51,500 REALTOR® Association of the Sioux Empire
- 2026-01-21 Price Changed $68,500 REALTOR® Association of the Sioux Empire
- 2025-12-23 Price Changed $73,000 REALTOR® Association of the Sioux Empire
- 2025-11-25 Price Changed $79,000 REALTOR® Association of the Sioux Empire
- 2025-10-27 Listed $83,000 REALTOR® Association of the Sioux Empire
- 2025-04-18 Listing Removed — REALTOR® Association of the Sioux Empire
- 2025-02-18 Listed $110,000 REALTOR® Association of the Sioux Empire
Cash-flow waterfall
monthlySold comps — $/sqft
last 12 mo · ≤1 miLoading sold comps…