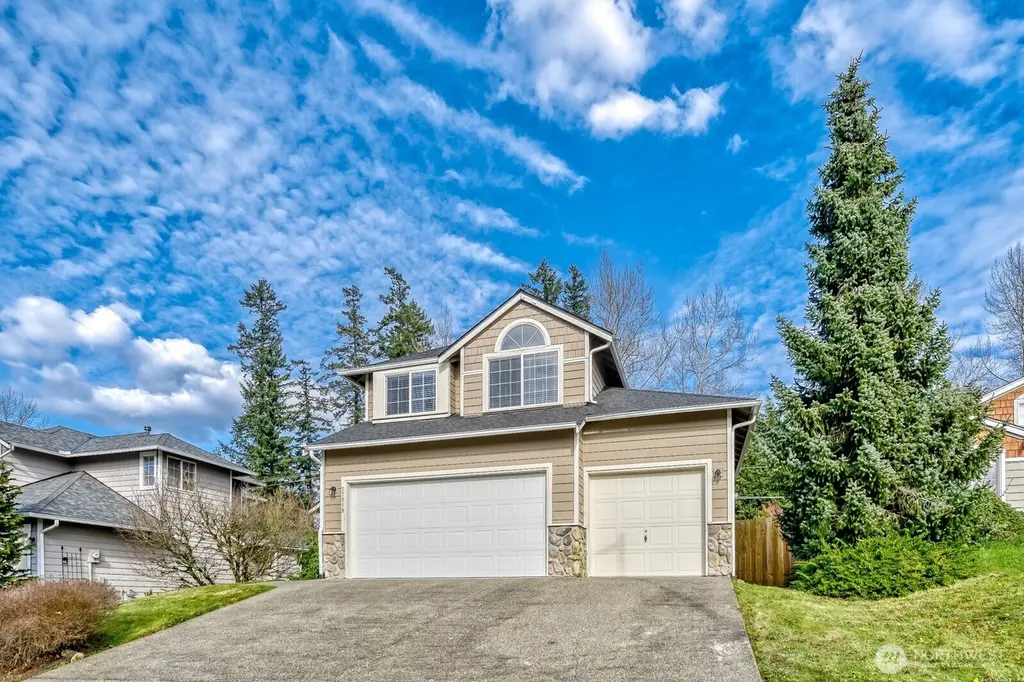
27910 227th Ct SE · Maple Valley, WA
Flood risk 1/10 · Minimal
- FEMA flood zone
- X (unshaded)
- Chance of flooding over 30 yrs
- 0.0%
- Est. flood insurance / yr
- $507 – $1,088
Fire risk 1/10 · Minimal
- Est. fire insurance / yr
- $604 – $1,122
Heat risk 2/10 · Minimal
- Hot days now (above 87°F)
- 7 days/yr
- Hot days in 30 yrs
- 15 days/yr
Wind risk 1/10 · Minimal
- Chance of severe wind over 30 yrs
- —
Air-quality risk 7/10 · Major
- Unhealthy air days now
- 11 days/yr
- Unhealthy air days in 30 yrs
- 16 days/yr
Risk factors via First Street. Map © Google.
Why this score? — see what drove the D grade
The composite is a weighted blend of 9 inputs, each scored 0–100. Each bar is that input's sub-score; the figure is the points it added to the 100-point composite (weight × sub-score).
- ARV discount +14.6/15.0
- Cash flow +6.7/30.0
- Schools +6.6/10.0
- Livability +4.2/5.0
- Rent growth +3.2/5.0
- Condition / age +2.5/5.0
- 1% rule +1.4/10.0
- DSCR +1.0/10.0
- Appreciation +0.0/10.0
$689,950
🖨 Deal sheet 📄 Offer letter ✓ Due diligence
Listing remarks
Beautiful 5-bedroom, 2.5-bath home located in the highly sought-after Elks Run neighborhood in Maple Valley! This spacious home features an open and inviting floor plan with abundant natural light, perfect for entertaining and everyday living. The kitchen boasts modern finishes, ample cabinetry, and a large island that flows seamlessly into the dining and living areas. Generously sized bedrooms, including a luxurious primary suite with a walk-in closet and private bath. Enjoy the landscaped yard and patio—ideal for relaxing or hosting gatherings. Conveniently located near parks, top-rated schools, and shopping. A must-see home in a desirable community!
Key facts
- 6,600 sq ft lot
- Garage
- Built 1998
Neighborhood map
What this means for you Summary
Snapshot
- This is a 5-bed/2.5-bath single-family listed at $690k.
Deal economics
- At list price, monthly cash flow is $-1k ($-13k/yr) — negative.
- To cash-flow at today's rent, offer at most $497k (27.9% below list).
- To meet the 1% rule (rent ≥ 1% of price), the offer needs to be $443k (35.8% below list).
- Recommended offer: $443k (35.8% below list) — sets the bar for 1% rule.
- Cap rate 4.4% vs local median 3.2% in Maple Valley — top-decile yield for the area; either an underpriced asset or a hidden risk that comps aren't pricing in. Stress-test before assuming the spread holds.
Location & tenants
- Location reads 85/100 on livability (#24 in WA, #461 nationally) — a professional / high-income tenant draw. Strengths: schools A+, employment A+, housing A+; Watch: cost of living F.
- Tahoma School District (suburban): math 68% / reading 76% proficiency, ranked #10 of 291 in WA (top 3%) — strong family-tenant draw, lease renewals of 3-5y typical; only 11% free/reduced lunch — higher-income household profile.
- Market conditions: Rents rising (+2.8%/yr); 221 active listings in the ZIP; 4 comparable units currently listed for rent nearby; rentals lingering (median 44d on market — plan ~5-8 weeks vacancy on turnover, expect pricing pressure); 50% of comp listings sitting > 30 days — soft ceiling on asking rent; high-income renter base; 10,555 units permitted in King County in 2024 (7,119 in 5+ unit buildings).
- This rent runs 35% of the median local income ($152k/yr) — at the standard rent-burdened threshold; future hikes will face affordability resistance.
Forward outlook
- Local home prices are declining (-3.0%/yr); year-one equity from $5k of loan paydown is wiped out by about $21k of value loss. Plan a longer hold.
- King County population projected at +44% by 2050 — long-run rental-demand tailwind backs the buy-and-hold thesis.
Negotiation context
- It's been on market 72 days — a 6% lower offer ($649k) is reasonable based on typical stale-listing flexibility.
- 2 sale attempts since 9y ago; this cycle's ask has dropped $100k (13%) from the opening price — seller is motivated, your offer sets the floor, not the list.
- Current owner paid $420k; list at $690k implies a 64% gain — meaningful room to come down on a strong offer.
Questions for the listing agent
- What do current leases actually rent for vs. the listed asking? Can we see a recent rent roll and the last 12 months of T-12 income?
- It's been on market 72 days. Have you received any prior offers? Is the seller open to a 36% concession, seller financing, or rate buy-down credit?
- What does the HOA fee cover, when was the last increase, and are there any pending special assessments or reserve-fund shortfalls?
- Why hasn't it sold? Are there any deal-killer items the seller is aware of (foundation, flood, title, zoning, code violations)?
- Is there a deadline driving the sale (1031 exchange, divorce, estate, relocation)? That informs how much negotiation room exists.
- Schools are A-rated — typically a magnet for longer-tenancy family renters. What's the average tenant stay here, and is there a school-zone premium baked into asking?
- The area grade is low — what's the realistic commute time and amenity access for the typical tenant pool here? Any planned neighborhood developments (good or bad) we should know about?
- What's the average days-on-market for RENTAL listings here right now (not sales)? A rising rental-DOM trend means longer vacancies and softer asking-rent achievability than the comps imply.
- What's the recent tenant-quality profile in this submarket — average credit score on applications, eviction rate, late-payment / NSF rate, and stable-employment percentage? A property-management company in the area should have these aggregated.
- How much new for-sale + rental construction is in the pipeline within 1–3 miles? Heavy new supply typically softens prices + rents 12–24 months out; constrained supply supports both.
Investment metrics
- 1% rule
- 0.64% ✗
- Cap rate
- 4.40%
- Cash-on-cash
- -6.77%
- DSCR
- 0.70
- GRM
- 13.0
CMA / ARV
- ARV (median comp)
- $818,617
- List price
- $689,950
- Delta
- -15.72%
- Verdict
- UNDERPRICED
- Comps
- 20 within 1.0 mi
Show comp detail 12 sales within ~0.75 mi
| Address | Dist | Beds/Ba | Sqft | Sold | Price | $/sf | Match |
|---|---|---|---|---|---|---|---|
| 22771 SE 277th Pl | 0.10mi | 4/2.5 (-1) | 2,250 (-0%) | 0mo | $775,000 | $344 | 89 |
| 27921 227th Ct SE | 0.04mi | 4/2.5 (-1) | 2,080 (-8%) | 3mo | $810,000 | $389 | 77 |
| 22375 SE 282nd Ln | 0.37mi | 4/2.5 (-1) | 2,260 (0%) | 2mo | $843,000 | $373 | 77 |
| 28328 229th Ave SE | 0.29mi | 4/2.5 (-1) | 2,220 (-2%) | 6mo | $720,000 | $324 | 73 |
| 28215 224th Ave SE | 0.36mi | 4/3.0 (-1) | 2,340 (+4%) | 3mo | $770,000 | $329 | 68 |
| 22442 SE 281st Ct | 0.23mi | 4/2.5 (-1) | 1,980 (-12%) | 9mo | $740,000 | $374 | 57 |
| 23326 SE 284th St | 0.51mi | 4/2.5 (-1) | 2,454 (+9%) | 7mo | $736,000 | $300 | 51 |
| 22429 SE 287th Pl | 0.56mi | 4/2.5 (-1) | 2,070 (-8%) | 5mo | $649,950 | $314 | 51 |
| 22906 SE 268th Pl | 0.70mi | 4/3.0 (-1) | 2,310 (+2%) | 8mo | $750,000 | $325 | 50 |
| 27456 237th Pl SE | 0.66mi | 4/2.5 (-1) | 2,042 (-10%) | 3mo | $735,000 | $360 | 46 |
| 23834 SE 284th St | 0.73mi | 5/3.0 | 2,560 (+13%) | 1mo | $865,000 | $338 | 41 |
| 21662 SE 283rd St | 0.68mi | 4/2.5 (-1) | 1,960 (-13%) | 8mo | $620,000 | $316 | 35 |
Match score weights: distance 35% · size 25% · config 20% · recency 20%. Top-matched comps best support the ARV.
Projected returns pro-forma
-3.0% appreciation · 2.76% rent growth · sell at horizon
- IRR
- -28.3%
- Equity multiple
- 0.06×
- Total profit
- $-182,355
- Equity at exit
- $102,874
- IRR
- -28.4%
- Equity multiple
- -0.31×
- Total profit
- $-252,743
- Equity at exit
- $59,654
Cash invested: $193,186 (down + closing). Projections, not guarantees.
Landlord ↔ Tenant lean methodology
- Overall (STATE)
- 28 Tenant-Leaning
- State Washington
- 28 Tenant-Leaning · D+8
- County
- — inherits STATE
- City
- — inherits STATE
ZIP-level market 98038
- Rents YoY
- 2.8%
- Active inventory
- 221
- Price-to-rent
- 13.0×
Monthly cashflow live
- Estimated rent
- $4,430 medium interval (Pro) →
- Mortgage (P&I)
- −$3,618
- Tax from tax record
- −$674 /mo · $8,092/yr
- Insurance
- −$287
- HOA
- −$10
- Vacancy / Maint / Mgmt
- −$930
- Net cashflow
- $-1,090
Break-even live
UW: 25.0% down · 7.5% · 30yr · 1.5% tax · 5.0% vac · 8.0% maint · 8.0% mgmt
Financing live
Cash to close
- Down payment
- $172,488
- Closing costs
- $20,698
- Reserves months
- —
- Total cash needed
- —
Loan-product check · same deal, 3 products live
Conventional
25% down · 7.5% · 30yr
- Down + closing
- —
- Monthly P&I
- —
- Monthly cashflow
- —
- DSCR
- —
- Eligible?
- —
Personal DTI + credit; lowest rate.
DSCR
20% down · 8.5% · 30yr
- Down + closing
- —
- Monthly P&I
- —
- Monthly cashflow
- —
- DSCR
- —
- Eligible?
- —
No personal income docs; deal must DSCR.
Hard money
10% down · 12.0% · 12mo
- Down + closing
- —
- Monthly P&I
- —
- Monthly cashflow
- —
- DSCR
- —
- Eligible?
- —
Short-term bridge; refi at stabilization.
Rent comps 4 comps
| Address | Beds | Baths | Sqft | Rent | $/sqft | DOM | Units | Dist |
|---|---|---|---|---|---|---|---|---|
| 27036 236th Ln SE Maple Valley, WA | 4.0 | 3.0 | 3140 | $4,500 | $1.43 | 5d | 1 | 0.84mi |
| 23223 SE 262nd Ct Maple Valley, WA | 4.0 | 2.5 | 2610 | $4,400 | $1.69 | 44d | 1 | 1.07mi |
| 26222 233rd Ct SE Maple Valley, WA | 5.0 | 2.5 | 2840 | $3,695 | $1.30 | 44d | 1 | 1.14mi |
| 24524 SE 278th St Maple Valley, WA | 4.0 | 3.0 | 2790 | $4,000 | $1.43 | 2d | 1 | 1.14mi |
HOA detail
- Monthly dues
- $10 · $120/yr
Listing history 21 events
-
2026-06-18days on market $689,950 Active 72 DOM
-
2026-06-17days on market $689,950 Active 71 DOM
-
2026-06-16pricedays on market $689,950 Active 70 DOM
-
2026-06-15days on market $719,950 Active 69 DOM
-
2026-06-13days on market $719,950 Active 67 DOM
-
2026-06-09days on market $719,950 Active 63 DOM
-
2026-06-08days on market $719,950 Active 62 DOM
-
2026-06-07days on market $719,950 Active 61 DOM
-
2026-06-04days on market $719,950 Active 58 DOM
-
2026-06-03days on market $719,950 Active 57 DOM
-
2026-06-02days on market $719,950 Active 56 DOM
-
2026-06-01days on market $719,950 Active 55 DOM
-
2026-05-31days on market $719,950 Active 54 DOM
-
2026-05-05price $749,950
-
2026-04-20price $769,950
-
2026-04-07$789,950 Active
-
2017-11-14soldstatus $420,000 Sold
-
2017-10-23status Pending
-
2017-10-18price $429,900
-
2017-09-21price $449,900
-
2017-08-24$489,900 Active
ⓘ Source: listings_history table (triggers on properties + properties_extension) + one-shot
backfill from property_details.listing_events for pre-trigger history.
Tax reassessment forecast WA · Resets to sale price
- Current annual tax
- $8,092 · $674/mo
- Projected year-2 tax
- $8,092 · $674/mo
- Expected delta
- $0/yr ($0/mo · 0.0%)
ⓘ Screening estimate from a state-policy table — verify with the county assessor before closing.
Climate risk First Street
- Flood 1/10 Low FEMA zone X (unshaded) · 0% chance over 30 yrs
- Wildfire 1/10 Low
- Heat 2/10 Low 7 d/yr ≥87°F today · 15 d/yr by 30 yrs out
- Wind 1/10 Low
- Air quality 7/10 Severe 11 unhealthy d/yr today · 16 by 30 yrs out
Nearby sold comps map
Loading sold comps map…
Walkable amenities ~0.75 mi
Loading nearby amenities…
Taxation est. · year 1
- Rental income
- $53,159
- − Mortgage interest
- −$38,648
- − Property taxes
- −$8,092
- − Insurance
- −$3,450
- − Repairs & maintenance
- −$4,253
- − Management
- −$4,253
- − HOA
- −$120
- − Depreciation
- −$20,071
- Taxable loss
- −$25,727
- Est. tax savings @ 24.0%
- +$6,175
- After-tax cash flow
- $-6,909/yr
For passive investors: Depreciation is non-cash, so a rental often shows a tax loss while cash-flowing — sheltering income. Rental losses are passive: they offset passive income freely, and up to $25,000/yr can offset ordinary (W-2) income if you actively participate and your MAGI is under $100k (phasing out to $0 by $150k); unused losses carry forward. On sale, claimed depreciation is recaptured at up to 25%, and gains may owe capital-gains tax (a 1031 exchange can defer both). Figures are a year-1 estimate at your 24.0% rate — not tax advice; consult a CPA.
Schools (NCES district)
- District
- Tahoma School District
- NCES district ID
- 5308760
- Math proficiency
- 68% ▬ 0.00%
- Reading proficiency
- 76% ▬ 0.00%
- Median HH income
- $94,834
- Composite
- 66.41/100
- National rank
- #925
- State rank
- #10 of 291 in WA
Livability — Maple Valley
- Score
- 85/100
- State rank
- #24
- US rank
- #461
Category grades
Schools grade is shown separately in the Schools card above.
Census & demographics
- Census place
- Maple Valley, WA
- County
- King County · 2,251,916 people
- City population
- 37,324
- Metro
- Seattle-Tacoma-Bellevue, WA
- Population (ZIP)
- 37,324
- Household income
- $152,261
- Rent vs Own
- Severe rent burden
- 580.0
Population outlook (King County) Hauer SSP2
- Today (2025)
- 2,576,485 people
- By 2030
- 2,803,316 · +8.8%
- By 2040
- 3,255,921 · +26.4%
- By 2050
- 3,706,444 · +43.9%
- By 2075
- 4,746,063 · +84.2%
- By 2100
- 5,407,730 · +109.9%
Race, ethnicity, and origin ACS 2023
- Neighborhood character
- Predominantly White (73%)
- Race & ethnicity
- White 73% Asian 10% Two or more races 9% Hispanic / Latino 6% Black 2%
- Hispanic origin (detail)
- Mexican 3%
- Common ancestry
- Portuguese 5% Italian 4% Romanian 3%
- Foreign-born
- 13% · Canada, China, South Korea
- Languages at home
- 86% English-only · Other Asian/Pacific 4% Russian/Polish/Slavic 3% Other Indo-European 2%
Political lean MEDSL · King
- 2024 margin
- Solid D (+51.7) · D 74.2% · R 22.5% · Other 3.4%
- 2008→2024 swing
- +9.6pp toward D · 2008: 42.1pp · 2024: 51.7pp
- All cycles
- 2024: D+51.7 2020: D+52.7 2016: D+50.4 2012: D+39.9 2008: D+42.1
Not yet ingested
- Civics
- —
Market trends
- HPI YoY
- ▼ -588.79%
- Current HPI
- 310.7428
- Rent YoY
- ▲ 2.76%
- Metro
- Seattle-Tacoma-Bellevue, WA
- State GDP YoY
- ▲ 4.65%
- F500 in state
- 22
Industry mix (Fortune 500 HQ in WA)
| Industry | F500 HQs | Revenue |
|---|---|---|
| Retail | 2 | $269B |
|
||
| Technology / Retail | 1 | $638B |
|
||
| Technology | 1 | $245B |
|
||
| Telecommunications | 1 | $38B |
|
||
| Food / Beverage | 1 | $36B |
|
||
| Automotive / Trucks | 1 | $34B |
|
||
Price history
+53.1% since first listed8 events — show timeline
- 2026-05-05 Price Changed $749,950 NWMLS as Distributed by MLS Grid
- 2026-04-20 Price Changed $769,950 NWMLS as Distributed by MLS Grid
- 2026-04-07 Listed $789,950 NWMLS as Distributed by MLS Grid
- 2017-11-14 Sold (MLS) $420,000 NWMLS as Distributed by MLS Grid
- 2017-10-23 Pending — NWMLS as Distributed by MLS Grid
- 2017-10-18 Price Changed $429,900 NWMLS as Distributed by MLS Grid
- 2017-09-21 Price Changed $449,900 NWMLS as Distributed by MLS Grid
- 2017-08-24 Listed $489,900 NWMLS as Distributed by MLS Grid
Property tax history
+4.7%/yrLatest (2025): $8,092 · +10.4% YoY. Source: county tax records.
Cash-flow waterfall
monthlySold comps — $/sqft
last 12 mo · ≤1 miLoading sold comps…