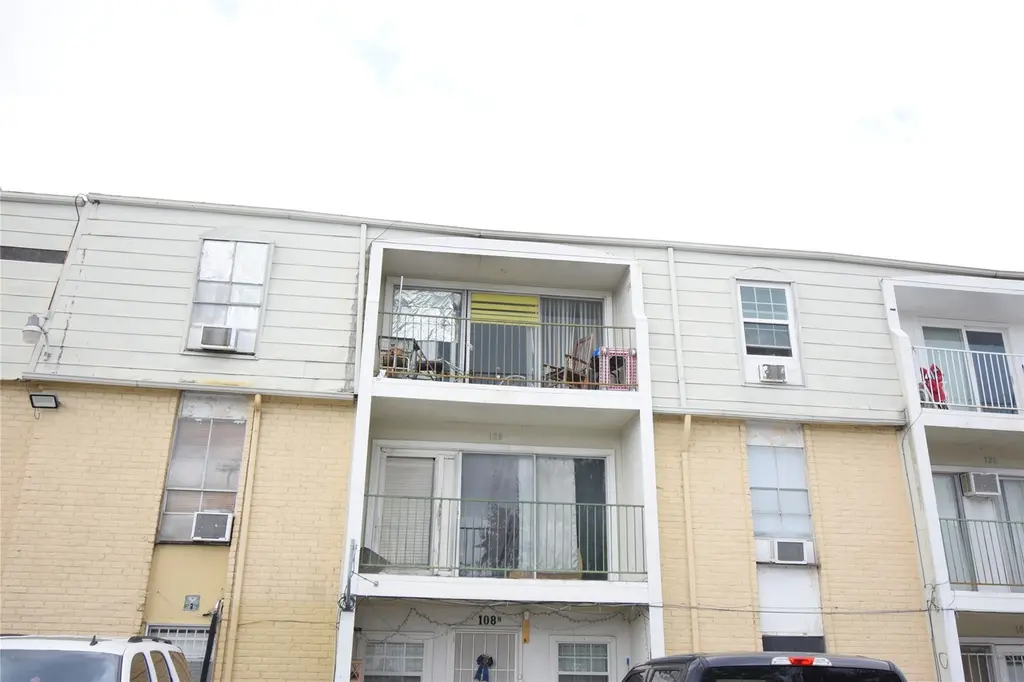
8200 Broadway St Unit 158N · Houston, TX
Flood risk 6/10 · Moderate
- FEMA flood zone
- X (unshaded)
- Chance of flooding over 30 yrs
- 0.71%
- Est. flood insurance / yr
- $507 – $1,088
Fire risk 1/10 · Minimal
- Est. fire insurance / yr
- $1,222 – $2,270
Heat risk 9/10 · Severe
- Hot days now (above 109°F)
- 7 days/yr
- Hot days in 30 yrs
- 25 days/yr
Wind risk 9/10 · Severe
- Chance of severe wind over 30 yrs
- 99.0%
Air-quality risk 2/10 · Minimal
- Unhealthy air days now
- 2 days/yr
- Unhealthy air days in 30 yrs
- 2 days/yr
Risk factors via First Street. Map © Google.
Why this score? — see what drove the B+ grade
The composite is a weighted blend of 9 inputs, each scored 0–100. Each bar is that input's sub-score; the figure is the points it added to the 100-point composite (weight × sub-score).
- Cash flow +30.0/30.0
- ARV discount +15.0/15.0
- 1% rule +10.0/10.0
- DSCR +10.0/10.0
- Livability +3.7/5.0
- Schools +2.7/10.0
- Rent growth +2.4/5.0
- Condition / age +2.2/5.0
- Appreciation +0.0/10.0
$34,900
🖨 Deal sheet (PDF) 📄 Offer letter ✓ Due diligence
Listing remarks
Affordable 1 bedroom and 1 full bathroom, condo in front of Hobby Airport. Balcony to Broadway, tile flooring throughout. This condo blends spaciousness, functionality, and convenience located near I-45. Easy access to downtown Houston, schools, shopping centers and much more. You don't want to miss this one. Call us Today!
Key facts
- Tile flooring
- Located near i-45
- $225 HOA
Tags
Property features AI
Finance
- Financial info: Lease not considered
- HOA & community: Thai Xuan Village association; Monthly association fee of $225 (includes water, sewer, trash)
Exterior
- Parking: Assigned parking
- Utilities: Public water; Public sewer
- Home design: Residential property; Single-story; Faces west; Entry level: 1
- Construction: Brick construction; Composition roof; Slab foundation; Built in 1970
- Exterior features: Concrete road surface
Interior
- Kitchen: Electric range
- Bedrooms: 3 total rooms
- Flooring: Tile flooring
- Bathrooms: 1 full bathroom
- Heating & cooling: Central heating (electric); Window unit cooling
- Interior features: Breakfast bar
Neighborhood map
What this means for you Summary
Snapshot
- This is a 1-bed/1.0-bath condo listed at $35k. Condition is rated fair.
Deal economics
- At list price, monthly cash flow is $230 ($3k/yr) — positive.
- The deal already cash-flows at list — no discount required.
- Meets the 1% rule at list price ($882 rent vs $35k).
- Recommended offer: $34k (1.5% below list) — sets the bar for market timing.
- Cap rate 14.2% vs local median 3.1% in Houston — top-decile yield for the area; either an underpriced asset or a hidden risk that comps aren't pricing in. Stress-test before assuming the spread holds.
Location & tenants
- Location reads 74/100 on livability (#184 in TX, #4,771 nationally) — a middle-class / working-renter tenant base. Strengths: amenities A+, cost of living A+, housing A+; Watch: crime F.
- Houston ISD (urban): math 27% / reading 35% proficiency, ranked #593 of 826 in TX (top 72%) — families likely to look elsewhere, expect single-tenant / working-renter base with shorter leases; 71% free/reduced lunch — lower-income household profile, screen leases tightly.
- Zoned schools: Park Place El (math 39% / reading 39%, grade F, #1,651 of 4,322 statewide, top 39%, 735 students, 94% FRL); Ortiz Middle (math 16% / reading 25%, grade F, #1,407 of 1,662 statewide, top 86%, 871 students, 97% FRL); Chavez H S (math 26% / reading 26%, grade F, #1,234 of 1,632 statewide, top 76%, 2,272 students, 93% FRL) — zoned schools average 95% FRL vs 71% district-wide (24 pts higher); higher-poverty schools than district average — tighter screening recommended.
- Market conditions: Rents soft (-0.3%/yr); 48 active listings in the ZIP; 23 comparable units currently listed for rent nearby; rentals at typical pace (median 25d on market — plan ~3-4 weeks tenant-placement turnaround); 48% of comp listings sitting > 30 days — soft ceiling on asking rent; 29,883 units permitted in Harris County in 2024 (8,621 in 5+ unit buildings).
Forward outlook
- Local home prices are declining (-3.0%/yr); year-one equity from $241 of loan paydown is wiped out by about $1k of value loss. Plan a longer hold.
- Harris County population projected at +47% by 2050 — long-run rental-demand tailwind backs the buy-and-hold thesis.
- At projected returns (-3.0% appreciation + 0.0% rent growth), your $10k cash investment doubles in ~6 years — after that, you're playing with house money.
Negotiation context
- It's been on market 22 days — a 2% lower offer ($34k) is reasonable based on typical stale-listing flexibility.
- 2 sale attempts with the ask held roughly flat each time — persistent listings suggest the price (not the market) is what's stuck; bring a comps-based counter.
Risks & watch-outs
- Watch-outs: HOA is 26% of rent.
- Climate carrying-cost: major flood risk; severe wind risk, 99% chance of damaging wind over 30y; extreme-heat days projected 7→25/yr by 2055 (HVAC capex compounding) — expect insurance premiums to compound above CPI over the hold.
Questions for the listing agent
- Have any recent inspections been done? Can we get a copy of the seller's disclosures and any deferred-maintenance estimates?
- Built in 1970 — when were the roof, HVAC, electrical panel, plumbing, and water heater last replaced?
- What does the HOA fee cover, when was the last increase, and are there any pending special assessments or reserve-fund shortfalls?
- Any open or pending special assessments — roof, HVAC, plumbing, elevator, façade? What's the per-unit balance and payoff schedule, and is the seller paying it off at close or rolling it to the buyer?
- Is there a deadline driving the sale (1031 exchange, divorce, estate, relocation)? That informs how much negotiation room exists.
- Schools are D-rated, which usually means shorter tenancies and higher turnover. Who's the typical renter profile here, and what's been the actual vacancy rate?
- Crime grade is F in this area — have there been break-ins, vandalism, or insurance claims at this property in the last 3 years? What carrier currently insures it and at what premium?
- What's the average days-on-market for RENTAL listings here right now (not sales)? A rising rental-DOM trend means longer vacancies and softer asking-rent achievability than the comps imply.
- What's the recent tenant-quality profile in this submarket — average credit score on applications, eviction rate, late-payment / NSF rate, and stable-employment percentage? A property-management company in the area should have these aggregated.
- How much new apartment / multifamily construction is in the pipeline within 1–3 miles? Heavy new supply (>2% of stock underway) typically softens rents 12–24 months out; light construction supports rent growth.
Investment metrics
- 1% rule
- 2.53% ✓
- Cap rate
- 14.22%
- Cash-on-cash
- 28.30%
- DSCR
- 2.26
- GRM
- 3.3
CMA / ARV
- ARV (median comp)
- $58,487
- List price
- $34,900
- Delta
- -40.33%
- Verdict
- UNDERPRICED
- Comps
- 5 within 2.0 mi
Projected returns pro-forma
-3.0% appreciation · 0.0% rent growth · sell at horizon
- IRR
- 17.6%
- Equity multiple
- 1.67×
- Total profit
- $6,589
- Equity at exit
- $5,204
- IRR
- 22.8%
- Equity multiple
- 2.56×
- Total profit
- $15,266
- Equity at exit
- $3,018
Cash invested: $9,772 (down + closing). Projections, not guarantees.
Landlord ↔ Tenant lean methodology
- Overall (STATE)
- 87 Strongly Landlord-Friendly
- State Texas
- 87 Strongly Landlord-Friendly · R+5
- County
- — inherits STATE
- City
- — inherits STATE
ZIP-level market 77061
- Home prices YoY
- -19.7%
- Rents YoY
- -0.3%
- Active inventory
- 48
- Price-to-rent
- 3.3×
Monthly cashflow live
- Estimated rent
- $882 high interval (Pro) →
- Mortgage (P&I)
- −$183
- Tax est. 1.5%
- −$44 /mo · $524/yr
- Insurance
- −$15
- HOA
- −$225
- Vacancy / Maint / Mgmt
- −$185
- Net cashflow
- $230
Break-even live
Sensitivity live
| Price | -10% $255 | -5% $243 | +0% $230 | +5% $218 | +10% $206 |
|---|---|---|---|---|---|
| Rent | -10% $161 | -5% $196 | +0% $230 | +5% $265 | +10% $300 |
| Rate | -1.0pp $248 | -0.5pp $239 | base $230 | +0.5pp $221 | +1.0pp $212 |
UW: 25.0% down · 7.5% · 30yr · 1.5% tax · 5.0% vac · 8.0% maint · 8.0% mgmt
Financing live
Cash to close
- Down payment
- $8,725
- Closing costs
- $1,047
- Reserves months
- —
- Total cash needed
- —
Loan-product check · same deal, 3 products live
Conventional
25% down · 7.5% · 30yr
- Down + closing
- —
- Monthly P&I
- —
- Monthly cashflow
- —
- DSCR
- —
- Eligible?
- —
Personal DTI + credit; lowest rate.
DSCR
20% down · 8.5% · 30yr
- Down + closing
- —
- Monthly P&I
- —
- Monthly cashflow
- —
- DSCR
- —
- Eligible?
- —
No personal income docs; deal must DSCR.
Hard money
10% down · 12.0% · 12mo
- Down + closing
- —
- Monthly P&I
- —
- Monthly cashflow
- —
- DSCR
- —
- Eligible?
- —
Short-term bridge; refi at stabilization.
Rent comps 23 comps
| Address | Beds | Baths | Sqft | Rent | $/sqft | DOM | Units | Dist |
|---|---|---|---|---|---|---|---|---|
| 7661 Bellfort Ave Houston, TX | 1.0 | 1.0 | 650 | $1,099 | $1.69 | 44d | 1 | 0.29mi |
| 7661 Bellfort Ave Houston, TX | 1.0 | 1.0 | 650 | $1,099 | $1.69 | 25d | 1 | 0.29mi |
| 7901 Leonora St Houston, TX | 1.0–2.0 | 1.0 | 750 | $795 | $1.06 | 6d | 10 | 0.51mi |
| 8501 Broadway St Houston, TX | 1.0–2.0 | 1.0–2.0 | 764 | $661 | $0.86 | 44d | 18 | 0.56mi |
| 7950 Bellfort St Houston, TX | 1.0–2.0 | 1.0–2.0 | 796 | $705 | $0.89 | 0d | 15 | 0.57mi |
| 7623 Pecan Villas Dr Unit 9 Houston, TX | 1.0 | 1.0 | 550 | $825 | $1.50 | 44d | 1 | 0.65mi |
| 7615 Grahamcrest Dr Houston, TX | 1.0–2.0 | 1.0 | 778 | $900 | $1.16 | 0d | 8 | 0.72mi |
| 8629 Dover St Houston, TX | 1.0 | 1.0 | 697 | $690 | $0.99 | 22d | 1 | 0.76mi |
| 8629 Dover St Houston, TX | 1.0 | 1.0 | 697 | $690 | $0.99 | 44d | 1 | 0.76mi |
| 8445 Winkler Dr Houston, TX | 1.0 | 1.0 | 704 | $800 | $1.14 | 25d | 1 | 0.88mi |
| 7915 Ithaca St Unit 3 Houston, TX | 1.0 | 1.0 | 450 | $650 | $1.44 | 44d | 1 | 1.09mi |
| 7915 Ithaca St Unit 2 Houston, TX | 2.0 | 1.0 | 600 | $750 | $1.25 | 44d | 1 | 1.09mi |
| 8625 Winkler Dr Unit 8699 Houston, TX | 1.0 | 1.0 | 616 | $927 | $1.50 | 11d | 1 | 1.09mi |
| 8625 Winkler Dr Unit 8646 Houston, TX | 1.0 | 1.0 | 616 | $923 | $1.50 | 14d | 1 | 1.09mi |
| 8625 Winkler Dr Houston, TX | 1.0 | 1.0 | 616 | $885 | $1.44 | 17d | 1 | 1.12mi |
| 8625 Winkler Dr Houston, TX | 1.0–2.0 | 1.0 | 701 | $903 | $1.29 | 0d | 17 | 1.12mi |
| 8625 Winkler Dr Houston, TX | 1.0–2.0 | 1.0 | 701 | $903 | $1.29 | 15d | 17 | 1.12mi |
| 3402 Dover St Houston, TX | — | 1.0 | 390 | $840 | $2.15 | 44d | 1 | 1.19mi |
| 8335 Bonner Dr Houston, TX | 1.0 | 1.0 | 700 | $950 | $1.36 | 44d | 1 | 1.23mi |
| 8800 Gulf Fwy Houston, TX | 1.0–2.0 | 1.0 | 750 | $930 | $1.24 | 2d | 6 | 1.36mi |
| 8357 Park Place Blvd Houston, TX | 1.0 | 1.0 | 739 | $845 | $1.14 | 44d | 1 | 1.41mi |
| 8451 1/2 Howard Dr Houston, TX | 1.0 | 1.0 | 494 | $900 | $1.82 | 44d | 1 | 1.44mi |
| 8029 Detroit St Houston, TX | 1.0 | 1.0 | 500 | $725 | $1.45 | 44d | 1 | 1.45mi |
HOA detail condo
- Monthly dues
- $225 · $2,700/yr
- Assessments
- None detected in remarks — confirm with the listing agent.
Listing history 15 events
-
2026-06-18days on market $34,900 Active 22 DOM
-
2026-06-17days on market $34,900 Active 21 DOM
-
2026-06-16days on market $34,900 Active 20 DOM
-
2026-06-15days on market $34,900 Active 19 DOM
-
2026-06-13days on market $34,900 Active 17 DOM
-
2026-06-09days on market $34,900 Active 13 DOM
-
2026-06-08days on market $34,900 Active 12 DOM
-
2026-06-07days on market $34,900 Active 11 DOM
-
2026-06-04days on market $34,900 Active 8 DOM
-
2026-06-03days on market $34,900 Active 7 DOM
-
2026-06-02days on market $34,900 Active 6 DOM
-
2026-06-01days on market $34,900 Active 5 DOM
-
2026-05-31days on market $34,900 Active 4 DOM
-
2026-05-18historical
-
2026-04-17$34,900 Active
ⓘ Source: listings_history table (triggers on properties + properties_extension) + one-shot
backfill from property_details.listing_events for pre-trigger history.
Climate risk First Street
- Flood 6/10 Major FEMA zone X (unshaded) · 71% chance over 30 yrs
- Wildfire 1/10 Low
- Heat 9/10 Extreme 7 d/yr ≥109°F today · 25 d/yr by 30 yrs out
- Wind 9/10 Extreme 99% chance of damaging wind over 30 yrs
- Air quality 2/10 Low 2 unhealthy d/yr today · 2 by 30 yrs out
Nearby sold comps map
Loading sold comps map…
Walkable amenities ~0.75 mi
Loading nearby amenities…
Taxation est. · year 1
- Rental income
- $10,582
- − Mortgage interest
- −$1,955
- − Property taxes
- −$524
- − Insurance
- −$174
- − Repairs & maintenance
- −$847
- − Management
- −$847
- − HOA
- −$2,700
- − Depreciation
- −$1,015
- Taxable income
- $2,520
- Est. tax owed @ 24.0%
- −$605
- After-tax cash flow
- $2,160/yr
For passive investors: Depreciation is non-cash, so a rental often shows a tax loss while cash-flowing — sheltering income. Rental losses are passive: they offset passive income freely, and up to $25,000/yr can offset ordinary (W-2) income if you actively participate and your MAGI is under $100k (phasing out to $0 by $150k); unused losses carry forward. On sale, claimed depreciation is recaptured at up to 25%, and gains may owe capital-gains tax (a 1031 exchange can defer both). Figures are a year-1 estimate at your 24.0% rate — not tax advice; consult a CPA.
Condition & rehab AI · 8 photos
This 1-bedroom condo requires moderate renovations to improve its condition and increase its value. Focus on exterior siding, bathroom fixtures, and HVAC maintenance.
Repairs flagged
- Major exterior siding — Significant wear and tear
- Major bathroom fixtures — Outdated and cluttered
- Major bathroom flooring — Stained and outdated tile
- Major interior walls — Painted walls show signs of wear
Value-add opportunities
- Both Paint and refresh exterior siding — Enhances curb appeal and value
- Both Replace outdated bathroom fixtures — Improves functionality and aesthetics
- Both Deep clean and maintain HVAC system — Ensures comfort and energy efficiency
Renovation cost estimate screening
| Repair item | Severity | Est. cost |
|---|---|---|
| exterior siding · Significant wear and tear | Major | $15,000–50,000 |
| bathroom fixtures · Outdated and cluttered | Major | $15,000–50,000 |
| bathroom flooring · Stained and outdated tile | Major | $15,000–50,000 |
| interior walls · Painted walls show signs of wear | Major | $15,000–50,000 |
| Total estimated repair cost · 4 items | $60,000–200,000 |
Value-add ROI direction
- Both Paint and refresh exterior siding — Enhances curb appeal and value ↑
- Both Replace outdated bathroom fixtures — Improves functionality and aesthetics ↑
- Both Deep clean and maintain HVAC system — Ensures comfort and energy efficiency ↑
ⓘ Cost ranges are severity-bucket heuristics (US national rule-of-thumb). Get contractor quotes + a written scope before underwriting a rehab budget.
Schools (NCES district)
- District
- Houston ISD
- NCES district ID
- 4823640
- Math proficiency
- 27% ▼ -18.00%
- Reading proficiency
- 35% ▼ -6.00%
- Median HH income
- $46,054
- Composite
- 26.63/100
- National rank
- #7173
- State rank
- #593 of 826 in TX
Livability — Houston
- Score
- 74/100
- State rank
- #184
- US rank
- #4771
Category grades
Schools grade is shown separately in the Schools card above.
Census & demographics
- Census place
- Houston, TX
- County
- Harris County · 4,702,590 people
- City population
- 3,226,434
- Metro
- Houston-The Woodlands-Sugar Land, TX
- Population (ZIP)
- 24,004
- Household income
- $45,115
- Rent vs Own
- Severe rent burden
- 1546.0
Population outlook (Harris County) Hauer SSP2
- Today (2025)
- 5,571,493 people
- By 2030
- 6,089,821 · +9.3%
- By 2040
- 7,142,806 · +28.2%
- By 2050
- 8,185,864 · +46.9%
- By 2075
- 10,574,329 · +89.8%
- By 2100
- 12,109,958 · +117.4%
Race, ethnicity, and origin ACS 2023
- Neighborhood character
- Majority Hispanic (64%)
- Race & ethnicity
- Hispanic / Latino 64% Black 21% Two or more races 20% White 7% Asian 6% Native American 3%
- Hispanic origin (detail)
- Mexican 42% Puerto Rican 2% Cuban 2%
- Common ancestry
- Italian 1% Lithuanian 1%
- Foreign-born
- 37% · Canada, Vietnam
- Languages at home
- 35% English-only · Spanish 58% Vietnamese 6% French/Haitian/Cajun 1%
Political lean MEDSL · Harris
- 2024 margin
- Lean D (+5.5) · D 52.0% · R 46.4% · Other 1.6%
- 2008→2024 swing
- +3.9pp toward D · 2008: 1.6pp · 2024: 5.5pp
- All cycles
- 2024: D+5.5 2020: D+13.3 2016: D+12.4 2012: D+0.1 2008: D+1.6
Not yet ingested
- Civics
- —
Market trends
- HPI YoY
- ▼ -74.75%
- Current HPI
- 303.8705
- Rent YoY
- ▼ -0.30%
- Metro
- Houston-The Woodlands-Sugar Land, TX
- State GDP YoY
- ▲ 3.95%
- F500 in state
- 110
Industry mix (Fortune 500 HQ in TX)
| Industry | F500 HQs | Revenue |
|---|---|---|
| Energy | 16 | $1,198B |
|
||
| Technology | 5 | $198B |
|
||
| Engineering / Construction | 4 | $72B |
|
||
| Energy Services | 3 | $60B |
|
||
| Utilities | 3 | $41B |
|
||
| Healthcare | 2 | $330B |
|
||
Price history
+0.0% since first listed3 events — show timeline
- 2026-05-27 Listed $34,900 HARMLS
- 2026-05-18 Listing Removed — HARMLS
- 2026-04-17 Listed $34,900 HARMLS
Cash-flow waterfall
monthlySold comps — $/sqft
last 12 mo · ≤1 miLoading sold comps…