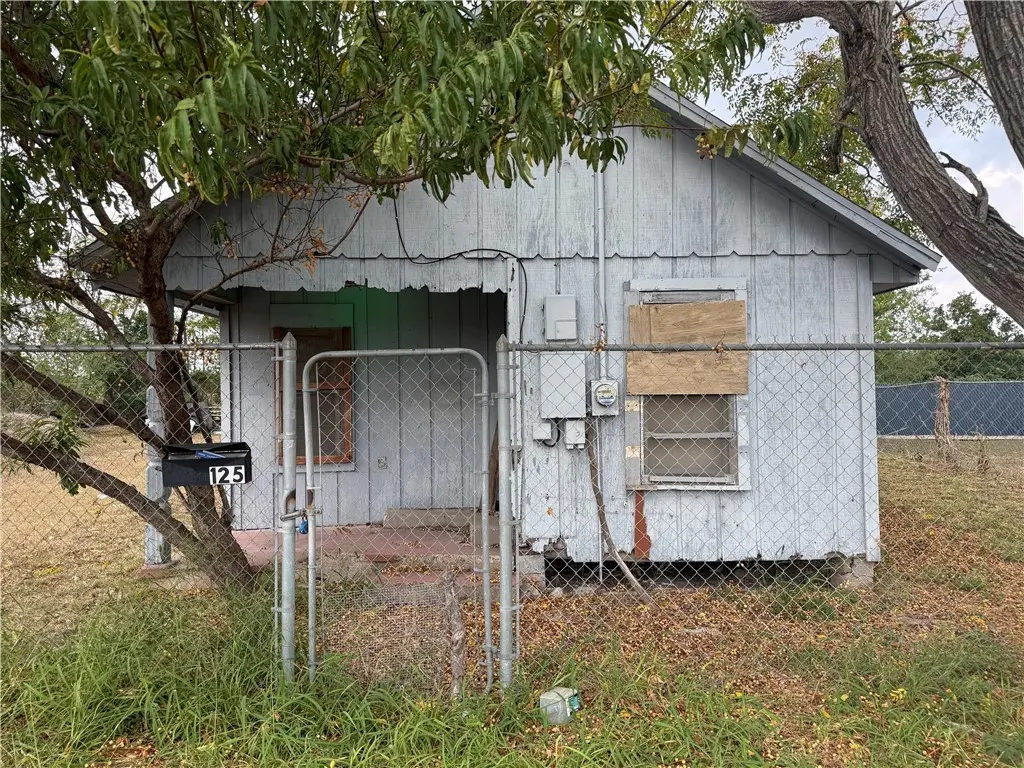
125 N Bluntzer St · Corpus Christi, TX
Flood risk 1/10 · Minimal
- FEMA flood zone
- X (unshaded)
- Chance of flooding over 30 yrs
- 0.0%
- Est. flood insurance / yr
- $507 – $1,088
Fire risk 1/10 · Minimal
- Est. fire insurance / yr
- $1,222 – $2,270
Heat risk 10/10 · Severe
- Hot days now (above 107°F)
- 7 days/yr
- Hot days in 30 yrs
- 24 days/yr
Wind risk 9/10 · Severe
- Chance of severe wind over 30 yrs
- 99.0%
Air-quality risk 1/10 · Minimal
- Unhealthy air days now
- 0 days/yr
- Unhealthy air days in 30 yrs
- 0 days/yr
Risk factors via First Street. Map © Google.
Why this score? — see what drove the A grade
The composite is a weighted blend of 9 inputs, each scored 0–100. Each bar is that input's sub-score; the figure is the points it added to the 100-point composite (weight × sub-score).
- Cash flow +30.0/30.0
- ARV discount +15.0/15.0
- 1% rule +10.0/10.0
- DSCR +10.0/10.0
- Appreciation +9.2/10.0
- Livability +3.9/5.0
- Schools +2.8/10.0
- Rent growth +2.5/5.0
- Condition / age +2.5/5.0
$35,000
🖨 Deal sheet 📄 Offer letter ✓ Due diligence
Listing remarks MLS
Modest home at an affordable price! Situated on a large lot on a quiet street where people look out for one another. Stop paying rent and invest in yourself today! Fix it up and make it yours.
Key facts
- 3,751 sq ft lot
- Built 1955
- Listed 14 days
Neighborhood map
What this means for you Summary
Snapshot
- This is a 1-bed/1.0-bath single-family listed at $35k.
Deal economics
- At list price, monthly cash flow is $522 ($6k/yr) — positive.
- The deal already cash-flows at list — no discount required.
- Meets the 1% rule at list price ($998 rent vs $35k).
- Cap rate 24.2% vs local median 3.6% in Corpus Christi — top-decile yield for the area; either an underpriced asset or a hidden risk that comps aren't pricing in. Stress-test before assuming the spread holds.
Location & tenants
- Location reads 78/100 on livability (#66 in TX, #2,404 nationally) — a middle-class / working-renter tenant base. Strengths: commute A+, cost of living A+, housing A+; Watch: crime F.
- Corpus Christi ISD (urban): math 31% / reading 35% proficiency, ranked #562 of 826 in TX (top 68%) — families likely to look elsewhere, expect single-tenant / working-renter base with shorter leases; 63% free/reduced lunch — lower-income household profile, screen leases tightly.
- Market conditions: 36 active listings in the ZIP; 40 comparable units currently listed for rent nearby; rentals at typical pace (median 21d on market — plan ~3-4 weeks tenant-placement turnaround); 48% of comp listings sitting > 30 days — soft ceiling on asking rent; 1,397 units permitted in Nueces County in 2024 (47 in 5+ unit buildings).
Forward outlook
- In year one you build about $3k of equity ($242 loan paydown + $3k appreciation (8.5% local appreciation)).
- Nueces County population projected at +36% by 2050 — long-run rental-demand tailwind backs the buy-and-hold thesis.
- At projected returns (8.5% appreciation + 3.0% rent growth), your $10k cash investment doubles in ~2 years — after that, you're playing with house money.
- By year 9, paydown + projected appreciation supports a ~$31k cash-out refi (75% LTV) — recoverable capital for the next deal without selling this one.
Negotiation context
- Only 14 days on market — expect competitive offers; lowballing is unlikely to land.
Risks & watch-outs
- Watch-outs: built in 1955 — expect roof / HVAC / electrical / plumbing capex.
- Climate carrying-cost: severe wind risk, 99% chance of damaging wind over 30y; extreme-heat days projected 7→24/yr by 2055 (HVAC capex compounding) — expect insurance premiums to compound above CPI over the hold.
Questions for the listing agent
- Built in 1955 — when were the roof, HVAC, electrical panel, plumbing, and water heater last replaced?
- Is there a deadline driving the sale (1031 exchange, divorce, estate, relocation)? That informs how much negotiation room exists.
- Crime grade is F in this area — have there been break-ins, vandalism, or insurance claims at this property in the last 3 years? What carrier currently insures it and at what premium?
- What's the average days-on-market for RENTAL listings here right now (not sales)? A rising rental-DOM trend means longer vacancies and softer asking-rent achievability than the comps imply.
- What's the recent tenant-quality profile in this submarket — average credit score on applications, eviction rate, late-payment / NSF rate, and stable-employment percentage? A property-management company in the area should have these aggregated.
- How much new for-sale + rental construction is in the pipeline within 1–3 miles? Heavy new supply typically softens prices + rents 12–24 months out; constrained supply supports both.
Investment metrics
- 1% rule
- 2.85% ✓
- Cap rate
- 24.18%
- Cash-on-cash
- 63.87%
- DSCR
- 3.84
- GRM
- 2.9
CMA / ARV
- ARV (median comp)
- $59,447
- List price
- $35,000
- Delta
- -41.12%
- Verdict
- UNDERPRICED
- Comps
- 20 within 1.0 mi
Show comp detail 6 sales within ~0.75 mi
| Address | Dist | Beds/Ba | Sqft | Sold | Price | $/sf | Match |
|---|---|---|---|---|---|---|---|
| 2906 Marguerite St | 0.29mi | 2/1.0 (+1) | 917 (+3%) | 20mo | $159,900 | $174 | 60 |
| 2613 Mary St | 0.26mi | 2/1.0 (+1) | 992 (+11%) | 6mo | $60,000 | $60 | 60 |
| 710 16th St | 0.62mi | 1/1.0 | 864 (-3%) | 11mo | $35,000 | $41 | 56 |
| 2008 Craig St | 0.74mi | 2/1.0 (+1) | 854 (-4%) | 9mo | $100,000 | $117 | 46 |
| 2007 Howard St | 0.47mi | 2/1.0 (+1) | 791 (-12%) | 23mo | $19,000 | $24 | 34 |
| 1205 Hibiscus St | 0.69mi | 2/1.0 (+1) | 800 (-10%) | 15mo | $25,000 | $31 | 33 |
Match score weights: distance 35% · size 25% · config 20% · recency 20%. Top-matched comps best support the ARV.
Projected returns pro-forma
8.49% appreciation · 3.0% rent growth · sell at horizon
- IRR
- 74.1%
- Equity multiple
- 5.98×
- Total profit
- $48,767
- Equity at exit
- $27,760
- IRR
- 69.2%
- Equity multiple
- 12.93×
- Total profit
- $116,952
- Equity at exit
- $56,259
Cash invested: $9,800 (down + closing). Projections, not guarantees.
Landlord ↔ Tenant lean methodology
- Overall (STATE)
- 87 Strongly Landlord-Friendly
- State Texas
- 87 Strongly Landlord-Friendly · R+5
- County
- — inherits STATE
- City
- — inherits STATE
ZIP-level market 78408
- Home prices YoY
- 6.8%
- Active inventory
- 36
- Price-to-rent
- 2.9×
Monthly cashflow live
- Estimated rent
- $998 high interval (Pro) →
- Mortgage (P&I)
- −$184
- Tax from tax record
- −$69 /mo · $828/yr
- Insurance
- −$15
- HOA
- −$0
- Vacancy / Maint / Mgmt
- −$210
- Net cashflow
- $522
Break-even live
UW: 25.0% down · 7.5% · 30yr · 1.5% tax · 5.0% vac · 8.0% maint · 8.0% mgmt
Financing live
Cash to close
- Down payment
- $8,750
- Closing costs
- $1,050
- Reserves months
- —
- Total cash needed
- —
Loan-product check · same deal, 3 products live
Conventional
25% down · 7.5% · 30yr
- Down + closing
- —
- Monthly P&I
- —
- Monthly cashflow
- —
- DSCR
- —
- Eligible?
- —
Personal DTI + credit; lowest rate.
DSCR
20% down · 8.5% · 30yr
- Down + closing
- —
- Monthly P&I
- —
- Monthly cashflow
- —
- DSCR
- —
- Eligible?
- —
No personal income docs; deal must DSCR.
Hard money
10% down · 12.0% · 12mo
- Down + closing
- —
- Monthly P&I
- —
- Monthly cashflow
- —
- DSCR
- —
- Eligible?
- —
Short-term bridge; refi at stabilization.
Rent comps 40 comps
| Address | Beds | Baths | Sqft | Rent | $/sqft | DOM | Units | Dist |
|---|---|---|---|---|---|---|---|---|
| 206 Spruce St Corpus Christi, TX | 1.0 | 1.0 | 835 | $900 | $1.08 | 13d | 1 | 0.45mi |
| 3115 Agnes St Corpus Christi, TX | 2.0 | 1.0 | 428 | $713 | $1.67 | 43d | 3 | 0.49mi |
| 2937 Ruth St Corpus Christi, TX | 2.0 | 1.0 | 676 | $950 | $1.41 | 43d | 1 | 0.53mi |
| 801 18th St Corpus Christi, TX | 1.0 | 1.0 | 600 | $895 | $1.49 | 21d | 1 | 0.56mi |
| 1114 25th St Corpus Christi, TX | 1.0–2.0 | 1.0 | 712 | $799 | $1.12 | 13d | 6 | 0.61mi |
| 3302 Up River Rd Corpus Christi, TX | 2.0 | 1.0 | 710 | $699 | $0.98 | 13d | 1 | 0.63mi |
| 3002 Antelope St Unit 328 Corpus Christi, TX | 1.0 | 1.0 | 628 | $675 | $1.07 | 43d | 1 | 0.67mi |
| 3002 Antelope St Apt 112 Corpus Christi, TX | 1.0 | 1.0 | 828 | $825 | $1.00 | 43d | 1 | 0.67mi |
| 3002 Antelope St Corpus Christi, TX | 1.0 | 1.0 | 828 | $815 | $0.98 | 43d | 1 | 0.67mi |
| 116 Lowell St Corpus Christi, TX | 2.0 | 1.0 | 628 | $995 | $1.58 | 21d | 1 | 0.70mi |
| 1603 Caldwell St Corpus Christi, TX | 2.0 | 1.0 | 628 | $995 | $1.58 | 21d | 1 | 0.74mi |
| 2402 Segrest St Corpus Christi, TX | 2.0 | 1.0 | 1120 | $825 | $0.74 | 21d | 1 | 0.89mi |
| 1808 Morgan Ave Corpus Christi, TX | 1.0 | 1.0 | 667 | $975 | $1.46 | 43d | 1 | 0.93mi |
| 1802 Morgan Ave Unit 1802 Corpus Christi, TX | 2.0 | 1.0 | 850 | $1,250 | $1.47 | 21d | 1 | 0.94mi |
| 1802 Morgan Ave Unit 1804 Corpus Christi, TX | 1.0 | 1.0 | 667 | $695 | $1.04 | 43d | 1 | 0.94mi |
| 2333 Riggan St Corpus Christi, TX | 2.0 | 1.0 | 856 | $1,250 | $1.46 | 43d | 1 | 1.12mi |
| 3762 Up River Rd Corpus Christi, TX | 1.0–2.0 | 1.0–2.0 | 855 | $974 | $1.14 | 13d | 6 | 1.14mi |
| 1433 12th St Corpus Christi, TX | 2.0 | 1.0 | 768 | $1,050 | $1.37 | 43d | 1 | 1.16mi |
| 613 6th St Corpus Christi, TX | 1.0 | 1.0 | 650 | $850 | $1.31 | 43d | 1 | 1.18mi |
| 901 Furman Ave Unit F Corpus Christi, TX | 1.0 | 1.0 | 560 | $700 | $1.25 | 43d | 1 | 1.22mi |
| 901 Furman Ave Unit B Corpus Christi, TX | 1.0 | 1.0 | 659 | $750 | $1.14 | 21d | 1 | 1.22mi |
| 1124 Morgan Ave Unit 1268437P Corpus Christi, TX | 2.0 | 1.0 | 721 | $2,081 | $2.89 | 43d | 1 | 1.23mi |
| 1112 Morgan Ave Unit 1268432P Corpus Christi, TX | 1.0 | 1.0 | 656 | $1,632 | $2.49 | 43d | 1 | 1.24mi |
| 1116 Morgan Ave Unit 1268439P Corpus Christi, TX | 1.0 | 1.0 | 656 | $1,743 | $2.66 | 43d | 1 | 1.24mi |
| 1116 Morgan Ave Unit 1268424P Corpus Christi, TX | 1.0 | 1.0 | 656 | $1,454 | $2.22 | 43d | 1 | 1.24mi |
| 826 Hancock Ave Unit 3 Corpus Christi, TX | 1.0 | 1.0 | 700 | $800 | $1.14 | 21d | 1 | 1.25mi |
| 826 Hancock Ave Unit 2 Corpus Christi, TX | 2.0 | 1.0 | 1000 | $950 | $0.95 | 21d | 1 | 1.25mi |
| 826 Hancock Ave Unit 1 Corpus Christi, TX | 1.0 | 1.0 | 700 | $850 | $1.21 | 21d | 1 | 1.25mi |
| 725 S Carancahua St Corpus Christi, TX | 1.0 | 1.0 | 563 | $793 | $1.41 | 21d | 2 | 1.33mi |
| 725 Villa Dr Unit 7 Corpus Christi, TX | 2.0 | 1.0 | 628 | $649 | $1.03 | 43d | 1 | 1.34mi |
| 725 Villa Dr Corpus Christi, TX | 2.0 | 1.0 | 650 | $649 | $1.00 | 13d | 1 | 1.37mi |
| 715 S Upper Broadway St Corpus Christi, TX | 1.0 | 1.0–1.5 | 772 | $1,650 | $2.14 | 21d | 2 | 1.40mi |
| 1628 18th St Corpus Christi, TX | 2.0 | 1.0 | 1112 | $1,000 | $0.90 | 43d | 1 | 1.40mi |
| 715 S Upper Broadway #903 Corpus Christi, TX | 1.0 | 1.5 | 892 | $1,700 | $1.91 | 43d | 1 | 1.40mi |
| 1318 6th St Corpus Christi, TX | 2.0 | 1.0 | 900 | $900 | $1.00 | 13d | 1 | 1.42mi |
| 802 S Carancahua St Corpus Christi, TX | 2.0 | 1.0–2.0 | 869 | $1,260 | $1.45 | 13d | 68 | 1.42mi |
| 1521 7th St Corpus Christi, TX | 2.0 | 2.0 | 850 | $1,250 | $1.47 | 13d | 1 | 1.42mi |
| 522 Hancock Ave Corpus Christi, TX | 1.0–2.0 | 1.0–2.0 | 915 | $1,515 | $1.65 | 13d | 10 | 1.44mi |
| 522 Hancock Ave Unit 2-238 Corpus Christi, TX | 1.0 | 1.0 | 784 | $1,365 | $1.74 | 13d | 1 | 1.44mi |
| 823 S Water St Unit 1A Corpus Christi, TX | 1.0 | 1.5 | 818 | $1,550 | $1.89 | 43d | 1 | 1.45mi |
Listing history 14 events
-
2026-06-18days on market $35,000 Active 14 DOM
-
2026-06-17days on market $35,000 Active 13 DOM
-
2026-06-16days on market $35,000 Active 12 DOM
-
2026-06-15days on market $35,000 Active 11 DOM
-
2026-06-14days on market $35,000 Active 9 DOM
-
2026-06-10days on market $35,000 Active 6 DOM
-
2026-06-09days on market $35,000 Active 5 DOM
-
2026-06-08days on market $35,000 Active 4 DOM
-
2026-06-07days on market $35,000 Active 3 DOM
-
2026-06-05days on market $35,000 Active 1 DOM
-
2026-05-31days on market $35,000 Active 188 DOM
-
2026-05-30days on market $35,000 Active 187 DOM
-
2026-03-18price $35,000 194-char remark
Show marketing remark (194 chars)
Modest home at an affordable price! Situated on a large lot on a quiet street where people look out for one another. Stop paying rent and invest in yourself today! Fix it up and make it yours.
-
2025-11-24$40,000 Active 194-char remark
Show marketing remark (194 chars)
Modest home at an affordable price! Situated on a large lot on a quiet street where people look out for one another. Stop paying rent and invest in yourself today! Fix it up and make it yours.
ⓘ Source: listings_history table (triggers on properties + properties_extension) + one-shot
backfill from property_details.listing_events for pre-trigger history.
Tax reassessment forecast TX · Resets to sale price
- Current annual tax
- $828 · $69/mo
- Projected year-2 tax
- $828 · $69/mo
- Expected delta
- $0/yr ($0/mo · 0.0%)
ⓘ Screening estimate from a state-policy table — verify with the county assessor before closing.
Climate risk First Street
- Flood 1/10 Low FEMA zone X (unshaded) · 0% chance over 30 yrs
- Wildfire 1/10 Low
- Heat 10/10 Extreme 7 d/yr ≥107°F today · 24 d/yr by 30 yrs out
- Wind 9/10 Extreme 99% chance of damaging wind over 30 yrs
- Air quality 1/10 Low 0 unhealthy d/yr today · 0 by 30 yrs out
Nearby sold comps map
Loading sold comps map…
Walkable amenities ~0.75 mi
Loading nearby amenities…
Taxation est. · year 1
- Rental income
- $11,980
- − Mortgage interest
- −$1,961
- − Property taxes
- −$828
- − Insurance
- −$175
- − Repairs & maintenance
- −$958
- − Management
- −$958
- − Depreciation
- −$1,018
- Taxable income
- $6,082
- Est. tax owed @ 24.0%
- −$1,460
- After-tax cash flow
- $4,799/yr
For passive investors: Depreciation is non-cash, so a rental often shows a tax loss while cash-flowing — sheltering income. Rental losses are passive: they offset passive income freely, and up to $25,000/yr can offset ordinary (W-2) income if you actively participate and your MAGI is under $100k (phasing out to $0 by $150k); unused losses carry forward. On sale, claimed depreciation is recaptured at up to 25%, and gains may owe capital-gains tax (a 1031 exchange can defer both). Figures are a year-1 estimate at your 24.0% rate — not tax advice; consult a CPA.
Schools (NCES district)
- District
- Corpus Christi ISD
- NCES district ID
- 4815270
- Math proficiency
- 31% ▼ -18.00%
- Reading proficiency
- 35% ▼ -7.00%
- Median HH income
- $45,672
- Composite
- 28.27/100
- National rank
- #6793
- State rank
- #562 of 826 in TX
Livability — Corpus Christi
- Score
- 78/100
- State rank
- #66
- US rank
- #2404
Category grades
Schools grade is shown separately in the Schools card above.
Census & demographics
- Census place
- Corpus Christi, TX
- City population
- 296,836
- Population (ZIP)
- 9,631
Population outlook (Nueces County) Hauer SSP2
- Today (2025)
- 418,037 people
- By 2030
- 447,123 · +7.0%
- By 2040
- 505,911 · +21.0%
- By 2050
- 567,522 · +35.8%
- By 2075
- 729,686 · +74.6%
- By 2100
- 847,087 · +102.6%
Race, ethnicity, and origin ACS 2023
- Neighborhood character
- Predominantly Hispanic (84%)
- Race & ethnicity
- Hispanic / Latino 84% Two or more races 39% White 8% Black 7%
- Hispanic origin (detail)
- Mexican 78%
- Foreign-born
- 10% · Canada, Vietnam
- Languages at home
- 46% English-only · Spanish 53% Vietnamese 1%
Political lean MEDSL · Nueces
- 2024 margin
- R (+11.5) · D 43.8% · R 55.3%
- 2008→2024 swing
- -7.1pp toward R · 2008: -4.4pp · 2024: -11.5pp
- All cycles
- 2024: R+11.5 2020: R+2.9 2016: R+1.5 2012: R+3.2 2008: R+4.4
Not yet ingested
- Civics
- —
Market trends
- HPI YoY
- ▲ 8.49%
- Current HPI
- 132.544
- Rent YoY
- —
- Metro
- —
- State GDP YoY
- ▲ 3.95%
- F500 in state
- 110
Industry mix (Fortune 500 HQ in TX)
| Industry | F500 HQs | Revenue |
|---|---|---|
| Energy | 16 | $1,198B |
|
||
| Technology | 5 | $198B |
|
||
| Engineering / Construction | 4 | $72B |
|
||
| Energy Services | 3 | $60B |
|
||
| Utilities | 3 | $41B |
|
||
| Healthcare | 2 | $330B |
|
||
Price history
-12.5% since first listed2 events — show timeline
- 2026-03-18 Price Changed $35,000 CBMLS
- 2025-11-24 Listed $40,000 CBMLS
Property tax history
-0.3%/yrLatest (2025): $828 · +8.5% YoY. Source: county tax records.
Cash-flow waterfall
monthlySold comps — $/sqft
last 12 mo · ≤1 miLoading sold comps…