 Multi-family
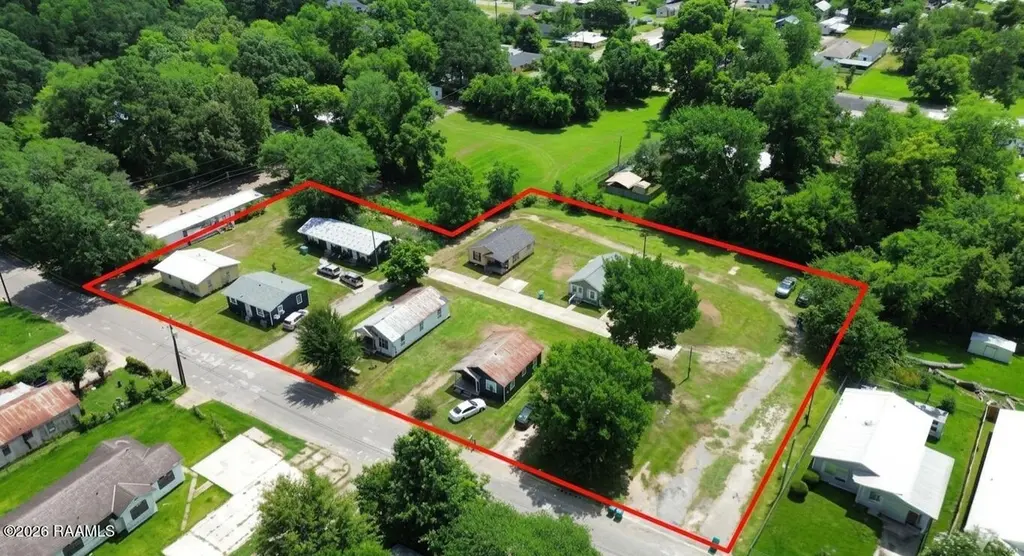
731-809 Saint Cyr Ave Unit 731-809 · Opelousas, LA
Flood risk 1/10 · Minimal
- FEMA flood zone
- X (unshaded)
- Chance of flooding over 30 yrs
- 0.0%
- Est. flood insurance / yr
- $507 – $1,088
Fire risk 1/10 · Minimal
- Est. fire insurance / yr
- $1,269 – $2,357
Heat risk 8/10 · Major
- Hot days now (above 110°F)
- 7 days/yr
- Hot days in 30 yrs
- 20 days/yr
Wind risk 9/10 · Severe
- Chance of severe wind over 30 yrs
- 99.0%
Air-quality risk 1/10 · Minimal
- Unhealthy air days now
- 0 days/yr
- Unhealthy air days in 30 yrs
- 0 days/yr
Risk factors via First Street. Map © Google.
Why this score? — see what drove the B- grade
The composite is a weighted blend of 9 inputs, each scored 0–100. Each bar is that input's sub-score; the figure is the points it added to the 100-point composite (weight × sub-score).
- Cash flow +30.0/30.0
- 1% rule +10.0/10.0
- DSCR +10.0/10.0
- ARV discount +7.5/15.0
- Livability +3.2/5.0
- Rent growth +2.5/5.0
- Schools +2.2/10.0
- Condition / age +2.2/5.0
- Appreciation +0.0/10.0
$295,000
🖨 Deal sheet 📄 Offer letter ✓ Due diligence
Multi-family units
County records classify this as Multi-Family (5+ Unit). Listing-text estimate: 1 unit. estimate disagrees with records
5+ unit building — per-unit beds/baths from public records are typically unavailable; the breakdown below (if shown) is an estimate from the listing text.
Listing remarks
Looking to add some doors to your portfolio!! Here's your chance to get 8 homes with 7 vacant lots. This means you have the potential to add more homes to create more monthly income. Opportunity has now come at your doorstep to start your journey to become an investor. Schedule a showing and let's see the possibilities that this property can lead to.
Key facts
- 30 parking spots
- Listed 8 days
Property features AI
Exterior
- Parking: Parking for approximately 30 vehicles
- Utilities: Public sewer
- Home design: Multi-family property with 15 total units
- Construction: Frame construction; Wood siding
- Exterior features: Frame construction with wood siding
Interior
- Heating & cooling: Wall furnaces; Heat units; Central AC unit(s) and other cooling
- Interior features: Includes unspecified built-in appliances
Neighborhood map
What this means for you Summary
Snapshot
- This is a multifamily listed at $295k. Condition is rated fair.
Deal economics
- At list price, monthly cash flow is $2k ($18k/yr) — positive.
- The deal already cash-flows at list — no discount required.
- Meets the 1% rule at list price ($4k rent vs $295k).
- Cap rate 12.5% vs local median 4.0% in Opelousas — top-decile yield for the area; either an underpriced asset or a hidden risk that comps aren't pricing in. Stress-test before assuming the spread holds.
Location & tenants
- Location reads 63/100 on livability (#187 in LA) — a middle-class / working-renter tenant base. Strengths: cost of living A+, housing A+, health & safety A+; Watch: crime F, amenities F, commute F.
- St. Landry Parish (town): math 20% / reading 33% proficiency, ranked #54 of 98 in LA (top 55%) — low school quality limits family demand, transient renter base, plan for 1-2y turnover; 73% free/reduced lunch — lower-income household profile, screen leases tightly.
- Market conditions: 309 active listings in the ZIP; 142 units permitted in St. Landry Parish in 2024 (0 in 5+ unit buildings).
Forward outlook
- Local home prices are declining (-3.0%/yr); year-one equity from $2k of loan paydown is wiped out by about $9k of value loss. Plan a longer hold.
- St. Landry County population projected to shrink 9% by 2050 — rents likely to lag national; underwrite the cash flow, not the appreciation.
- At projected returns (-3.0% appreciation + 3.0% rent growth), your $83k cash investment doubles in ~6 years — after that, you're playing with house money.
Negotiation context
- Only 8 days on market — expect competitive offers; lowballing is unlikely to land.
Risks & watch-outs
- Climate carrying-cost: severe wind risk, 99% chance of damaging wind over 30y; extreme-heat days projected 7→20/yr by 2055 (HVAC capex compounding) — expect insurance premiums to compound above CPI over the hold.
Questions for the listing agent
- Have any recent inspections been done? Can we get a copy of the seller's disclosures and any deferred-maintenance estimates?
- Is there a deadline driving the sale (1031 exchange, divorce, estate, relocation)? That informs how much negotiation room exists.
- Crime grade is F in this area — have there been break-ins, vandalism, or insurance claims at this property in the last 3 years? What carrier currently insures it and at what premium?
- What's the average days-on-market for RENTAL listings here right now (not sales)? A rising rental-DOM trend means longer vacancies and softer asking-rent achievability than the comps imply.
- What's the recent tenant-quality profile in this submarket — average credit score on applications, eviction rate, late-payment / NSF rate, and stable-employment percentage? A property-management company in the area should have these aggregated.
- How much new apartment / multifamily construction is in the pipeline within 1–3 miles? Heavy new supply (>2% of stock underway) typically softens rents 12–24 months out; light construction supports rent growth.
Investment metrics
- 1% rule
- 1.53% ✓
- Cap rate
- 12.46%
- Cash-on-cash
- 22.03%
- DSCR
- 1.98
- GRM
- 5.5
CMA / ARV
No comps found within radius.
Projected returns pro-forma
-3.0% appreciation · 3.0% rent growth · sell at horizon
- IRR
- 14.8%
- Equity multiple
- 1.59×
- Total profit
- $48,841
- Equity at exit
- $43,985
- IRR
- 23.5%
- Equity multiple
- 3.02×
- Total profit
- $167,161
- Equity at exit
- $25,506
Cash invested: $82,600 (down + closing). Projections, not guarantees.
Landlord ↔ Tenant lean methodology
- Overall (STATE)
- 90 Strongly Landlord-Friendly
- State Louisiana
- 90 Strongly Landlord-Friendly · R+12
- County
- — inherits STATE
- City
- — inherits STATE
ZIP-level market 70570
- Home prices YoY
- -34.7%
- Active inventory
- 309
- Price-to-rent
- 27.3×
Monthly cashflow live
- Estimated rent
- $4,500 medium interval (Pro) →
- Mortgage (P&I)
- −$1,547
- Tax est. 1.5%
- −$369 /mo · $4,425/yr
- Insurance
- −$123
- HOA
- −$0
- Vacancy / Maint / Mgmt
- −$945
- Net cashflow
- $1,516
Break-even live
5-unit breakdown (identical units grouped — click to expand)
| Units | Beds | Baths | Est. rent |
|---|---|---|---|
| 5× units | 3 | 1.5 | $4,500 |
| #1 | 3 | 1.5 | $900 |
| #2 | 3 | 1.5 | $900 |
| #3 | 3 | 1.5 | $900 |
| #4 | 3 | 1.5 | $900 |
| #5 | 3 | 1.5 | $900 |
| Total (5 units) | $4,500 | ||
UW: 25.0% down · 7.5% · 30yr · 1.5% tax · 5.0% vac · 8.0% maint · 8.0% mgmt
Financing live
Cash to close
- Down payment
- $73,750
- Closing costs
- $8,850
- Reserves months
- —
- Total cash needed
- —
Loan-product check · same deal, 3 products live
Conventional
25% down · 7.5% · 30yr
- Down + closing
- —
- Monthly P&I
- —
- Monthly cashflow
- —
- DSCR
- —
- Eligible?
- —
Personal DTI + credit; lowest rate.
DSCR
20% down · 8.5% · 30yr
- Down + closing
- —
- Monthly P&I
- —
- Monthly cashflow
- —
- DSCR
- —
- Eligible?
- —
No personal income docs; deal must DSCR.
Hard money
10% down · 12.0% · 12mo
- Down + closing
- —
- Monthly P&I
- —
- Monthly cashflow
- —
- DSCR
- —
- Eligible?
- —
Short-term bridge; refi at stabilization.
Listing history 7 events
-
2026-06-18days on market $295,000 Active 8 DOM
-
2026-06-17days on market $295,000 Active 7 DOM
-
2026-06-16days on market $295,000 Active 6 DOM
-
2026-06-15days on market $295,000 Active 5 DOM
-
2026-06-13days on market $295,000 Active 3 DOM
-
2026-06-12remarks 352-char remark
-
2026-06-12$295,000 Active 2 DOM
ⓘ Source: listings_history table (triggers on properties + properties_extension) + one-shot
backfill from property_details.listing_events for pre-trigger history.
Climate risk First Street
- Flood 1/10 Low FEMA zone X (unshaded) · 0% chance over 30 yrs
- Wildfire 1/10 Low
- Heat 8/10 Severe 7 d/yr ≥110°F today · 20 d/yr by 30 yrs out
- Wind 9/10 Extreme 99% chance of damaging wind over 30 yrs
- Air quality 1/10 Low 0 unhealthy d/yr today · 0 by 30 yrs out
Nearby sold comps map
Loading sold comps map…
Walkable amenities ~0.75 mi
Loading nearby amenities…
Taxation est. · year 1
- Rental income
- $54,000
- − Mortgage interest
- −$16,525
- − Property taxes
- −$4,425
- − Insurance
- −$1,475
- − Repairs & maintenance
- −$4,320
- − Management
- −$4,320
- − Depreciation
- −$8,582
- Taxable income
- $14,354
- Est. tax owed @ 24.0%
- −$3,445
- After-tax cash flow
- $14,751/yr
For passive investors: Depreciation is non-cash, so a rental often shows a tax loss while cash-flowing — sheltering income. Rental losses are passive: they offset passive income freely, and up to $25,000/yr can offset ordinary (W-2) income if you actively participate and your MAGI is under $100k (phasing out to $0 by $150k); unused losses carry forward. On sale, claimed depreciation is recaptured at up to 25%, and gains may owe capital-gains tax (a 1031 exchange can defer both). Figures are a year-1 estimate at your 24.0% rate — not tax advice; consult a CPA.
Condition & rehab AI · 12 photos
This multi-family property requires extensive renovations to improve its condition and increase its value. Significant repairs and updates are needed in the kitchen, bathrooms, roof, exterior, flooring, and paint. Landscaping and HVAC improvements will also enhance the property's curb appeal and comfort.
Repairs flagged
- Major Kitchen cabinets — Old and outdated
- Major Bathroom fixtures — Old and outdated
- Major Roof — Visible wear and tear
- Major Exterior siding — Peeling paint
- Major Flooring — Worn-out and outdated
- Major Paint — Old and peeling
- Major HVAC system — No visible signs of recent maintenance
Value-add opportunities
- Both New kitchen cabinets and countertops — Modernizes the space and increases appeal
- Both New bathroom fixtures and tiles — Modernizes the space and increases appeal
- Both New roof — Improves the structural integrity and appearance
- Both New exterior siding and paint — Improves the structural integrity and appearance
- Both New flooring — Modernizes the space and increases appeal
- Both New paint — Modernizes the space and increases appeal
- Both New HVAC system — Improves comfort and energy efficiency
Renovation cost estimate screening
| Repair item | Severity | Est. cost |
|---|---|---|
| Kitchen cabinets · Old and outdated | Major | $15,000–50,000 |
| Bathroom fixtures · Old and outdated | Major | $15,000–50,000 |
| Roof · Visible wear and tear | Major | $15,000–50,000 |
| Exterior siding · Peeling paint | Major | $15,000–50,000 |
| Flooring · Worn-out and outdated | Major | $15,000–50,000 |
| Paint · Old and peeling | Major | $15,000–50,000 |
| HVAC system · No visible signs of recent maintenance | Major | $15,000–50,000 |
| Total estimated repair cost · 7 items | $105,000–350,000 |
Value-add ROI direction
- Both New kitchen cabinets and countertops — Modernizes the space and increases appeal ↑
- Both New bathroom fixtures and tiles — Modernizes the space and increases appeal ↑
- Both New roof — Improves the structural integrity and appearance ↑
- Both New exterior siding and paint — Improves the structural integrity and appearance ↑
- Both New flooring — Modernizes the space and increases appeal ↑
- Both New paint — Modernizes the space and increases appeal ↑
- Both New HVAC system — Improves comfort and energy efficiency ↑
ⓘ Cost ranges are severity-bucket heuristics (US national rule-of-thumb). Get contractor quotes + a written scope before underwriting a rehab budget.
Schools (NCES district)
- District
- St. Landry Parish
- NCES district ID
- 2201560
- Math proficiency
- 20% ▼ -43.00%
- Reading proficiency
- 33% ▼ -35.00%
- Median HH income
- $32,635
- Composite
- 21.59/100
- National rank
- #8303
- State rank
- #54 of 98 in LA
Livability — Opelousas
- Score
- 63/100
- State rank
- #187
- US rank
- #14928
Category grades
Schools grade is shown separately in the Schools card above.
Census & demographics
- Census place
- Opelousas, LA
- Population (ZIP)
- 37,188
Population outlook (St. Landry County) Hauer SSP2
- Today (2025)
- 83,114 people
- By 2030
- 82,110 · -1.2%
- By 2040
- 79,445 · -4.4%
- By 2050
- 75,855 · -8.7%
- By 2075
- 65,684 · -21.0%
- By 2100
- 51,739 · -37.7%
Race, ethnicity, and origin ACS 2023
- Neighborhood character
- Diverse neighborhood (Simpson 0.56)
- Race & ethnicity
- Black 55% White 37% Two or more races 4% Hispanic / Latino 4%
- Common ancestry
- Lithuanian 8%
- Foreign-born
- 1% · Canada
- Languages at home
- 92% English-only · French/Haitian/Cajun 5% Spanish 3%
Political lean MEDSL · St. Landry
- 2024 margin
- R (+18.8) · D 40.0% · R 58.9% · Other 1.1%
- 2008→2024 swing
- -15.6pp toward R · 2008: -3.2pp · 2024: -18.8pp
- All cycles
- 2024: R+18.8 2020: R+14.1 2016: R+11.9 2012: R+4.3 2008: R+3.2
Not yet ingested
- Civics
- —
Market trends
- HPI YoY
- ▼ -52.38%
- Current HPI
- 98.4256
- Rent YoY
- —
- Metro
- —
- State GDP YoY
- ▲ 3.29%
- F500 in state
- 10
Industry mix (Fortune 500 HQ in LA)
| Industry | F500 HQs | Revenue |
|---|---|---|
| Telecommunications | 2 | $23B |
|
||
| Utilities | 1 | $12B |
|
||
| Wholesale / Distribution | 1 | $5B |
|
||
| Advertising | 1 | $2B |
|
||
Price history
1 event — show timeline
- 2026-06-09 Listed $295,000 AcadianaMLS
Cash-flow waterfall
monthlySold comps — $/sqft
last 12 mo · ≤1 miLoading sold comps…