23501 Flickering Sky Dr · Elgin, TX
Flood risk No data
- FEMA flood zone
- —
- Chance of flooding over 30 yrs
- —
- Est. flood insurance / yr
- —
Fire risk No data
- Est. fire insurance / yr
- —
Heat risk No data
- Hot days now (above threshold)
- —
- Hot days in 30 yrs
- —
Wind risk No data
- Chance of severe wind over 30 yrs
- —
Air-quality risk No data
- Unhealthy air days now
- —
- Unhealthy air days in 30 yrs
- —
Risk factors via First Street. Map © Google.
Why this score? — see what drove the C grade
The composite is a weighted blend of 9 inputs, each scored 0–100. Each bar is that input's sub-score; the figure is the points it added to the 100-point composite (weight × sub-score).
- Cash flow +13.6/30.0
- ARV discount +12.3/15.0
- Appreciation +10.0/10.0
- Condition / age +4.8/5.0
- 1% rule +4.1/10.0
- DSCR +4.1/10.0
- Livability +3.7/5.0
- Rent growth +3.3/5.0
- Schools +2.0/10.0
$236,999
🖨 Deal sheet 📄 Offer letter ✓ Due diligence
Listing remarks MLS
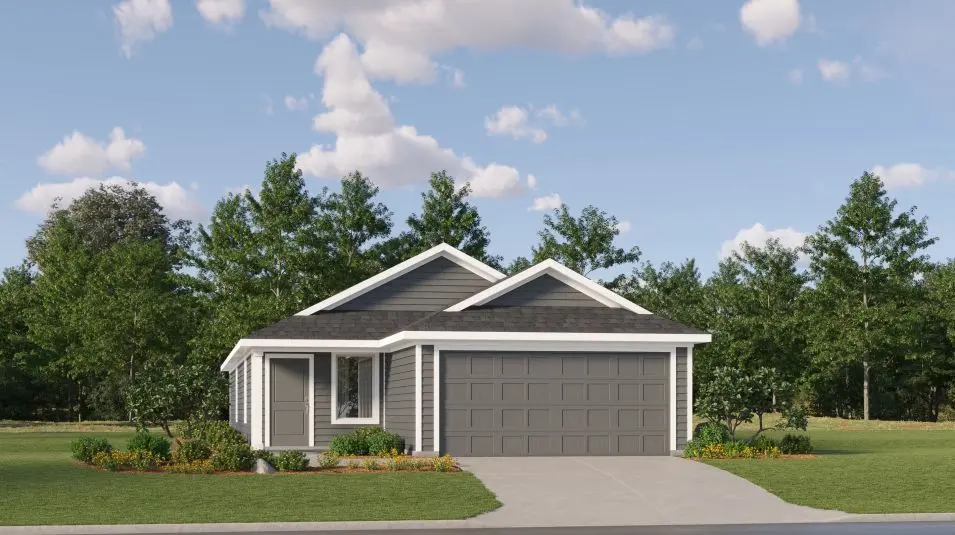
This single-level home showcases a spacious open floorplan shared between the kitchen, dining area and family room for easy entertaining. An owner's suite enjoys a private location in a rear corner of the home, complemented by an en-suite bathroom and walk-in closet. There are three secondary bedrooms along the side of the home, which are comfortable spaces for household members and overnight guests.
Key facts
- Walk-in closet
- Open floorplan
- Secondary bedrooms
Tags
Property features AI
Finance
- HOA & community: Homeowners association (Elm Creek HOA) with $55 monthly fee covering common area maintenance; Community features: playground, park, pool, trails/paths
Exterior
- Parking: Attached garage; 2 covered parking spaces (2 total)
- Utilities: Electricity available; Public water; Public sewer (connected)
- Home design: Single-story; New construction by Lennar; Faces northeast; Slab foundation
- Construction: Brick, cement siding, and stone exterior; Composition roof
- Exterior features: Private yard; Porch; Privacy fencing; Back yard; Front yard; Interior lot; Community pool
Interior
- Kitchen: Dishwasher; Range
- Bedrooms: 4 main-level bedrooms
- Flooring: Carpet; Vinyl
- Bathrooms: 2 full bathrooms
- Heating & cooling: Central heating; Central air conditioning
- Interior features: Open floorplan; Walk-in closet(s)
- Laundry & utility: Dedicated laundry room
Neighborhood map
What this means for you Summary
Snapshot
- This is a 4-bed/2.0-bath single-family listed at $237k. Condition is rated excellent.
Deal economics
- At list price, monthly cash flow is $14 ($174/yr) — positive.
- The deal already cash-flows at list — no discount required.
- To meet the 1% rule (rent ≥ 1% of price), the offer needs to be $216k (8.8% below list).
- Recommended offer: $216k (8.8% below list) — sets the bar for 1% rule.
- Cap rate 6.4% vs local median 4.4% in Elgin — top-decile yield for the area; either an underpriced asset or a hidden risk that comps aren't pricing in. Stress-test before assuming the spread holds.
Location & tenants
- Location reads 74/100 on livability (#167 in TX, #4,404 nationally) — a middle-class / working-renter tenant base. Strengths: cost of living A+, housing A+, health & safety A+; Watch: schools F, amenities F, commute F.
- Elgin ISD (rural): math 17% / reading 26% proficiency, ranked #741 of 826 in TX (top 90%) — low school quality limits family demand, transient renter base, plan for 1-2y turnover; 67% free/reduced lunch — lower-income household profile, screen leases tightly.
- Market conditions: Rents rising (+3.1%/yr); 807 active listings in the ZIP; 17 comparable units currently listed for rent nearby; rentals at typical pace (median 20d on market — plan ~3-4 weeks tenant-placement turnaround); solid renter incomes; 17,121 units permitted in Travis County in 2024 (11,963 in 5+ unit buildings).
Forward outlook
- In year one you build about $25k of equity ($2k loan paydown + $24k appreciation (10.0% local appreciation)).
- Travis County population projected at +60% by 2050 — long-run rental-demand tailwind backs the buy-and-hold thesis.
- At projected returns (10.0% appreciation + 3.1% rent growth), your $66k cash investment doubles in ~3 years — after that, you're playing with house money.
- By year 2, paydown + projected appreciation supports a ~$41k cash-out refi (75% LTV) — recoverable capital for the next deal without selling this one.
Negotiation context
- It's been on market 31 days — a 3% lower offer ($230k) is reasonable based on typical stale-listing flexibility.
- 2 sale attempts; this cycle's ask has dropped $20k (8%) from the opening price — seller is motivated, your offer sets the floor, not the list.
Questions for the listing agent
- It's been on market 31 days. Have you received any prior offers? Is the seller open to a 9% concession, seller financing, or rate buy-down credit?
- What does the HOA fee cover, when was the last increase, and are there any pending special assessments or reserve-fund shortfalls?
- Is there a deadline driving the sale (1031 exchange, divorce, estate, relocation)? That informs how much negotiation room exists.
- Schools are F-rated, which usually means shorter tenancies and higher turnover. Who's the typical renter profile here, and what's been the actual vacancy rate?
- What's the average days-on-market for RENTAL listings here right now (not sales)? A rising rental-DOM trend means longer vacancies and softer asking-rent achievability than the comps imply.
- What's the recent tenant-quality profile in this submarket — average credit score on applications, eviction rate, late-payment / NSF rate, and stable-employment percentage? A property-management company in the area should have these aggregated.
- How much new for-sale + rental construction is in the pipeline within 1–3 miles? Heavy new supply typically softens prices + rents 12–24 months out; constrained supply supports both.
Investment metrics
- 1% rule
- 0.91% ✗
- Cap rate
- 6.37%
- Cash-on-cash
- 0.26%
- DSCR
- 1.01
- GRM
- 9.1
CMA / ARV
- ARV (on-the-fly)
- $265,600
- Comps found
- 12
Show comp detail 12 sales within ~0.75 mi
| Address | Dist | Beds/Ba | Sqft | Sold | Price | $/sf | Match |
|---|---|---|---|---|---|---|---|
| 13409 Trumpet Creeper Dr | 0.04mi | 4/2.0 | 1,575 (-2%) | 1mo | $248,990 | $158 | 95 |
| 13400 Trumpet Creeper Dr | 0.08mi | 3/2.0 (-1) | 1,510 (-6%) | 1mo | $257,990 | $171 | 81 |
| 13324 Trumpet Creeper Dr | 0.09mi | 3/2.0 (-1) | 1,510 (-6%) | 2mo | $252,990 | $168 | 80 |
| 13316 Trumpet Creeper Dr | 0.11mi | 3/2.0 (-1) | 1,510 (-6%) | 1mo | $250,999 | $166 | 80 |
| 23821 Glowing Embers Dr | 0.35mi | 4/2.0 | 1,667 (+4%) | 1mo | $245,999 | $148 | 76 |
| 23829 Glowing Embers Dr | 0.37mi | 4/2.0 | 1,667 (+4%) | 2mo | $249,990 | $150 | 74 |
| 13421 Trumpet Creeper Dr | 0.04mi | 3/2.0 (-1) | 1,402 (-12%) | 1mo | $241,999 | $173 | 72 |
| 13405 Trumpet Creeper Dr | 0.05mi | 3/2.0 (-1) | 1,411 (-12%) | 2mo | $237,990 | $169 | 72 |
| 13321 Trumpet Creeper Dr | 0.08mi | 3/2.0 (-1) | 1,411 (-12%) | 1mo | $237,999 | $169 | 71 |
| 13309 Trumpet Creeper Dr | 0.10mi | 3/2.0 (-1) | 1,402 (-12%) | 2mo | $226,990 | $162 | 68 |
| 23501 Firelight Dr | 0.13mi | 3/2.0 (-1) | 1,411 (-12%) | 2mo | $228,990 | $162 | 68 |
| 23817 Glowing Embers Dr | 0.34mi | 3/2.0 (-1) | 1,474 (-8%) | 1mo | $221,990 | $151 | 65 |
Match score weights: distance 35% · size 25% · config 20% · recency 20%. Top-matched comps best support the ARV.
Projected returns pro-forma
10.0% appreciation · 3.12% rent growth · sell at horizon
- IRR
- 24.5%
- Equity multiple
- 2.96×
- Total profit
- $130,326
- Equity at exit
- $213,507
- IRR
- 21.7%
- Equity multiple
- 6.78×
- Total profit
- $383,728
- Equity at exit
- $460,437
Cash invested: $66,360 (down + closing). Projections, not guarantees.
Landlord ↔ Tenant lean methodology
- Overall (STATE)
- 87 Strongly Landlord-Friendly
- State Texas
- 87 Strongly Landlord-Friendly · R+5
- County
- — inherits STATE
- City
- — inherits STATE
ZIP-level market 78621
- Home prices YoY
- 7.6%
- Rents YoY
- 3.1%
- Active inventory
- 807
- Price-to-rent
- 9.1×
Monthly cashflow live
- Estimated rent
- $2,161 high interval (Pro) →
- Mortgage (P&I)
- −$1,243
- Tax est. 1.5%
- −$296 /mo · $3,555/yr
- Insurance
- −$99
- HOA
- −$55
- Vacancy / Maint / Mgmt
- −$454
- Net cashflow
- $14
Break-even live
UW: 25.0% down · 7.5% · 30yr · 1.5% tax · 5.0% vac · 8.0% maint · 8.0% mgmt
Financing live
Cash to close
- Down payment
- $59,250
- Closing costs
- $7,110
- Reserves months
- —
- Total cash needed
- —
Loan-product check · same deal, 3 products live
Conventional
25% down · 7.5% · 30yr
- Down + closing
- —
- Monthly P&I
- —
- Monthly cashflow
- —
- DSCR
- —
- Eligible?
- —
Personal DTI + credit; lowest rate.
DSCR
20% down · 8.5% · 30yr
- Down + closing
- —
- Monthly P&I
- —
- Monthly cashflow
- —
- DSCR
- —
- Eligible?
- —
No personal income docs; deal must DSCR.
Hard money
10% down · 12.0% · 12mo
- Down + closing
- —
- Monthly P&I
- —
- Monthly cashflow
- —
- DSCR
- —
- Eligible?
- —
Short-term bridge; refi at stabilization.
Rent comps 17 comps
| Address | Beds | Baths | Sqft | Rent | $/sqft | DOM | Units | Dist |
|---|---|---|---|---|---|---|---|---|
| 23408 Tiny Moons Way Elgin, TX | 4.0 | 2.5 | 2000 | $1,960 | $0.98 | 20d | 1 | 0.16mi |
| 13249 Illumination Rd Unit R3 Elgin, TX | 4.0 | 3.0 | 2000 | $560 | $0.28 | 21d | 1 | 0.26mi |
| 13249 Illumination Rd Unit R2 Elgin, TX | 4.0 | 3.0 | 2000 | $600 | $0.30 | 17d | 1 | 0.26mi |
| 13249 Illumination Rd Unit R4 Elgin, TX | 4.0 | 3.0 | 2000 | $589 | $0.29 | 43d | 1 | 0.36mi |
| 13501 Mussel Run Elgin, TX | 4.0 | 2.0 | 1667 | $1,800 | $1.08 | 16d | 1 | 0.60mi |
| 13305 Banquete St Elgin, TX | 4.0 | 2.0 | 1707 | $1,995 | $1.17 | 43d | 1 | 0.62mi |
| 13124 Maidenhair Trl Elgin, TX | 4.0 | 2.0 | 1448 | $1,775 | $1.23 | 16d | 1 | 0.70mi |
| 13124 Maidenhair Trl Elgin, TX | 4.0 | 2.0 | 1448 | $1,775 | $1.23 | 23d | 1 | 0.70mi |
| 13520 Knights Branch Dr Elgin, TX | 3.0 | 2.5 | 1600 | $1,850 | $1.16 | 2d | 1 | 0.75mi |
| 13604 Menard Way Elgin, TX | 3.0 | 2.0 | 1474 | $1,875 | $1.27 | 23d | 1 | 0.76mi |
| 17812 Prairie Verbena Ln Elgin, TX | 3.0 | 2.5 | 2049 | $2,199 | $1.07 | 43d | 1 | 0.77mi |
| 13725 Knights Branch Dr Elgin, TX | 4.0 | 2.5 | 1800 | $2,100 | $1.17 | 23d | 1 | 0.86mi |
| 13804 Knights Branch Dr Elgin, TX | 3.0 | 2.5 | 1427 | $1,900 | $1.33 | 4d | 1 | 0.87mi |
| 13121 Blackeyed Susan Trl Elgin, TX | 4.0 | 2.0 | 1586 | $1,800 | $1.13 | 17d | 1 | 0.93mi |
| 14129 Tordillo Dr Elgin, TX | 4.0 | 2.5 | 1874 | $2,675 | $1.43 | 23d | 1 | 0.99mi |
| 14129 Tordillo Dr Unit NA Elgin, TX | 4.0 | 2.5 | 1874 | $2,595 | $1.38 | 4d | 1 | 0.99mi |
| 13501 Sierra Wind Ln Elgin, TX | 4.0 | 2.5 | 2066 | $2,500 | $1.21 | 20d | 1 | 1.35mi |
HOA detail
- Monthly dues
- $55 · $660/yr
Listing history 17 events
-
2026-06-18days on market $236,999 Active 31 DOM
-
2026-06-17days on market $236,999 Active 30 DOM
-
2026-06-16days on market $236,999 Active 29 DOM
-
2026-06-15days on market $236,999 Active 28 DOM
-
2026-06-13days on market $236,999 Active 26 DOM
-
2026-06-09days on market $236,999 Active 22 DOM
-
2026-06-08days on market $236,999 Active 21 DOM
-
2026-06-07days on market $236,999 Active 20 DOM
-
2026-06-04days on market $236,999 Active 17 DOM
-
2026-06-03days on market $236,999 Active 16 DOM
-
2026-06-02days on market $236,999 Active 15 DOM
-
2026-06-01days on market $236,999 Active 14 DOM
-
2026-05-31days on market $236,999 Active 13 DOM
-
2026-05-20price $236,999
-
2026-05-19price $236,999 403-char remark
Show marketing remark (403 chars)
This single-level home showcases a spacious open floorplan shared between the kitchen, dining area and family room for easy entertaining. An owner's suite enjoys a private location in a rear corner of the home, complemented by an en-suite bathroom and walk-in closet. There are three secondary bedrooms along the side of the home, which are comfortable spaces for household members and overnight guests.
-
2026-05-18$256,999 Active 403-char remark
Show marketing remark (403 chars)
This single-level home showcases a spacious open floorplan shared between the kitchen, dining area and family room for easy entertaining. An owner's suite enjoys a private location in a rear corner of the home, complemented by an en-suite bathroom and walk-in closet. There are three secondary bedrooms along the side of the home, which are comfortable spaces for household members and overnight guests.
-
2026-05-18$256,999 Active
Show marketing remark (403 chars)
This single-level home showcases a spacious open floorplan shared between the kitchen, dining area and family room for easy entertaining. An owner's suite enjoys a private location in a rear corner of the home, complemented by an en-suite bathroom and walk-in closet. There are three secondary bedrooms along the side of the home, which are comfortable spaces for household members and overnight guests.
ⓘ Source: listings_history table (triggers on properties + properties_extension) + one-shot
backfill from property_details.listing_events for pre-trigger history.
Nearby sold comps map
Loading sold comps map…
Walkable amenities ~0.75 mi
Loading nearby amenities…
Taxation est. · year 1
- Rental income
- $25,934
- − Mortgage interest
- −$13,276
- − Property taxes
- −$3,555
- − Insurance
- −$1,185
- − Repairs & maintenance
- −$2,075
- − Management
- −$2,075
- − HOA
- −$660
- − Depreciation
- −$6,895
- Taxable loss
- −$3,785
- Est. tax savings @ 24.0%
- +$909
- After-tax cash flow
- $1,082/yr
For passive investors: Depreciation is non-cash, so a rental often shows a tax loss while cash-flowing — sheltering income. Rental losses are passive: they offset passive income freely, and up to $25,000/yr can offset ordinary (W-2) income if you actively participate and your MAGI is under $100k (phasing out to $0 by $150k); unused losses carry forward. On sale, claimed depreciation is recaptured at up to 25%, and gains may owe capital-gains tax (a 1031 exchange can defer both). Figures are a year-1 estimate at your 24.0% rate — not tax advice; consult a CPA.
Condition & rehab AI · 19 photos
This single-level home showcases a spacious open floorplan with modern finishes and excellent condition. It is move-in ready with minimal maintenance required.
Value-add opportunities
- Both Painting exterior and interior walls — Enhances curb appeal and interior aesthetics
- Both Landscaping improvements — Enhances curb appeal and adds value
- Both Add smart home features — Improves convenience and adds modern appeal
Renovation cost estimate screening
Value-add ROI direction
- Both Painting exterior and interior walls — Enhances curb appeal and interior aesthetics ↑
- Both Landscaping improvements — Enhances curb appeal and adds value ↑
- Both Add smart home features — Improves convenience and adds modern appeal ↑
ⓘ Cost ranges are severity-bucket heuristics (US national rule-of-thumb). Get contractor quotes + a written scope before underwriting a rehab budget.
Schools (NCES district)
- District
- Elgin ISD
- NCES district ID
- 4818360
- Math proficiency
- 17% ▼ -9.00%
- Reading proficiency
- 26% ▼ -5.00%
- Median HH income
- $55,176
- Composite
- 19.62/100
- National rank
- #8749
- State rank
- #741 of 826 in TX
Livability — Elgin
- Score
- 74/100
- State rank
- #167
- US rank
- #4404
Category grades
Schools grade is shown separately in the Schools card above.
Census & demographics
- County
- Bastrop County · 68,601 people
- City population
- 27,860
- Metro
- Austin-Round Rock-Georgetown, TX
- Population (ZIP)
- 30,411
- Household income
- $98,534
- Rent vs Own
- Severe rent burden
- 235.0
Population outlook (Travis County) Hauer SSP2
- Today (2025)
- 1,545,133 people
- By 2030
- 1,729,269 · +11.9%
- By 2040
- 2,097,596 · +35.8%
- By 2050
- 2,463,890 · +59.5%
- By 2075
- 3,249,374 · +110.3%
- By 2100
- 3,801,868 · +146.1%
Race, ethnicity, and origin ACS 2023
- Neighborhood character
- Diverse neighborhood (Simpson 0.64)
- Race & ethnicity
- Hispanic / Latino 46% White 38% Two or more races 19% Black 11% Native American 1%
- Hispanic origin (detail)
- Mexican 38%
- Common ancestry
- Slovak 2% Italian 2% Romanian 1%
- Foreign-born
- 17% · Canada, Vietnam
- Languages at home
- 63% English-only · Spanish 36%
Political lean MEDSL · Travis
- 2024 margin
- Solid D (+39.3) · D 68.8% · R 29.4% · Other 1.8%
- 2008→2024 swing
- +9.9pp toward D · 2008: 29.4pp · 2024: 39.3pp
- All cycles
- 2024: D+39.3 2020: D+45.0 2016: D+38.9 2012: D+23.9 2008: D+29.4
Not yet ingested
- Civics
- —
Market trends
- HPI YoY
- ▲ 29.47%
- Current HPI
- 416.87
- Rent YoY
- ▲ 3.12%
- Metro
- Austin-Round Rock-Georgetown, TX
- State GDP YoY
- ▲ 3.95%
- F500 in state
- 110
Industry mix (Fortune 500 HQ in TX)
| Industry | F500 HQs | Revenue |
|---|---|---|
| Energy | 16 | $1,198B |
|
||
| Technology | 5 | $198B |
|
||
| Engineering / Construction | 4 | $72B |
|
||
| Energy Services | 3 | $60B |
|
||
| Utilities | 3 | $41B |
|
||
| Healthcare | 2 | $330B |
|
||
Price history
-7.8% since first listed4 events — show timeline
- 2026-05-20 Price Changed $236,999 Unlock MLS
- 2026-05-19 Price Changed $236,999 Zillow
- 2026-05-18 Listed $256,999 Zillow
- 2026-05-18 Listed $256,999 Unlock MLS
Cash-flow waterfall
monthlySold comps — $/sqft
last 12 mo · ≤1 miLoading sold comps…