1209 3rd St · Spencer, NC
Flood risk 1/10 · Minimal
- FEMA flood zone
- X (unshaded)
- Chance of flooding over 30 yrs
- 0.0%
- Est. flood insurance / yr
- $507 – $1,088
Fire risk 3/10 · Minor
- Est. fire insurance / yr
- $906 – $1,684
Heat risk 6/10 · Moderate
- Hot days now (above 104°F)
- 7 days/yr
- Hot days in 30 yrs
- 17 days/yr
Wind risk 4/10 · Minor
- Chance of severe wind over 30 yrs
- 11.0%
Air-quality risk 2/10 · Minimal
- Unhealthy air days now
- 2 days/yr
- Unhealthy air days in 30 yrs
- 2 days/yr
Risk factors via First Street. Map © Google.
Why this score? — see what drove the A- grade
The composite is a weighted blend of 9 inputs, each scored 0–100. Each bar is that input's sub-score; the figure is the points it added to the 100-point composite (weight × sub-score).
- Cash flow +27.6/30.0
- ARV discount +15.0/15.0
- Appreciation +10.0/10.0
- DSCR +9.7/10.0
- 1% rule +7.5/10.0
- Livability +3.1/5.0
- Schools +2.6/10.0
- Rent growth +2.5/5.0
- Condition / age +2.5/5.0
$125,000
🖨 Deal sheet (PDF) 📄 Offer letter ✓ Due diligence
Listing remarks
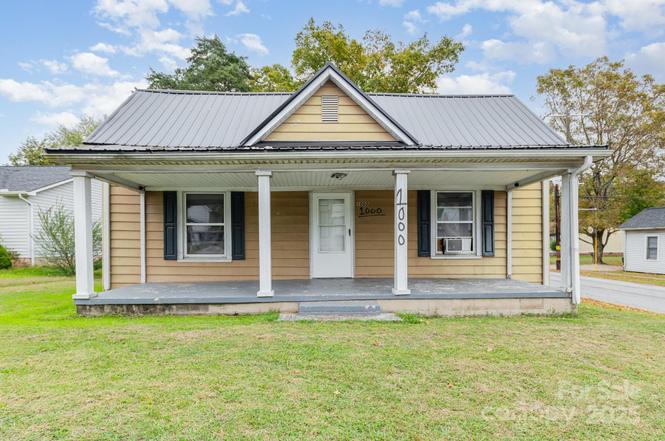
Own a promising 3-bedroom home just waiting for someone to unlock its potential. This property features a solid structure with a roof only 2 years old, offering peace of mind and reduced maintenance costs upfront. Inside, you’ll find a flexible layout ready for your improvements. Ideal for recasting spaces into modern bedrooms, an updated kitchen, or bonus living areas. The good bones of the home are there; cosmetic upgrades and vision will really drive the value. With some love and strategic updates, this one can deliver great return. Don’t miss your chance schedule a showing today and see why this home is a great canvas for your next project.
Key facts
- Bonus living areas
- Modern bedrooms
- Flexible layout
Tags
Property features AI
Finance
- HOA & community: No HOA
Exterior
- Parking: Driveway
- Utilities: City water; Public sewer
- Home design: Single-family residence; One story; Site built
- Construction: Vinyl exterior; Slab foundation
- Exterior features: Dirt and gravel road access; Publicly maintained road
Interior
- Kitchen: Electric range; Refrigerator
- Bedrooms: 3 bedrooms on the main level
- Bathrooms: 2 full bathrooms on the main level
- Heating & cooling: Forced air heating (natural gas); Ceiling fan cooling
- Interior features: 8 total rooms; Ceiling fan(s)
- Laundry & utility: Laundry room on the main level
Neighborhood map
What this means for you Summary
Snapshot
- This is a 3-bed/2.0-bath single-family listed at $125k.
Deal economics
- At list price, monthly cash flow is $373 ($4k/yr) — positive.
- The deal already cash-flows at list — no discount required.
- Meets the 1% rule at list price ($2k rent vs $125k).
- Recommended offer: $110k (12.0% below list) — sets the bar for market timing.
- Cap rate 9.9% vs local median 4.9% in Spencer — top-decile yield for the area; either an underpriced asset or a hidden risk that comps aren't pricing in. Stress-test before assuming the spread holds.
Location & tenants
- Location reads 61/100 on livability (#482 in NC) — a middle-class / working-renter tenant base. Strengths: cost of living A+, housing A+, crime B+; Watch: employment C-, amenities F, commute F.
- Rowan-Salisbury Schools (rural): math 26% / reading 35% proficiency, ranked #142 of 178 in NC (top 80%) — families likely to look elsewhere, expect single-tenant / working-renter base with shorter leases.
- Zoned schools: North Rowan Elementary (math 12% / reading 27%, grade F, #1,242 of 1,410 statewide, top 90%, 426 students, 92% FRL); North Rowan High (math 2% / reading 37%, grade F, #492 of 535 statewide, top 93%, 589 students, 66% FRL) — zoned schools average 79% FRL vs 54% district-wide (25 pts higher); higher-poverty schools than district average — tighter screening recommended.
- Market conditions: 24 active listings in the ZIP; 2 comparable units currently listed for rent nearby; 592 units permitted in Rowan County in 2024 (5 in 5+ unit buildings).
Forward outlook
- In year one you build about $13k of equity ($864 loan paydown + $12k appreciation (10.0% local appreciation)).
- Rowan County population projected to shrink 6% by 2050 — rents likely to lag national; underwrite the cash flow, not the appreciation.
- At projected returns (10.0% appreciation + 3.0% rent growth), your $35k cash investment doubles in ~2 years — after that, you're playing with house money.
- By year 3, paydown + projected appreciation supports a ~$34k cash-out refi (75% LTV) — recoverable capital for the next deal without selling this one.
Negotiation context
- It's been on market 248 days — a 12% lower offer ($110k) is reasonable based on typical stale-listing flexibility.
Risks & watch-outs
- Climate carrying-cost: extreme-heat days projected 7→17/yr by 2055 (HVAC capex compounding) — expect insurance premiums to compound above CPI over the hold.
Questions for the listing agent
- It's been on market 248 days. Have you received any prior offers? Is the seller open to a 12% concession, seller financing, or rate buy-down credit?
- Why hasn't it sold? Are there any deal-killer items the seller is aware of (foundation, flood, title, zoning, code violations)?
- Is there a deadline driving the sale (1031 exchange, divorce, estate, relocation)? That informs how much negotiation room exists.
- Schools are F-rated, which usually means shorter tenancies and higher turnover. Who's the typical renter profile here, and what's been the actual vacancy rate?
- What's the average days-on-market for RENTAL listings here right now (not sales)? A rising rental-DOM trend means longer vacancies and softer asking-rent achievability than the comps imply.
- What's the recent tenant-quality profile in this submarket — average credit score on applications, eviction rate, late-payment / NSF rate, and stable-employment percentage? A property-management company in the area should have these aggregated.
- How much new for-sale + rental construction is in the pipeline within 1–3 miles? Heavy new supply typically softens prices + rents 12–24 months out; constrained supply supports both.
Investment metrics
- 1% rule
- 1.25% ✓
- Cap rate
- 9.88%
- Cash-on-cash
- 12.80%
- DSCR
- 1.57
- GRM
- 6.7
CMA / ARV
- ARV (on-the-fly)
- $227,392
- Comps found
- 12
Show comp detail 12 sales within ~0.75 mi
| Address | Dist | Beds/Ba | Sqft | Sold | Price | $/sf | Match |
|---|---|---|---|---|---|---|---|
| 111 Pinecroft Ln | 0.24mi | 3/2.5 | 1,356 (+5%) | 3mo | $245,000 | $181 | 76 |
| 1100 2nd St | 0.12mi | 2/2.5 (-1) | 1,200 (-7%) | 0mo | $65,000 | $54 | 75 |
| 607 Meadow St | 0.47mi | 3/2.0 | 1,333 (+3%) | 1mo | $235,000 | $176 | 72 |
| 514 Second St | 0.53mi | 3/2.0 | 1,318 (+2%) | 1mo | $230,000 | $175 | 71 |
| 605 Meadow St | 0.47mi | 3/2.0 | 1,313 (+2%) | 4mo | $235,000 | $179 | 71 |
| 603 Meadow St | 0.48mi | 3/2.0 | 1,343 (+4%) | 2mo | $235,000 | $175 | 70 |
| 502 6th St | 0.68mi | 3/1.5 | 1,323 (+2%) | 1mo | $233,000 | $176 | 62 |
| 420 S Iredell Ave | 0.65mi | 3/2.5 | 1,255 (-3%) | 3mo | $245,000 | $195 | 61 |
| 702 3rd St | 0.40mi | 2/1.0 (-1) | 1,226 (-5%) | 6mo | $215,000 | $175 | 58 |
| 707 5th St | 0.56mi | 3/2.0 | 1,120 (-13%) | 2mo | $225,000 | $201 | 50 |
| 209B N Yadkin Ave N | 0.70mi | 3/2.0 | 1,456 (+13%) | 0mo | $238,000 | $163 | 46 |
| 510 5th St | 0.63mi | 2/1.0 (-1) | 1,419 (+10%) | 6mo | $145,000 | $102 | 40 |
Match score weights: distance 35% · size 25% · config 20% · recency 20%. Top-matched comps best support the ARV.
Projected returns pro-forma
10.0% appreciation · 3.0% rent growth · sell at horizon
- IRR
- 33.7%
- Equity multiple
- 3.62×
- Total profit
- $91,871
- Equity at exit
- $112,610
- IRR
- 29.1%
- Equity multiple
- 8.20×
- Total profit
- $251,900
- Equity at exit
- $242,848
Cash invested: $35,000 (down + closing). Projections, not guarantees.
Landlord ↔ Tenant lean methodology
- Overall (STATE)
- 85 Strongly Landlord-Friendly
- State North Carolina
- 85 Strongly Landlord-Friendly · R+3
- County
- — inherits STATE
- City
- — inherits STATE
ZIP-level market 28159
- Home prices YoY
- 3.1%
- Active inventory
- 24
- Price-to-rent
- 6.7×
Monthly cashflow live
- Estimated rent
- $1,566 medium interval (Pro) →
- Mortgage (P&I)
- −$656
- Tax est. 1.5%
- −$156 /mo · $1,875/yr
- Insurance
- −$52
- HOA
- −$0
- Vacancy / Maint / Mgmt
- −$329
- Net cashflow
- $373
Break-even live
Sensitivity live
| Price | -10% $460 | -5% $416 | +0% $373 | +5% $330 | +10% $287 |
|---|---|---|---|---|---|
| Rent | -10% $249 | -5% $311 | +0% $373 | +5% $435 | +10% $497 |
| Rate | -1.0pp $436 | -0.5pp $405 | base $373 | +0.5pp $341 | +1.0pp $308 |
UW: 25.0% down · 7.5% · 30yr · 1.5% tax · 5.0% vac · 8.0% maint · 8.0% mgmt
Financing live
Cash to close
- Down payment
- $31,250
- Closing costs
- $3,750
- Reserves months
- —
- Total cash needed
- —
Loan-product check · same deal, 3 products live
Conventional
25% down · 7.5% · 30yr
- Down + closing
- —
- Monthly P&I
- —
- Monthly cashflow
- —
- DSCR
- —
- Eligible?
- —
Personal DTI + credit; lowest rate.
DSCR
20% down · 8.5% · 30yr
- Down + closing
- —
- Monthly P&I
- —
- Monthly cashflow
- —
- DSCR
- —
- Eligible?
- —
No personal income docs; deal must DSCR.
Hard money
10% down · 12.0% · 12mo
- Down + closing
- —
- Monthly P&I
- —
- Monthly cashflow
- —
- DSCR
- —
- Eligible?
- —
Short-term bridge; refi at stabilization.
Rent comps 2 comps
| Address | Beds | Baths | Sqft | Rent | $/sqft | DOM | Units | Dist |
|---|---|---|---|---|---|---|---|---|
| 117 E Henderson St Salisbury, NC | 2.0 | 1.0 | 930 | $1,250 | $1.34 | 25d | 1 | 1.21mi |
| 411 E Torbush Dr Salisbury, NC | 3.0 | 2.0 | 1204 | $1,853 | $1.54 | 23d | 1 | 1.42mi |
Listing history 19 events
-
2026-06-21days on market $125,000 Active 248 DOM
-
2026-06-18days on market $125,000 Active 245 DOM
-
2026-06-17pricedays on market $125,000 Active 244 DOM
-
2026-06-15days on market $130,000 Active 243 DOM
-
2026-06-13days on market $130,000 Active 241 DOM
-
2026-06-10days on market $130,000 Active 237 DOM
-
2026-06-08days on market $130,000 Active 236 DOM
-
2026-06-07days on market $130,000 Active 235 DOM
-
2026-06-04days on market $130,000 Active 232 DOM
-
2026-06-03days on market $130,000 Active 231 DOM
-
2026-06-02days on market $130,000 Active 230 DOM
-
2026-06-01days on market $130,000 Active 229 DOM
-
2026-05-31days on market $130,000 Active 228 DOM
-
2026-05-04price $135,000
-
2026-02-04price $150,000
-
2026-01-07price $168,000
-
2025-11-22price $175,000
-
2025-10-29price $180,000
-
2025-10-15$200,000 Active
ⓘ Source: listings_history table (triggers on properties + properties_extension) + one-shot
backfill from property_details.listing_events for pre-trigger history.
Climate risk First Street
- Flood 1/10 Low FEMA zone X (unshaded) · 0% chance over 30 yrs
- Wildfire 3/10 Moderate
- Heat 6/10 Major 7 d/yr ≥104°F today · 17 d/yr by 30 yrs out
- Wind 4/10 Moderate 11% chance of damaging wind over 30 yrs
- Air quality 2/10 Low 2 unhealthy d/yr today · 2 by 30 yrs out
Nearby sold comps map
Loading sold comps map…
Walkable amenities ~0.75 mi
Loading nearby amenities…
Taxation est. · year 1
- Rental income
- $18,791
- − Mortgage interest
- −$7,002
- − Property taxes
- −$1,875
- − Insurance
- −$625
- − Repairs & maintenance
- −$1,503
- − Management
- −$1,503
- − Depreciation
- −$3,636
- Taxable income
- $2,646
- Est. tax owed @ 24.0%
- −$635
- After-tax cash flow
- $3,843/yr
For passive investors: Depreciation is non-cash, so a rental often shows a tax loss while cash-flowing — sheltering income. Rental losses are passive: they offset passive income freely, and up to $25,000/yr can offset ordinary (W-2) income if you actively participate and your MAGI is under $100k (phasing out to $0 by $150k); unused losses carry forward. On sale, claimed depreciation is recaptured at up to 25%, and gains may owe capital-gains tax (a 1031 exchange can defer both). Figures are a year-1 estimate at your 24.0% rate — not tax advice; consult a CPA.
Schools (NCES district)
- District
- Rowan-Salisbury Schools
- NCES district ID
- 3704050
- Math proficiency
- 26% ▲ 2.00%
- Reading proficiency
- 35% ▲ 1.00%
- Median HH income
- $43,953
- Composite
- 26.01/100
- National rank
- #7317
- State rank
- #142 of 178 in NC
Livability — Spencer
- Score
- 61/100
- State rank
- #482
- US rank
- #17657
Category grades
Schools grade is shown separately in the Schools card above.
Census & demographics
- Census place
- Spencer, NC
- City population
- 3,181
- Population (ZIP)
- 3,181
Population outlook (Rowan County) Hauer SSP2
- Today (2025)
- 140,430 people
- By 2030
- 140,193 · -0.2%
- By 2040
- 137,617 · -2.0%
- By 2050
- 131,826 · -6.1%
- By 2075
- 115,123 · -18.0%
- By 2100
- 92,774 · -33.9%
Race, ethnicity, and origin ACS 2023
- Neighborhood character
- Majority White (62%)
- Race & ethnicity
- White 62% Black 33% Two or more races 5% Hispanic / Latino 5%
- Common ancestry
- Serbian 9% Slovak 3% Italian 1%
- Foreign-born
- 2% · Canada
- Languages at home
- 98% English-only · Spanish 1%
Political lean MEDSL · Rowan
- 2024 margin
- Solid R (+35.9) · D 31.6% · R 67.5%
- 2008→2024 swing
- -13.1pp toward R · 2008: -22.8pp · 2024: -35.9pp
- All cycles
- 2024: R+35.9 2020: R+35.7 2016: R+36.8 2012: R+26.0 2008: R+22.8
Not yet ingested
- Civics
- —
Market trends
- HPI YoY
- ▲ 12.93%
- Current HPI
- 428.3307
- Rent YoY
- —
- Metro
- —
- State GDP YoY
- ▲ 3.28%
- F500 in state
- 26
Industry mix (Fortune 500 HQ in NC)
| Industry | F500 HQs | Revenue |
|---|---|---|
| Financial Services | 2 | $213B |
|
||
| Retail | 2 | $95B |
|
||
| Industrial Conglomerate | 1 | $38B |
|
||
| Metals / Steel | 1 | $35B |
|
||
| Utilities | 1 | $30B |
|
||
| Industrial Machinery | 1 | $19B |
|
||
Price history
-32.5% since first listed6 events — show timeline
- 2026-05-04 Price Changed $135,000 CANOPYMLS as Distributed by MLS Grid
- 2026-02-04 Price Changed $150,000 CANOPYMLS as Distributed by MLS Grid
- 2026-01-07 Price Changed $168,000 CANOPYMLS as Distributed by MLS Grid
- 2025-11-22 Price Changed $175,000 CANOPYMLS as Distributed by MLS Grid
- 2025-10-29 Price Changed $180,000 CANOPYMLS as Distributed by MLS Grid
- 2025-10-15 Listed $200,000 CANOPYMLS as Distributed by MLS Grid
Cash-flow waterfall
monthlySold comps — $/sqft
last 12 mo · ≤1 miLoading sold comps…