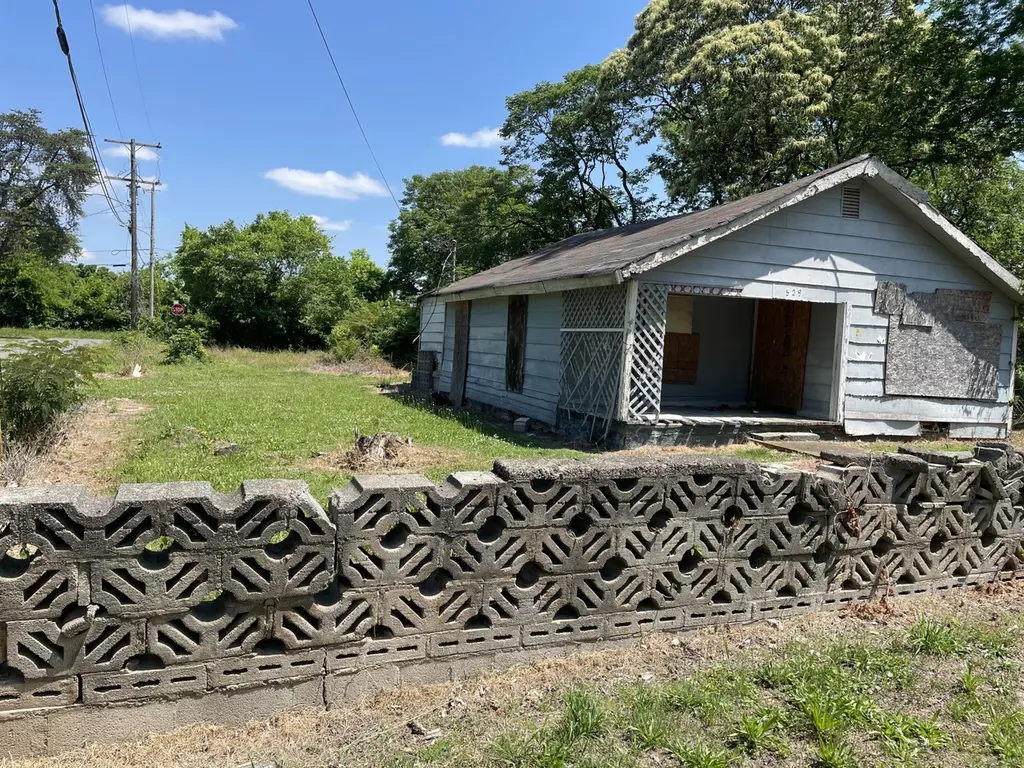
529 W Gordon Ave · Rossville, GA
Flood risk 9/10 · Severe
- FEMA flood zone
- X (shaded)
- Chance of flooding over 30 yrs
- 0.99%
- Est. flood insurance / yr
- $507 – $1,088
Fire risk 4/10 · Minor
- Est. fire insurance / yr
- $963 – $1,789
Heat risk 6/10 · Moderate
- Hot days now (above 104°F)
- 7 days/yr
- Hot days in 30 yrs
- 20 days/yr
Wind risk 4/10 · Minor
- Chance of severe wind over 30 yrs
- 11.0%
Air-quality risk 3/10 · Minor
- Unhealthy air days now
- 2 days/yr
- Unhealthy air days in 30 yrs
- 2 days/yr
Risk factors via First Street. Map © Google.
Why this score? — see what drove the B- grade
The composite is a weighted blend of 9 inputs, each scored 0–100. Each bar is that input's sub-score; the figure is the points it added to the 100-point composite (weight × sub-score).
- Cash flow +30.0/30.0
- 1% rule +10.0/10.0
- DSCR +10.0/10.0
- ARV discount +7.5/15.0
- Rent growth +4.4/5.0
- Livability +2.8/5.0
- Condition / age +2.5/5.0
- Schools +2.3/10.0
- Appreciation +0.0/10.0
$40,000
🖨 Deal sheet (PDF) 📄 Offer letter ✓ Due diligence
Listing remarks
Investment opportunity awaits with this distressed property waiting for a second lease on life. Located in the heart of Rossville, close to all conveniences and easy access to downtown Chattanooga. Utilities are Tennessee American Water, Enco for City Sewer, and EPB for Electricity. Cash only. All information to be verified.
Key facts
- Distressed property
- 5,096 sq ft lot
- Built 1925
Tags
Property features AI
Finance
- HOA & community: No community features listed
Exterior
- Parking: Off-street parking
- Utilities: Public water; Public sewer; Electricity available; Cable available; Phone available; Water available; Sewer available
- Home design: Single-family residence; Residential property; Property described as a fixer
- Construction: Wood siding exterior; Block foundation; Built area above grade: 629
- Exterior features: Storage structure on property; Level lot; Shingle roof
Interior
- Bathrooms: One full bathroom
- Heating & cooling: No heating; No cooling
- Interior features: No built-in appliances listed; No basement
Neighborhood map
What this means for you Summary
Snapshot
- This is a 1-bed/1.0-bath single-family listed at $40k.
Deal economics
- At list price, monthly cash flow is $456 ($5k/yr) — positive.
- The deal already cash-flows at list — no discount required.
- Meets the 1% rule at list price ($1k rent vs $40k).
- Recommended offer: $39k (3.0% below list) — sets the bar for market timing.
- Cap rate 22.0% vs local median 5.4% in Rossville — top-decile yield for the area; either an underpriced asset or a hidden risk that comps aren't pricing in. Stress-test before assuming the spread holds.
Location & tenants
- Location reads 56/100 on livability (#484 in GA) — a working-class tenant base; expect higher turnover. Strengths: cost of living A+, housing A-, crime B+; Watch: amenities F, commute F, employment D-.
- Walker County (rural): math 25% / reading 29% proficiency, ranked #114 of 174 in GA (top 66%) — low school quality limits family demand, transient renter base, plan for 1-2y turnover; 61% free/reduced lunch — lower-income household profile, screen leases tightly.
- Zoned schools: Rossville Elementary School (math 22% / reading 17%, grade F, #878 of 1,228 statewide, top 75%, 416 students, 91% FRL); Rossville Middle School (math 13% / reading 25%, grade F, #368 of 470 statewide, top 79%, 444 students, 81% FRL); Ridgeland High School (math 23% / reading 19%, grade F, #225 of 424 statewide, top 54%, 1,244 students, 70% FRL) — zoned schools average 81% FRL vs 61% district-wide (19 pts higher); higher-poverty schools than district average — tighter screening recommended.
- Market conditions: Rents rising fast (+7.4%/yr); 430 active listings in the ZIP; 1 comparable units currently listed for rent nearby; 347 units permitted in Walker County in 2024 (24 in 5+ unit buildings).
Forward outlook
- Local home prices are declining (-3.0%/yr); year-one equity from $277 of loan paydown is wiped out by about $1k of value loss. Plan a longer hold.
- Walker County population projected at -16% by 2050 — secular population decline; favor cash flow + early exit over multi-decade hold.
- At projected returns (-3.0% appreciation + 7.4% rent growth), your $11k cash investment doubles in ~3 years — after that, you're playing with house money.
Negotiation context
- It's been on market 33 days — a 3% lower offer ($39k) is reasonable based on typical stale-listing flexibility.
- 2 sale attempts with the ask held roughly flat each time — persistent listings suggest the price (not the market) is what's stuck; bring a comps-based counter.
Risks & watch-outs
- Watch-outs: flood insurance adds $66/mo; built in 1925 — expect roof / HVAC / electrical / plumbing capex.
- Climate carrying-cost: severe flood risk; extreme-heat days projected 7→20/yr by 2055 (HVAC capex compounding) — expect insurance premiums to compound above CPI over the hold.
Questions for the listing agent
- It's been on market 33 days. Have you received any prior offers? Is the seller open to a 3% concession, seller financing, or rate buy-down credit?
- Built in 1925 — when were the roof, HVAC, electrical panel, plumbing, and water heater last replaced?
- What's the actual annual flood-insurance premium (NFIP or private), and is the property in a SFHA with mandatory coverage?
- Is there a deadline driving the sale (1031 exchange, divorce, estate, relocation)? That informs how much negotiation room exists.
- Schools are F-rated, which usually means shorter tenancies and higher turnover. Who's the typical renter profile here, and what's been the actual vacancy rate?
- What's the average days-on-market for RENTAL listings here right now (not sales)? A rising rental-DOM trend means longer vacancies and softer asking-rent achievability than the comps imply.
- What's the recent tenant-quality profile in this submarket — average credit score on applications, eviction rate, late-payment / NSF rate, and stable-employment percentage? A property-management company in the area should have these aggregated.
- How much new for-sale + rental construction is in the pipeline within 1–3 miles? Heavy new supply typically softens prices + rents 12–24 months out; constrained supply supports both.
Investment metrics
- 1% rule
- 2.53% ✓
- Cap rate
- 21.97%
- Cash-on-cash
- 55.98%
- DSCR
- 3.49
- GRM
- 3.3
CMA / ARV
No comps found within radius.
Projected returns pro-forma
-3.0% appreciation · 7.44% rent growth · sell at horizon
- IRR
- 51.9%
- Equity multiple
- 3.44×
- Total profit
- $27,338
- Equity at exit
- $5,964
- IRR
- 59.1%
- Equity multiple
- 8.38×
- Total profit
- $82,661
- Equity at exit
- $3,458
Cash invested: $11,200 (down + closing). Projections, not guarantees.
Landlord ↔ Tenant lean methodology
- Overall (STATE)
- 90 Strongly Landlord-Friendly
- State Georgia
- 90 Strongly Landlord-Friendly · R+3
- County
- — inherits STATE
- City
- — inherits STATE
ZIP-level market 30741
- Home prices YoY
- -30.7%
- Rents YoY
- 7.4%
- Active inventory
- 430
- Price-to-rent
- 3.3×
Monthly cashflow live
- Estimated rent
- $1,011 medium interval (Pro) →
- Mortgage (P&I)
- −$210
- Tax est. 1.5%
- −$50 /mo · $600/yr
- Insurance
- −$17
- Flood insurance flood zone
- −$66 /mo · $798/yr
- HOA
- −$0
- Vacancy / Maint / Mgmt
- −$212
- Net cashflow
- $456
Break-even live
Sensitivity live
| Price | -10% $484 | -5% $470 | +0% $456 | +5% $442 | +10% $428 |
|---|---|---|---|---|---|
| Rent | -10% $376 | -5% $416 | +0% $456 | +5% $496 | +10% $536 |
| Rate | -1.0pp $476 | -0.5pp $466 | base $456 | +0.5pp $446 | +1.0pp $435 |
UW: 25.0% down · 7.5% · 30yr · 1.5% tax · 5.0% vac · 8.0% maint · 8.0% mgmt
Financing live
Cash to close
- Down payment
- $10,000
- Closing costs
- $1,200
- Reserves months
- —
- Total cash needed
- —
Loan-product check · same deal, 3 products live
Conventional
25% down · 7.5% · 30yr
- Down + closing
- —
- Monthly P&I
- —
- Monthly cashflow
- —
- DSCR
- —
- Eligible?
- —
Personal DTI + credit; lowest rate.
DSCR
20% down · 8.5% · 30yr
- Down + closing
- —
- Monthly P&I
- —
- Monthly cashflow
- —
- DSCR
- —
- Eligible?
- —
No personal income docs; deal must DSCR.
Hard money
10% down · 12.0% · 12mo
- Down + closing
- —
- Monthly P&I
- —
- Monthly cashflow
- —
- DSCR
- —
- Eligible?
- —
Short-term bridge; refi at stabilization.
Rent comps 1 comps
| Address | Beds | Baths | Sqft | Rent | $/sqft | DOM | Units | Dist |
|---|---|---|---|---|---|---|---|---|
| 2904 E 37th St Unit 1 Chattanooga, TN | 1.0 | 1.0 | 502 | $850 | $1.69 | 15d | 1 | 1.30mi |
Listing history 20 events
-
2026-06-21days on market $40,000 Active 33 DOM
-
2026-06-18days on market $40,000 Active 30 DOM
-
2026-06-17days on market $40,000 Active 29 DOM
-
2026-06-16days on market $40,000 Active 28 DOM
-
2026-06-15days on market $40,000 Active 27 DOM
-
2026-06-14days on market $40,000 Active 25 DOM
-
2026-06-13days on market $40,000 Active 24 DOM
-
2026-06-10days on market $40,000 Active 22 DOM
-
2026-06-09days on market $40,000 Active 21 DOM
-
2026-06-08days on market $40,000 Active 20 DOM
-
2026-06-07days on market $40,000 Active 19 DOM
-
2026-06-05days on market $40,000 Active 16 DOM
-
2026-06-03days on market $40,000 Active 15 DOM
-
2026-06-02days on market $40,000 Active 14 DOM
-
2026-06-01days on market $40,000 Active 13 DOM
-
2026-05-31days on market $40,000 Active 12 DOM
-
2026-05-30days on market $40,000 Active 11 DOM
-
2026-05-19$40,000 Active
-
2026-05-19$40,000 Active
-
2021-03-17soldstatus $35,000
ⓘ Source: listings_history table (triggers on properties + properties_extension) + one-shot
backfill from property_details.listing_events for pre-trigger history.
Climate risk First Street
- Flood 9/10 Extreme FEMA zone X (shaded) · 99% chance over 30 yrs
- Wildfire 4/10 Moderate
- Heat 6/10 Major 7 d/yr ≥104°F today · 20 d/yr by 30 yrs out
- Wind 4/10 Moderate 11% chance of damaging wind over 30 yrs
- Air quality 3/10 Moderate 2 unhealthy d/yr today · 2 by 30 yrs out
Nearby sold comps map
Loading sold comps map…
Walkable amenities ~0.75 mi
Loading nearby amenities…
Taxation est. · year 1
- Rental income
- $12,135
- − Mortgage interest
- −$2,241
- − Property taxes
- −$600
- − Insurance
- −$998
- − Repairs & maintenance
- −$971
- − Management
- −$971
- − Depreciation
- −$1,164
- Taxable income
- $5,192
- Est. tax owed @ 24.0%
- −$1,246
- After-tax cash flow
- $4,226/yr
For passive investors: Depreciation is non-cash, so a rental often shows a tax loss while cash-flowing — sheltering income. Rental losses are passive: they offset passive income freely, and up to $25,000/yr can offset ordinary (W-2) income if you actively participate and your MAGI is under $100k (phasing out to $0 by $150k); unused losses carry forward. On sale, claimed depreciation is recaptured at up to 25%, and gains may owe capital-gains tax (a 1031 exchange can defer both). Figures are a year-1 estimate at your 24.0% rate — not tax advice; consult a CPA.
Schools (NCES district)
- District
- Walker County
- NCES district ID
- 1305370
- Math proficiency
- 25% ▼ -10.00%
- Reading proficiency
- 29% ▼ -10.00%
- Median HH income
- $39,889
- Composite
- 22.74/100
- National rank
- #8035
- State rank
- #114 of 174 in GA
Livability — Rossville
- Score
- 56/100
- State rank
- #484
- US rank
- #22540
Category grades
Schools grade is shown separately in the Schools card above.
Census & demographics
- Census place
- Rossville, GA
- County
- Walker County · 48,831 people
- City population
- 30,041
- Metro
- Chattanooga, TN-GA
- Population (ZIP)
- 30,041
- Household income
- $58,834
- Rent vs Own
- Severe rent burden
- 834.0
Population outlook (Walker County) Hauer SSP2
- Today (2025)
- 66,050 people
- By 2030
- 64,305 · -2.6%
- By 2040
- 60,127 · -9.0%
- By 2050
- 55,551 · -15.9%
- By 2075
- 44,886 · -32.0%
- By 2100
- 34,015 · -48.5%
Race, ethnicity, and origin ACS 2023
- Neighborhood character
- Predominantly White (86%)
- Race & ethnicity
- White 86% Black 5% Two or more races 5% Hispanic / Latino 5%
- Common ancestry
- Slovak 3% Iranian 2% Italian 1%
- Foreign-born
- 2% · Canada
- Languages at home
- 96% English-only · Spanish 3%
Political lean MEDSL · Walker
- 2024 margin
- Solid R (+59.3) · D 20.1% · R 79.4%
- 2008→2024 swing
- -12.5pp toward R · 2008: -46.8pp · 2024: -59.3pp
- All cycles
- 2024: R+59.3 2020: R+59.3 2016: R+61.5 2012: R+50.2 2008: R+46.8
Not yet ingested
- Civics
- —
Market trends
- HPI YoY
- ▼ -118.05%
- Current HPI
- 267.0047
- Rent YoY
- ▲ 7.44%
- Metro
- Chattanooga, TN-GA
- State GDP YoY
- ▲ 2.66%
- F500 in state
- 28
Industry mix (Fortune 500 HQ in GA)
| Industry | F500 HQs | Revenue |
|---|---|---|
| Paper / Packaging | 2 | $29B |
|
||
| Retail | 1 | $160B |
|
||
| Transportation / Logistics | 1 | $91B |
|
||
| Airlines | 1 | $62B |
|
||
| Consumer Goods | 1 | $47B |
|
||
| Utilities | 1 | $25B |
|
||
Price history
+14.3% since first listed3 events — show timeline
- 2026-05-19 Listed $40,000 CCARMLS
- 2026-05-19 Listed $40,000 GCAR
- 2021-03-17 Sold (Public Records) $35,000 Public Records
Property tax history
-20.6%/yrLatest (2024): $41 · -1.6% YoY. Source: county tax records.
Cash-flow waterfall
monthlySold comps — $/sqft
last 12 mo · ≤1 miLoading sold comps…