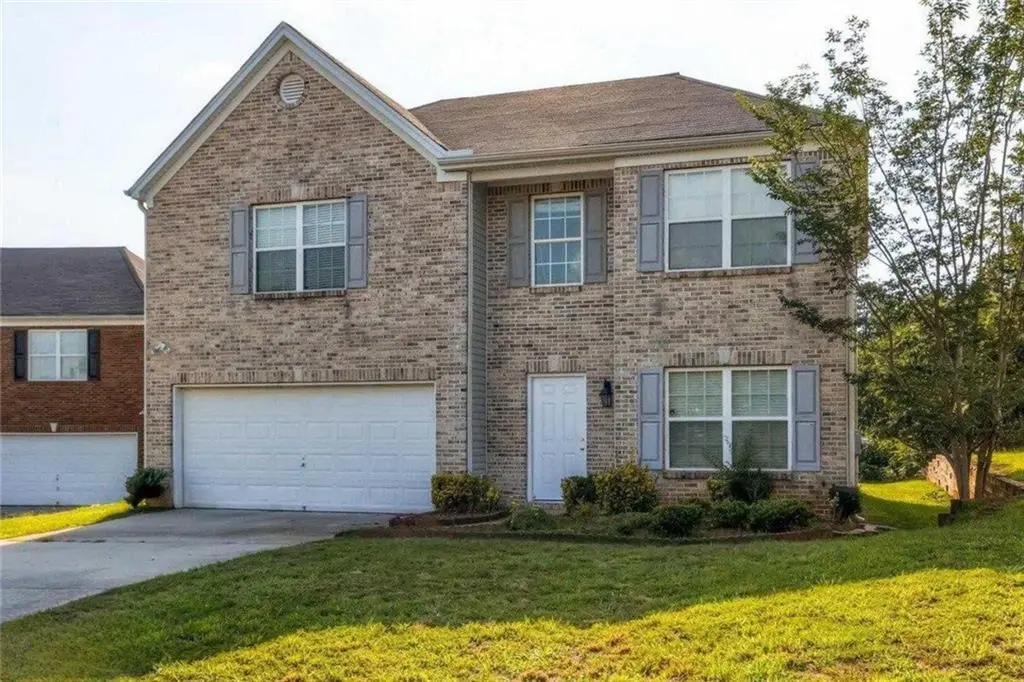
5493 Wexford Pass · South Fulton, GA
Flood risk 1/10 · Minimal
- FEMA flood zone
- X (unshaded)
- Chance of flooding over 30 yrs
- 0.0%
- Est. flood insurance / yr
- $507 – $1,088
Fire risk 3/10 · Minor
- Est. fire insurance / yr
- $963 – $1,789
Heat risk 6/10 · Moderate
- Hot days now (above 104°F)
- 7 days/yr
- Hot days in 30 yrs
- 19 days/yr
Wind risk 6/10 · Moderate
- Chance of severe wind over 30 yrs
- 27.0%
Air-quality risk 3/10 · Minor
- Unhealthy air days now
- 3 days/yr
- Unhealthy air days in 30 yrs
- 4 days/yr
Risk factors via First Street. Map © Google.
Why this score? — see what drove the C+ grade
The composite is a weighted blend of 9 inputs, each scored 0–100. Each bar is that input's sub-score; the figure is the points it added to the 100-point composite (weight × sub-score).
- Cash flow +19.3/30.0
- ARV discount +11.5/15.0
- Appreciation +10.0/10.0
- DSCR +6.1/10.0
- Schools +4.5/10.0
- 1% rule +4.0/10.0
- Rent growth +2.7/5.0
- Livability +2.5/5.0
- Condition / age +2.5/5.0
$270,000
🖨 Deal sheet (PDF) 📄 Offer letter ✓ Due diligence
Listing remarks MLS
Great home in College Park featuring 4 bedrooms and 2.5 bathrooms, offering a spacious and functional layout. The home includes a large family room, a well-sized kitchen with ample cabinet and counter space, and a generously sized primary bedroom. Conveniently located near Hartsfield-Jackson Atlanta International Airport, MARTA, and Downtown Atlanta, providing easy access to shopping, dining, and major highways. Ideal for buyers seeking both comfort and convenience.
Key facts
- 0.62 acre lot
- 2 garage spots
- Built 2005
Property features AI
Exterior
- Parking: Attached garage with 2 spaces and garage door opener; Kitchen-level entry
- Utilities: Public water; Public sewer; Sewer available
- Home design: Two-story home; Fee simple ownership; Slab foundation; Composition roof
- Construction: Aluminum siding; Vinyl siding; Composition roof; Slab foundation
- Exterior features: Aluminum and vinyl siding; Resale condition
Interior
- Kitchen: Dishwasher; Garbage disposal; Gas range; Pantry
- Bedrooms: Four bedrooms on the upper level
- Flooring: Carpet
- Bathrooms: Two full bathrooms; One half bathroom (main level)
- Heating & cooling: Central heating (natural gas); Central electric air conditioning
- Interior features: Double vanity in baths; Walk-in closet(s); One fireplace located in the family room; No units above (single stacked/no common walls above)
- Laundry & utility: Separate laundry room
Neighborhood map
What this means for you Summary
Snapshot
- This is a 4-bed/2.5-bath single-family listed at $270k.
Deal economics
- At list price, monthly cash flow is $297 ($4k/yr) — positive.
- The deal already cash-flows at list — no discount required.
- To meet the 1% rule (rent ≥ 1% of price), the offer needs to be $243k (10.0% below list).
- Recommended offer: $243k (10.0% below list) — sets the bar for 1% rule.
Location & tenants
- Location reads: area grade C — affects rentability + tenant quality, not the cash-flow math above.
- Fulton County (suburban): math 49% / reading 53% proficiency, ranked #12 of 174 in GA (top 7%) — acceptable for families but not a draw, mixed tenant base, ~2y average lease.
- Zoned schools: Liberty Point Elementary School (math 37% / reading 31%, grade F, #554 of 1,228 statewide, top 46%, 694 students, 100% FRL); Camp Creek Middle School (math 17% / reading 32%, grade F, #301 of 470 statewide, top 66%, 644 students, 100% FRL); Creekside High School (math 30% / reading 24%, grade F, #160 of 424 statewide, top 38%, 1,768 students, 100% FRL) — zoned schools average 100% FRL vs 41% district-wide (59 pts higher); higher-poverty schools than district average — tighter screening recommended.
- Zoned-school proficiency averages 29% at this address vs 51% district-wide (-22 pts) — the specific schools serving this property underperform the Fulton County average; the district grade overstates school quality for this exact location.
- Market conditions: Rents flat; 655 active listings in the ZIP; 16 comparable units currently listed for rent nearby; rentals at typical pace (median 26d on market — plan ~3-4 weeks tenant-placement turnaround); 11,565 units permitted in Fulton County in 2024 (8,159 in 5+ unit buildings).
Forward outlook
- In year one you build about $29k of equity ($2k loan paydown + $27k appreciation (10.0% local appreciation)).
- Fulton County population projected at +38% by 2050 — long-run rental-demand tailwind backs the buy-and-hold thesis.
- At projected returns (10.0% appreciation + 0.9% rent growth), your $76k cash investment doubles in ~3 years — after that, you're playing with house money.
- By year 2, paydown + projected appreciation supports a ~$46k cash-out refi (75% LTV) — recoverable capital for the next deal without selling this one.
Negotiation context
- It's been on market 16 days — a 2% lower offer ($266k) is reasonable based on typical stale-listing flexibility.
- 4 sale attempts since 10y ago with the ask held roughly flat each time — persistent listings suggest the price (not the market) is what's stuck; bring a comps-based counter.
- Current owner paid $142k; list at $270k implies a 90% gain — meaningful room to come down on a strong offer.
Risks & watch-outs
- Climate carrying-cost: major wind risk, 27% chance of damaging wind over 30y; extreme-heat days projected 7→19/yr by 2055 (HVAC capex compounding) — expect insurance premiums to compound above CPI over the hold.
Questions for the listing agent
- Is there a deadline driving the sale (1031 exchange, divorce, estate, relocation)? That informs how much negotiation room exists.
- What's the average days-on-market for RENTAL listings here right now (not sales)? A rising rental-DOM trend means longer vacancies and softer asking-rent achievability than the comps imply.
- What's the recent tenant-quality profile in this submarket — average credit score on applications, eviction rate, late-payment / NSF rate, and stable-employment percentage? A property-management company in the area should have these aggregated.
- How much new for-sale + rental construction is in the pipeline within 1–3 miles? Heavy new supply typically softens prices + rents 12–24 months out; constrained supply supports both.
Investment metrics
- 1% rule
- 0.90% ✗
- Cap rate
- 7.61%
- Cash-on-cash
- 4.71%
- DSCR
- 1.21
- GRM
- 9.3
CMA / ARV
- ARV (on-the-fly)
- $296,496
- Comps found
- 8
Show comp detail 8 sales within ~0.75 mi
| Address | Dist | Beds/Ba | Sqft | Sold | Price | $/sf | Match |
|---|---|---|---|---|---|---|---|
| 4898 Wexford Trl | 0.26mi | 5/2.5 (+1) | 2,604 (+2%) | 5mo | $304,000 | $117 | 76 |
| 4861 Wexford Trl | 0.32mi | 4/2.5 | 2,488 (-3%) | 6mo | $280,000 | $113 | 76 |
| 8273 Eastshore Dr #2 | 0.46mi | 4/2.5 | 2,593 (+1%) | 8mo | $300,000 | $116 | 70 |
| 8273 Eastshore Dr | 0.46mi | 4/2.5 | 2,593 (+1%) | 8mo | $300,000 | $116 | 70 |
| 8800 Lakecrest Way | 0.48mi | 4/2.5 | 2,566 (+0%) | 18mo | $280,000 | $109 | 62 |
| 5250 Forest Down Ln | 0.36mi | 3/2.0 (-1) | 2,832 (+11%) | 2mo | $250,000 | $88 | 57 |
| 8967 Crestview Cir | 0.64mi | 4/2.5 | 2,816 (+10%) | 1mo | $322,000 | $114 | 52 |
| 8834 Lakecrest Way | 0.67mi | 3/2.5 (-1) | 2,248 (-12%) | 21mo | $305,000 | $136 | 27 |
Match score weights: distance 35% · size 25% · config 20% · recency 20%. Top-matched comps best support the ARV.
Projected returns pro-forma
10.0% appreciation · 0.95% rent growth · sell at horizon
- IRR
- 27.0%
- Equity multiple
- 3.13×
- Total profit
- $160,941
- Equity at exit
- $243,237
- IRR
- 23.1%
- Equity multiple
- 6.95×
- Total profit
- $449,684
- Equity at exit
- $524,551
Cash invested: $75,600 (down + closing). Projections, not guarantees.
Landlord ↔ Tenant lean methodology
- Overall (STATE)
- 90 Strongly Landlord-Friendly
- State Georgia
- 90 Strongly Landlord-Friendly · R+3
- County
- — inherits STATE
- City
- — inherits STATE
ZIP-level market 30349
- Home prices YoY
- 4.6%
- Rents YoY
- 0.9%
- Active inventory
- 655
- Price-to-rent
- 9.3×
Monthly cashflow live
- Estimated rent
- $2,431 high interval (Pro) →
- Mortgage (P&I)
- −$1,416
- Tax from tax record
- −$95 /mo · $1,142/yr
- Insurance
- −$112
- HOA
- −$0
- Vacancy / Maint / Mgmt
- −$511
- Net cashflow
- $297
Break-even live
Sensitivity live
| Price | -10% $450 | -5% $373 | +0% $297 | +5% $221 | +10% $144 |
|---|---|---|---|---|---|
| Rent | -10% $105 | -5% $201 | +0% $297 | +5% $393 | +10% $489 |
| Rate | -1.0pp $433 | -0.5pp $366 | base $297 | +0.5pp $227 | +1.0pp $156 |
UW: 25.0% down · 7.5% · 30yr · 1.5% tax · 5.0% vac · 8.0% maint · 8.0% mgmt
Financing live
Cash to close
- Down payment
- $67,500
- Closing costs
- $8,100
- Reserves months
- —
- Total cash needed
- —
Loan-product check · same deal, 3 products live
Conventional
25% down · 7.5% · 30yr
- Down + closing
- —
- Monthly P&I
- —
- Monthly cashflow
- —
- DSCR
- —
- Eligible?
- —
Personal DTI + credit; lowest rate.
DSCR
20% down · 8.5% · 30yr
- Down + closing
- —
- Monthly P&I
- —
- Monthly cashflow
- —
- DSCR
- —
- Eligible?
- —
No personal income docs; deal must DSCR.
Hard money
10% down · 12.0% · 12mo
- Down + closing
- —
- Monthly P&I
- —
- Monthly cashflow
- —
- DSCR
- —
- Eligible?
- —
Short-term bridge; refi at stabilization.
Rent comps 16 comps
| Address | Beds | Baths | Sqft | Rent | $/sqft | DOM | Units | Dist |
|---|---|---|---|---|---|---|---|---|
| 5573 Rock Lake Dr Atlanta, GA | 4.0 | 2.5 | 2690 | $2,350 | $0.87 | 26d | 1 | 0.07mi |
| 5131 Forest Downs Ln Atlanta, GA | 4.0 | 2.0 | 2112 | $1,580 | $0.75 | 5d | 1 | 0.47mi |
| 5245 Stonewall Tell Rd Atlanta, GA | 5.0 | 3.0 | 3200 | $3,450 | $1.08 | 14d | 1 | 0.49mi |
| 5245 Stonewall Tell Rd Atlanta, GA | 5.0 | 3.0 | 3200 | $3,450 | $1.08 | 18d | 1 | 0.49mi |
| 3206 Diamond Blf Union City, GA | 5.0 | 2.0 | 1900 | $2,275 | $1.20 | 26d | 1 | 0.98mi |
| 520 Dasheill Ln Atlanta, GA | 4.0 | 2.5 | 2045 | $2,410 | $1.18 | 45d | 1 | 1.00mi |
| 5163 Rapahoe Trl Atlanta, GA | 4.0 | 2.5 | 2060 | $2,525 | $1.23 | 0d | 1 | 1.06mi |
| 3228 Diamond Blf Union City, GA | 4.0 | 2.5 | 1922 | $2,195 | $1.14 | 45d | 1 | 1.09mi |
| 3234 Diamond Blf Union City, GA | 4.0 | 2.5 | 1922 | $2,360 | $1.23 | 7d | 1 | 1.13mi |
| 5259 Cantbury Way Atlanta, GA | 4.0 | 2.5 | 2578 | $2,445 | $0.95 | 23d | 1 | 1.17mi |
| 4108 Robin Cir Atlanta, GA | 3.0 | 2.5 | 1786 | $2,400 | $1.34 | 45d | 1 | 1.34mi |
| 4666 Ravenwood Loop Union City, GA | 4.0 | 3.0 | 1916 | $2,175 | $1.14 | 26d | 1 | 1.35mi |
| 4223 Reeshemah St Atlanta, GA | 3.0 | 2.5 | 1843 | $1,995 | $1.08 | 7d | 1 | 1.38mi |
| 4095 Robin Cir Atlanta, GA | 3.0 | 2.5 | 2196 | $2,023 | $0.92 | 45d | 1 | 1.42mi |
| 4062 Robin Cir Atlanta, GA | 3.0 | 3.0 | 1874 | $1,910 | $1.02 | 26d | 1 | 1.44mi |
| 4064 Robin Cir Atlanta, GA | 3.0 | 2.5 | 1874 | $1,895 | $1.01 | 26d | 1 | 1.45mi |
Listing history 10 events
-
2026-06-21days on market $270,000 Active 16 DOM
-
2026-06-18days on market $270,000 Active 13 DOM
-
2026-06-17days on market $270,000 Active 12 DOM
-
2026-06-16days on market $270,000 Active 11 DOM
-
2026-06-15days on market $270,000 Active 10 DOM
-
2026-06-13days on market $270,000 Active 8 DOM
-
2026-06-09days on market $270,000 Active 4 DOM
-
2026-06-08days on market $270,000 Active 3 DOM
-
2026-06-07remarks 470-char remark
-
2026-06-07$270,000 Active 2 DOM
ⓘ Source: listings_history table (triggers on properties + properties_extension) + one-shot
backfill from property_details.listing_events for pre-trigger history.
Tax reassessment forecast GA · Resets to sale price
- Current annual tax
- $1,142 · $95/mo
- Projected year-2 tax
- $2,484 · $207/mo
- Expected delta
- +$1,342/yr (+$112/mo · 117.6%)
ⓘ Screening estimate from a state-policy table — verify with the county assessor before closing.
Climate risk First Street
- Flood 1/10 Low FEMA zone X (unshaded) · 0% chance over 30 yrs
- Wildfire 3/10 Moderate
- Heat 6/10 Major 7 d/yr ≥104°F today · 19 d/yr by 30 yrs out
- Wind 6/10 Major 27% chance of damaging wind over 30 yrs
- Air quality 3/10 Moderate 3 unhealthy d/yr today · 4 by 30 yrs out
Nearby sold comps map
Loading sold comps map…
Walkable amenities ~0.75 mi
Loading nearby amenities…
Taxation est. · year 1
- Rental income
- $29,173
- − Mortgage interest
- −$15,124
- − Property taxes
- −$1,142
- − Insurance
- −$1,350
- − Repairs & maintenance
- −$2,334
- − Management
- −$2,334
- − Depreciation
- −$7,855
- Taxable loss
- −$965
- Est. tax savings @ 24.0%
- +$232
- After-tax cash flow
- $3,796/yr
For passive investors: Depreciation is non-cash, so a rental often shows a tax loss while cash-flowing — sheltering income. Rental losses are passive: they offset passive income freely, and up to $25,000/yr can offset ordinary (W-2) income if you actively participate and your MAGI is under $100k (phasing out to $0 by $150k); unused losses carry forward. On sale, claimed depreciation is recaptured at up to 25%, and gains may owe capital-gains tax (a 1031 exchange can defer both). Figures are a year-1 estimate at your 24.0% rate — not tax advice; consult a CPA.
Schools (NCES district)
- District
- Fulton County
- NCES district ID
- 1302280
- Math proficiency
- 49% ▼ -2.00%
- Reading proficiency
- 53% ▬ 0.00%
- Median HH income
- $68,035
- Composite
- 45.33/100
- National rank
- #2640
- State rank
- #12 of 174 in GA
Livability — South Fulton
No livability data for this city. (Only ~50 U.S. cities are tracked.)
Census & demographics
- Census place
- South Fulton, GA
- County
- Fulton County · 1,094,430 people
- City population
- 127,674
- Metro
- Atlanta-Sandy Springs-Alpharetta, GA
- Population (ZIP)
- 79,872
- Household income
- $67,023
- Rent vs Own
- Severe rent burden
- 4258.0
Population outlook (Fulton County) Hauer SSP2
- Today (2025)
- 1,203,707 people
- By 2030
- 1,299,706 · +8.0%
- By 2040
- 1,488,256 · +23.6%
- By 2050
- 1,664,580 · +38.3%
- By 2075
- 2,036,072 · +69.2%
- By 2100
- 2,222,402 · +84.6%
Race, ethnicity, and origin ACS 2023
- Neighborhood character
- Predominantly Black (89%)
- Race & ethnicity
- Black 89% Hispanic / Latino 5% Two or more races 4% White 3%
- Foreign-born
- 9% · Canada
- Languages at home
- 88% English-only · Spanish 6% French/Haitian/Cajun 1%
Political lean MEDSL · Fulton
- 2024 margin
- Solid D (+44.9) · D 71.9% · R 27.0% · Other 1.1%
- 2008→2024 swing
- +9.8pp toward D · 2008: 35.0pp · 2024: 44.9pp
- All cycles
- 2024: D+44.9 2020: D+46.4 2016: D+42.1 2012: D+29.6 2008: D+35.0
Not yet ingested
- Civics
- —
Market trends
- HPI YoY
- ▲ 18.01%
- Current HPI
- 407.99
- Rent YoY
- ▲ 0.95%
- Metro
- Atlanta-Sandy Springs-Alpharetta, GA
- State GDP YoY
- ▲ 2.66%
- F500 in state
- 28
Industry mix (Fortune 500 HQ in GA)
| Industry | F500 HQs | Revenue |
|---|---|---|
| Paper / Packaging | 2 | $29B |
|
||
| Retail | 1 | $160B |
|
||
| Transportation / Logistics | 1 | $91B |
|
||
| Airlines | 1 | $62B |
|
||
| Consumer Goods | 1 | $47B |
|
||
| Utilities | 1 | $25B |
|
||
Price history
+92.9% since first listed9 events — show timeline
- 2026-06-05 Listed $270,000 FMLS
- 2026-04-16 Listed $270,000 GAMLS
- 2016-11-14 Sold (Public Records) $142,000 Public Records
- 2016-10-19 Sold (MLS) $142,000 FMLS
- 2016-10-14 Sold (MLS) $142,000 GAMLS
- 2016-09-07 Pending — GAMLS
- 2016-09-07 Contingent — FMLS
- 2016-08-30 Listed $140,000 FMLS
- 2016-08-30 Listed $140,000 GAMLS
Property tax history
-4.2%/yrLatest (2025): $1,142 · +4.6% YoY. Source: county tax records.
Cash-flow waterfall
monthlySold comps — $/sqft
last 12 mo · ≤1 miLoading sold comps…