 Triplex
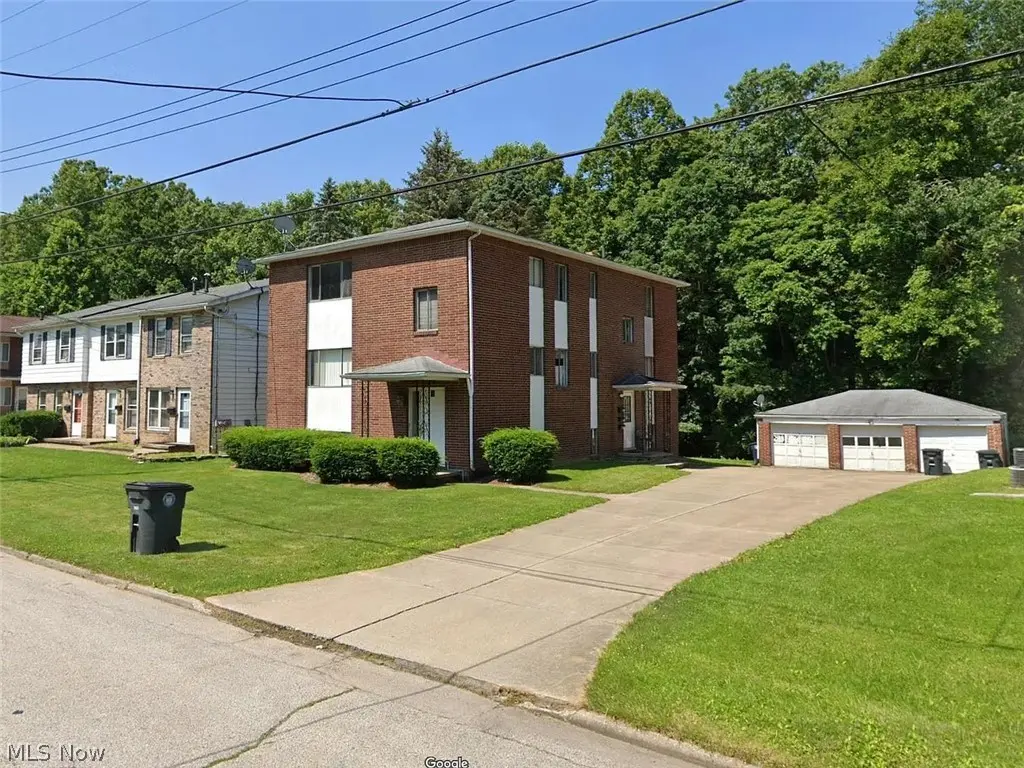
1804-1808 Cromwell Dr · Akron, OH
Flood risk 1/10 · Minimal
- FEMA flood zone
- X (unshaded)
- Chance of flooding over 30 yrs
- 0.0%
- Est. flood insurance / yr
- $473 – $860
Fire risk 1/10 · Minimal
- Est. fire insurance / yr
- $713 – $1,323
Heat risk 3/10 · Minor
- Hot days now (above 97°F)
- 7 days/yr
- Hot days in 30 yrs
- 17 days/yr
Wind risk 1/10 · Minimal
- Chance of severe wind over 30 yrs
- —
Air-quality risk 2/10 · Minimal
- Unhealthy air days now
- 1 days/yr
- Unhealthy air days in 30 yrs
- 2 days/yr
Risk factors via First Street. Map © Google.
Why this score? — see what drove the C- grade
The composite is a weighted blend of 9 inputs, each scored 0–100. Each bar is that input's sub-score; the figure is the points it added to the 100-point composite (weight × sub-score).
- Cash flow +25.9/30.0
- DSCR +8.7/10.0
- 1% rule +6.7/10.0
- Rent growth +4.5/5.0
- Livability +4.0/5.0
- Condition / age +2.5/5.0
- Schools +2.1/10.0
- ARV discount +0.0/15.0
- Appreciation +0.0/10.0
$295,000
🖨 Deal sheet (PDF) 📄 Offer letter ✓ Due diligence
Multi-family units
County records classify this as Multi-Family (2-4 Unit). Listing-text estimate: 3 units. confirmed
Listing remarks MLS
Here’s your chance to own a well maintained three unit brick apartment building in a prime Akron location. The property features two spacious 2 bed 1 bath units and one 1 bed 1 bath unit, each with its own dedicated garage bay and separate water, gas, and electric meters. One unit is currently vacant, offering immediate upside for an owner occupant or investor looking to place their own tenant at market rent. A lower level common area provides separate laundry hookups for each unit. Recent upgrades include new flooring in all units within the past two years. Mechanical systems are in good condition, helping keep maintenance low and operations reliable. Tenants pay all utilities except common electric, which the owner covers for exterior lighting and shared spaces. Located on a quiet dead end street with Sand Run Metro Park as your backyard, yet just minutes from Summit Mall, Stan Hywet, and quick access to I 77, this property offers a rare mix of convenience and peaceful surroundings. Public transit is also nearby.
Key facts
- Recent upgrades
- New flooring
- Dedicated garage bay
Tags
Neighborhood map
What this means for you Summary
Snapshot
- This is a 2×2bd/1ba + 1×1bd/1ba units multifamily listed at $295k.
Deal economics
- At list price, monthly cash flow is $723 ($9k/yr) — positive. Per door: $241/mo.
- The deal already cash-flows at list — no discount required.
- Meets the 1% rule at list price ($3k rent vs $295k).
- Recommended offer: $268k (9.0% below list) — sets the bar for market timing.
- Cap rate 9.2% vs local median 6.6% in Akron — top-decile yield for the area; either an underpriced asset or a hidden risk that comps aren't pricing in. Stress-test before assuming the spread holds.
Location & tenants
- Location reads 81/100 on livability (#104 in OH, #1,591 nationally) — a professional / high-income tenant draw. Strengths: amenities A+, commute A+, cost of living A+; Watch: crime F, employment F.
- Akron City (urban): math 22% / reading 30% proficiency, ranked #602 of 656 in OH (top 92%) — low school quality limits family demand, transient renter base, plan for 1-2y turnover; 66% free/reduced lunch — lower-income household profile, screen leases tightly.
- Zoned schools: Case Community Learning Center (math 27% / reading 37%, grade F, #1,135 of 1,584 statewide, top 73%, 379 students, 0% FRL); Litchfield Community Learning Center (math 18% / reading 26%, grade F, #602 of 654 statewide, top 93%, 561 students, 0% FRL); Firestone Community Learning Center (math 21% / reading 51%, grade F, #579 of 781 statewide, top 74%, 1,162 students, 0% FRL) — zoned schools average 0% FRL vs 66% district-wide (66 pts lower); this property's tenant base skews higher-income than the district average.
- Market conditions: Rents rising fast (+8.0%/yr); 128 active listings in the ZIP; 1 comparable units currently listed for rent nearby; solid renter incomes; 1,114 units permitted in Summit County in 2024 (397 in 5+ unit buildings).
- At $3,443/mo this rent would consume 55% of the median local household income ($76k/yr) (locally 1193% of renters already pay >50% of income on rent) — very limited rent-growth headroom before tenants either downsize or default.
Forward outlook
- Local home prices are declining (-3.0%/yr); year-one equity from $2k of loan paydown is wiped out by about $9k of value loss. Plan a longer hold.
- Summit County population projected to shrink 6% by 2050 — rents likely to lag national; underwrite the cash flow, not the appreciation.
- At projected returns (-3.0% appreciation + 8.0% rent growth), your $83k cash investment doubles in ~8 years — after that, you're playing with house money.
Negotiation context
- It's been on market 104 days — a 9% lower offer ($268k) is reasonable based on typical stale-listing flexibility.
- 11 sale attempts since 33y ago with the ask held roughly flat each time — persistent listings suggest the price (not the market) is what's stuck; bring a comps-based counter.
- Current owner paid $185k; list at $295k implies a 59% gain — meaningful room to come down on a strong offer.
Questions for the listing agent
- It's been on market 104 days. Have you received any prior offers? Is the seller open to a 9% concession, seller financing, or rate buy-down credit?
- Can we see the unit-by-unit rent roll, current vacancy, and any below-market leases? What's the average tenancy length?
- What capital expenditures (roof, boiler, parking lot, exteriors) have been made in the last 5 years, and what's planned in the next 2?
- Built in 1965 — when were the roof, HVAC, electrical panel, plumbing, and water heater last replaced?
- Why hasn't it sold? Are there any deal-killer items the seller is aware of (foundation, flood, title, zoning, code violations)?
- Is there a deadline driving the sale (1031 exchange, divorce, estate, relocation)? That informs how much negotiation room exists.
- Crime grade is F in this area — have there been break-ins, vandalism, or insurance claims at this property in the last 3 years? What carrier currently insures it and at what premium?
- What's the average days-on-market for RENTAL listings here right now (not sales)? A rising rental-DOM trend means longer vacancies and softer asking-rent achievability than the comps imply.
- What's the recent tenant-quality profile in this submarket — average credit score on applications, eviction rate, late-payment / NSF rate, and stable-employment percentage? A property-management company in the area should have these aggregated.
- How much new apartment / multifamily construction is in the pipeline within 1–3 miles? Heavy new supply (>2% of stock underway) typically softens rents 12–24 months out; light construction supports rent growth.
Investment metrics
- 1% rule
- 1.17% ✓
- Cap rate
- 9.23%
- Cash-on-cash
- 10.50%
- DSCR
- 1.47
- GRM
- 7.1
CMA / ARV
- ARV (median comp)
- $198,331
- List price
- $295,000
- Delta
- 48.74%
- Verdict
- OVERPRICED
- Comps
- 20 within 1.0 mi
Show comp detail 5 sales within ~0.75 mi
| Address | Dist | Beds/Ba | Sqft | Sold | Price | $/sf | Match |
|---|---|---|---|---|---|---|---|
| 1834-1836 Cromwell Dr | 0.05mi | 4/2.0 (-1) | 2,756 (+5%) | 9mo | $180,000 | $65 | 74 |
| 1633-1635 Liberty Dr | 0.64mi | 4/3.0 (-1) | 2,520 (-4%) | 8mo | $210,000 | $83 | 51 |
| 463-465 Treeside Dr | 0.32mi | 4/2.0 (-1) | 2,322 (-12%) | 16mo | $195,463 | $84 | 43 |
| 1697-1699 Liberty Dr | 0.63mi | 4/2.0 (-1) | 2,450 (-7%) | 9mo | $265,000 | $108 | 43 |
| 1623-1625 Liberty Dr | 0.64mi | 4/3.0 (-1) | 2,382 (-10%) | 8mo | $210,000 | $88 | 43 |
Match score weights: distance 35% · size 25% · config 20% · recency 20%. Top-matched comps best support the ARV.
Projected returns pro-forma
-3.0% appreciation · 7.98% rent growth · sell at horizon
- IRR
- 4.9%
- Equity multiple
- 1.20×
- Total profit
- $16,385
- Equity at exit
- $43,985
- IRR
- 18.4%
- Equity multiple
- 2.89×
- Total profit
- $156,095
- Equity at exit
- $25,506
Cash invested: $82,600 (down + closing). Projections, not guarantees.
Landlord ↔ Tenant lean methodology
- Overall (STATE)
- 73 Landlord-Friendly
- State Ohio
- 73 Landlord-Friendly · R+6
- County
- — inherits STATE
- City
- — inherits STATE
ZIP-level market 44313
- Rents YoY
- 8.0%
- Active inventory
- 128
- Price-to-rent
- 20.8×
Monthly cashflow live
- Estimated rent
- $3,443 high interval (Pro) →
- Mortgage (P&I)
- −$1,547
- Tax from tax record
- −$327 /mo · $3,926/yr
- Insurance
- −$123
- HOA
- −$0
- Vacancy / Maint / Mgmt
- −$723
- Net cashflow
- $723
Break-even live
Sensitivity live
| Price | -10% $890 | -5% $806 | +0% $723 | +5% $639 | +10% $556 |
|---|---|---|---|---|---|
| Rent | -10% $451 | -5% $587 | +0% $723 | +5% $859 | +10% $995 |
| Rate | -1.0pp $871 | -0.5pp $798 | base $723 | +0.5pp $646 | +1.0pp $569 |
3-unit breakdown (identical units grouped — click to expand)
| Units | Beds | Baths | Est. rent |
|---|---|---|---|
| 2× units | 2 | 1 | $2,364 |
| #1 | 2 | 1 | $1,182 |
| #2 | 2 | 1 | $1,182 |
| 1× unit | 1 | 1 | $1,079 |
| Total (3 units) | $3,443 | ||
UW: 25.0% down · 7.5% · 30yr · 1.5% tax · 5.0% vac · 8.0% maint · 8.0% mgmt
Financing live
Cash to close
- Down payment
- $73,750
- Closing costs
- $8,850
- Reserves months
- —
- Total cash needed
- —
Loan-product check · same deal, 3 products live
Conventional
25% down · 7.5% · 30yr
- Down + closing
- —
- Monthly P&I
- —
- Monthly cashflow
- —
- DSCR
- —
- Eligible?
- —
Personal DTI + credit; lowest rate.
DSCR
20% down · 8.5% · 30yr
- Down + closing
- —
- Monthly P&I
- —
- Monthly cashflow
- —
- DSCR
- —
- Eligible?
- —
No personal income docs; deal must DSCR.
Hard money
10% down · 12.0% · 12mo
- Down + closing
- —
- Monthly P&I
- —
- Monthly cashflow
- —
- DSCR
- —
- Eligible?
- —
Short-term bridge; refi at stabilization.
Rent comps 1 comps
| Address | Beds | Baths | Sqft | Rent | $/sqft | DOM | Units | Dist |
|---|---|---|---|---|---|---|---|---|
| 1183 Romayne Dr Akron, OH | 4.0 | 2.0 | 2024 | $2,400 | $1.19 | 25d | 1 | 1.12mi |
Listing history 42 events
-
2026-06-18days on market $295,000 Active 104 DOM
-
2026-06-17days on market $295,000 Active 103 DOM
-
2026-06-16days on market $295,000 Active 102 DOM
-
2026-06-15days on market $295,000 Active 101 DOM
-
2026-06-14days on market $295,000 Active 99 DOM
-
2026-06-13days on market $295,000 Active 98 DOM
-
2026-06-10days on market $295,000 Active 96 DOM
-
2026-06-09days on market $295,000 Active 95 DOM
-
2026-06-08days on market $295,000 Active 94 DOM
-
2026-06-07days on market $295,000 Active 93 DOM
-
2026-06-05days on market $295,000 Active 90 DOM
-
2026-06-03days on market $295,000 Active 89 DOM
-
2026-06-02days on market $295,000 Active 88 DOM
-
2026-06-01days on market $295,000 Active 87 DOM
-
2026-05-31days on market $295,000 Active 86 DOM
-
2026-05-31days on market $295,000 Active 85 DOM
-
2026-03-06$295,000 Active 1036-char remark
Show marketing remark (1036 chars)
Here’s your chance to own a well maintained three unit brick apartment building in a prime Akron location. The property features two spacious 2 bed 1 bath units and one 1 bed 1 bath unit, each with its own dedicated garage bay and separate water, gas, and electric meters. One unit is currently vacant, offering immediate upside for an owner occupant or investor looking to place their own tenant at market rent. A lower level common area provides separate laundry hookups for each unit. Recent upgrades include new flooring in all units within the past two years. Mechanical systems are in good condition, helping keep maintenance low and operations reliable. Tenants pay all utilities except common electric, which the owner covers for exterior lighting and shared spaces. Located on a quiet dead end street with Sand Run Metro Park as your backyard, yet just minutes from Summit Mall, Stan Hywet, and quick access to I 77, this property offers a rare mix of convenience and peaceful surroundings. Public transit is also nearby.
-
2025-05-05historical $700
-
2025-05-01$700
-
2025-04-01historical $700
-
2025-04-01$700
-
2022-03-10soldstatus $185,000
-
2018-08-14status Active
-
2018-08-14historical
-
2018-07-23historical Contingent
-
2018-06-21$124,900 Active
-
2015-09-03soldstatus $67,500
-
2007-11-15historical
-
2007-05-15$155,000
-
2005-12-02soldstatus $145,500
-
2005-12-02soldstatus $145,500
-
2005-08-31$152,900
-
2005-03-01soldstatus $120,000
-
2005-02-23historical
-
2004-11-22$124,900
-
1999-08-03soldstatus $127,000
-
1999-05-10$129,900
-
1995-12-01historical
-
1995-11-17soldstatus $92,000
-
1995-06-02$99,900
-
1994-12-27historical
-
1993-06-01$109,999
ⓘ Source: listings_history table (triggers on properties + properties_extension) + one-shot
backfill from property_details.listing_events for pre-trigger history.
Tax reassessment forecast OH · Partial reset (capped growth)
- Current annual tax
- $3,926 · $327/mo
- Projected year-2 tax
- $4,264 · $355/mo
- Expected delta
- +$338/yr (+$28/mo · 8.6%)
ⓘ Screening estimate from a state-policy table — verify with the county assessor before closing.
Climate risk First Street
- Flood 1/10 Low FEMA zone X (unshaded) · 0% chance over 30 yrs
- Wildfire 1/10 Low
- Heat 3/10 Moderate 7 d/yr ≥97°F today · 17 d/yr by 30 yrs out
- Wind 1/10 Low
- Air quality 2/10 Low 1 unhealthy d/yr today · 2 by 30 yrs out
Nearby sold comps map
Loading sold comps map…
Walkable amenities ~0.75 mi
Loading nearby amenities…
Taxation est. · year 1
- Rental income
- $41,316
- − Mortgage interest
- −$16,525
- − Property taxes
- −$3,926
- − Insurance
- −$1,475
- − Repairs & maintenance
- −$3,305
- − Management
- −$3,305
- − Depreciation
- −$8,582
- Taxable income
- $4,198
- Est. tax owed @ 24.0%
- −$1,008
- After-tax cash flow
- $7,667/yr
For passive investors: Depreciation is non-cash, so a rental often shows a tax loss while cash-flowing — sheltering income. Rental losses are passive: they offset passive income freely, and up to $25,000/yr can offset ordinary (W-2) income if you actively participate and your MAGI is under $100k (phasing out to $0 by $150k); unused losses carry forward. On sale, claimed depreciation is recaptured at up to 25%, and gains may owe capital-gains tax (a 1031 exchange can defer both). Figures are a year-1 estimate at your 24.0% rate — not tax advice; consult a CPA.
Schools (NCES district)
- District
- Akron City
- NCES district ID
- 3904348
- Math proficiency
- 22% ▼ -17.00%
- Reading proficiency
- 30% ▼ -12.00%
- Median HH income
- $33,811
- Composite
- 21.31/100
- National rank
- #8383
- State rank
- #602 of 656 in OH
Livability — Akron
- Score
- 81/100
- State rank
- #104
- US rank
- #1591
Category grades
Schools grade is shown separately in the Schools card above.
Census & demographics
- Census place
- Akron, OH
- County
- Summit County · 440,783 people
- City population
- 174,375
- Metro
- Akron, OH
- Population (ZIP)
- 26,631
- Household income
- $75,671
- Rent vs Own
- Severe rent burden
- 1193.0
Population outlook (Summit County) Hauer SSP2
- Today (2025)
- 546,583 people
- By 2030
- 544,028 · -0.5%
- By 2040
- 531,363 · -2.8%
- By 2050
- 514,923 · -5.8%
- By 2075
- 481,765 · -11.9%
- By 2100
- 432,265 · -20.9%
Race, ethnicity, and origin ACS 2023
- Neighborhood character
- Predominantly White (67%)
- Race & ethnicity
- White 67% Black 22% Two or more races 8% Hispanic / Latino 3% Asian 2%
- Common ancestry
- Romanian 3% Slovak 3% Lithuanian 2%
- Foreign-born
- 3% · Canada
- Languages at home
- 96% English-only · Spanish 1% Other Indo-European 1%
Political lean MEDSL · Summit
- 2024 margin
- Lean D (+7.0) · D 53.0% · R 46.0%
- 2008→2024 swing
- -9.6pp toward R · 2008: 16.6pp · 2024: 7.0pp
- All cycles
- 2024: D+7.0 2020: D+9.6 2016: D+8.2 2012: D+14.8 2008: D+16.6
Not yet ingested
- Civics
- —
Market trends
- HPI YoY
- ▼ -164.43%
- Current HPI
- 208.6149
- Rent YoY
- ▲ 7.98%
- Metro
- Akron, OH
- State GDP YoY
- ▲ 1.98%
- F500 in state
- 48
Industry mix (Fortune 500 HQ in OH)
| Industry | F500 HQs | Revenue |
|---|---|---|
| Insurance | 3 | $145B |
|
||
| Industrial Machinery | 3 | $49B |
|
||
| Financial Services | 3 | $24B |
|
||
| Consumer Goods | 2 | $93B |
|
||
| Aerospace / Defense | 2 | $47B |
|
||
| Utilities | 2 | $33B |
|
||
Price history
+168.2% since first listed26 events — show timeline
- 2026-03-06 Listed $295,000 MLSNOW
- 2025-05-05 Rental Removed $700 SHOWMOJO2
- 2025-05-01 Listed for Rent $700 SHOWMOJO2
- 2025-04-01 Rental Removed $700 SHOWMOJO
- 2025-04-01 Listed for Rent $700 SHOWMOJO
- 2022-03-10 Sold (Public Records) $185,000 Public Records
- 2018-08-14 Relisted — MLSNOW
- 2018-08-14 Listing Removed — MLSNOW
- 2018-07-23 Contingent — MLSNOW
- 2018-06-21 Listed $124,900 MLSNOW
- 2015-09-03 Sold (Public Records) $67,500 Public Records
- 2007-11-15 Listing Removed — MLSNOW
- 2007-05-15 Listed $155,000 MLSNOW
- 2005-12-02 Sold (Public Records) $145,500 Public Records
- 2005-12-02 Sold (MLS) $145,500 MLSNOW
- 2005-08-31 Listed $152,900 MLSNOW
- 2005-03-01 Sold (MLS) $120,000 MLSNOW
- 2005-02-23 Listing Removed — MLSNOW
- 2004-11-22 Listed $124,900 MLSNOW
- 1999-08-03 Sold (Public Records) $127,000 Public Records
- 1999-05-10 Listed $129,900 MLSNOW
- 1995-12-01 Listing Removed — MLSNOW
- 1995-11-17 Sold (Public Records) $92,000 Public Records
- 1995-06-02 Listed $99,900 MLSNOW
- 1994-12-27 Listing Removed — MLSNOW
- 1993-06-01 Listed $109,999 MLSNOW
Property tax history
+1.3%/yrLatest (2025): $3,926 · +2.8% YoY. Source: county tax records.
Cash-flow waterfall
monthlySold comps — $/sqft
last 12 mo · ≤1 miLoading sold comps…