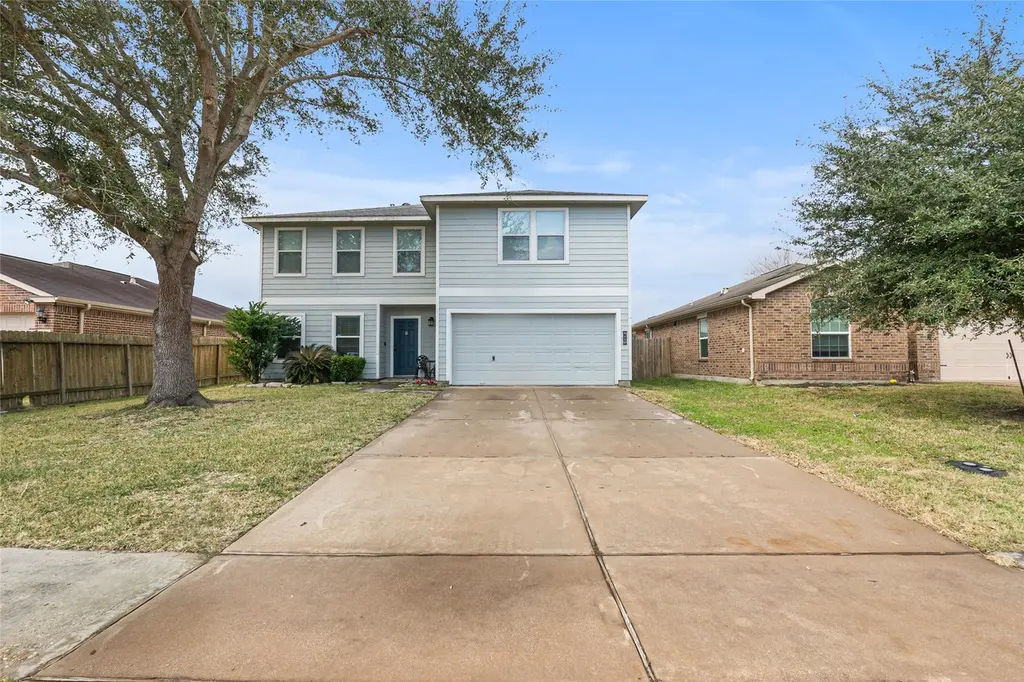
5110 Oakbriar Ln · Rosenberg, TX
Flood risk 5/10 · Moderate
- FEMA flood zone
- X (unshaded)
- Chance of flooding over 30 yrs
- 0.65%
- Est. flood insurance / yr
- $507 – $1,088
Fire risk 4/10 · Minor
- Est. fire insurance / yr
- $1,222 – $2,270
Heat risk 9/10 · Severe
- Hot days now (above 110°F)
- 7 days/yr
- Hot days in 30 yrs
- 23 days/yr
Wind risk 9/10 · Severe
- Chance of severe wind over 30 yrs
- 99.0%
Air-quality risk 2/10 · Minimal
- Unhealthy air days now
- 1 days/yr
- Unhealthy air days in 30 yrs
- 1 days/yr
Risk factors via First Street. Map © Google.
Why this score? — see what drove the D+ grade
The composite is a weighted blend of 9 inputs, each scored 0–100. Each bar is that input's sub-score; the figure is the points it added to the 100-point composite (weight × sub-score).
- Cash flow +17.6/30.0
- ARV discount +7.1/15.0
- 1% rule +5.6/10.0
- DSCR +5.5/10.0
- Schools +4.6/10.0
- Livability +3.1/5.0
- Condition / age +2.5/5.0
- Rent growth +2.0/5.0
- Appreciation +0.0/10.0
$270,000
🖨 Deal sheet 📄 Offer letter ✓ Due diligence
Listing remarks MLS
Welcome to a very nice house, very well kept, it offers you 3 bedrooms all up stairs, with walking closets and a big game room all bedrooms with ceiling fans. 2 full bathrooms up stairs, and a half bathroom down stairs. Down stairs you find a combination of living room and dining room, a kitchen with a breakfast area, big pantry and a lager laundry area. House was painted on 12/24 and the carpet change on 11/24. As well as the dishwasher, refrigerator, and stove were changed on 12/24.
Key facts
- 6,433 sq ft lot
- 2 garage spots
- Built 2007
Neighborhood map
What this means for you Summary
Snapshot
- This is a 3-bed/2.0-bath single-family listed at $270k.
Deal economics
- At list price, monthly cash flow is $214 ($3k/yr) — positive.
- The deal already cash-flows at list — no discount required.
- Meets the 1% rule at list price ($3k rent vs $270k).
- Recommended offer: $238k (12.0% below list) — sets the bar for market timing.
- Cap rate 7.2% vs local median 3.4% in Rosenberg — top-decile yield for the area; either an underpriced asset or a hidden risk that comps aren't pricing in. Stress-test before assuming the spread holds.
Location & tenants
- Location reads 62/100 on livability (#922 in TX) — a middle-class / working-renter tenant base. Strengths: cost of living A+, housing A+, crime B; Watch: schools D-, amenities F, commute F.
- Lamar CISD (suburban): math 50% / reading 53% proficiency, ranked #116 of 826 in TX (top 14%) — acceptable for families but not a draw, mixed tenant base, ~2y average lease.
- Market conditions: Rents soft (-1.8%/yr); 1332 active listings in the ZIP; 4 comparable units currently listed for rent nearby; rentals leasing fast (median 13d on market — plan ~1-2 weeks tenant-placement turnaround); solid renter incomes; 12,093 units permitted in Fort Bend County in 2024 (815 in 5+ unit buildings).
- This rent runs 34% of the median local income ($102k/yr) — at the standard rent-burdened threshold; future hikes will face affordability resistance.
Forward outlook
- Local home prices are declining (-3.0%/yr); year-one equity from $2k of loan paydown is wiped out by about $8k of value loss. Plan a longer hold.
- Fort Bend County population projected at +75% by 2050 — long-run rental-demand tailwind backs the buy-and-hold thesis.
Negotiation context
- It's been on market 134 days — a 12% lower offer ($238k) is reasonable based on typical stale-listing flexibility.
- 2 sale attempts with the ask held roughly flat each time — persistent listings suggest the price (not the market) is what's stuck; bring a comps-based counter.
Risks & watch-outs
- Climate carrying-cost: moderate flood risk; severe wind risk, 99% chance of damaging wind over 30y; extreme-heat days projected 7→23/yr by 2055 (HVAC capex compounding) — expect insurance premiums to compound above CPI over the hold.
Questions for the listing agent
- It's been on market 134 days. Have you received any prior offers? Is the seller open to a 12% concession, seller financing, or rate buy-down credit?
- What does the HOA fee cover, when was the last increase, and are there any pending special assessments or reserve-fund shortfalls?
- Why hasn't it sold? Are there any deal-killer items the seller is aware of (foundation, flood, title, zoning, code violations)?
- Is there a deadline driving the sale (1031 exchange, divorce, estate, relocation)? That informs how much negotiation room exists.
- Schools are D-rated, which usually means shorter tenancies and higher turnover. Who's the typical renter profile here, and what's been the actual vacancy rate?
- The area grade is low — what's the realistic commute time and amenity access for the typical tenant pool here? Any planned neighborhood developments (good or bad) we should know about?
- What's the average days-on-market for RENTAL listings here right now (not sales)? A rising rental-DOM trend means longer vacancies and softer asking-rent achievability than the comps imply.
- What's the recent tenant-quality profile in this submarket — average credit score on applications, eviction rate, late-payment / NSF rate, and stable-employment percentage? A property-management company in the area should have these aggregated.
- How much new for-sale + rental construction is in the pipeline within 1–3 miles? Heavy new supply typically softens prices + rents 12–24 months out; constrained supply supports both.
Investment metrics
- 1% rule
- 1.06% ✓
- Cap rate
- 7.24%
- Cash-on-cash
- 3.40%
- DSCR
- 1.15
- GRM
- 7.8
CMA / ARV
- ARV (median comp)
- $267,358
- List price
- $270,000
- Delta
- 0.99%
- Verdict
- FAIR
- Comps
- 20 within 1.0 mi
Show comp detail 12 sales within ~0.75 mi
| Address | Dist | Beds/Ba | Sqft | Sold | Price | $/sf | Match |
|---|---|---|---|---|---|---|---|
| 2003 Beach Bluff Rd | 0.10mi | 3/2.5 | 2,027 (-10%) | 2mo | $275,000 | $136 | 75 |
| 4911 Arbury Hill Ln | 0.21mi | 4/2.5 (+1) | 2,157 (-5%) | 13mo | $329,000 | $153 | 65 |
| 1818 Cardinal Sky Way | 0.74mi | 4/2.0 (+1) | 2,251 (-0%) | 6mo | $306,000 | $136 | 55 |
| 4330 Eagle Pass Dr | 0.71mi | 3/2.0 | 2,093 (-7%) | 2mo | $361,990 | $173 | 53 |
| 2704 Pine Bluff Dr | 0.75mi | 3/2.5 | 2,386 (+6%) | 2mo | $396,990 | $166 | 52 |
| 4810 Seabourne Landing Dr | 0.30mi | 4/3.0 (+1) | 2,009 (-11%) | 8mo | $324,900 | $162 | 52 |
| 4610 Monarch Bend Ln | 0.45mi | 3/2.0 | 1,928 (-15%) | 3mo | $309,000 | $160 | 52 |
| 4411 Eagle Pass Dr | 0.71mi | 4/3.0 (+1) | 2,393 (+6%) | 1mo | $381,990 | $160 | 48 |
| 4711 Bartagrass Dr | 0.38mi | 4/3.0 (+1) | 2,021 (-11%) | 10mo | $335,000 | $166 | 47 |
| 2624 Pine Bluff Dr | 0.72mi | 3/2.0 | 2,517 (+11%) | 1mo | $404,990 | $161 | 47 |
| 4315 Eagle Pass Dr | 0.75mi | 4/3.0 (+1) | 2,393 (+6%) | 2mo | $379,990 | $159 | 45 |
| 4323 Eagle Pass Dr | 0.74mi | 4/2.0 (+1) | 1,941 (-14%) | 4mo | $354,990 | $183 | 34 |
Match score weights: distance 35% · size 25% · config 20% · recency 20%. Top-matched comps best support the ARV.
Projected returns pro-forma
-3.0% appreciation · 0.0% rent growth · sell at horizon
- IRR
- -14.7%
- Equity multiple
- 0.49×
- Total profit
- $-38,379
- Equity at exit
- $40,258
- IRR
- -12.6%
- Equity multiple
- 0.37×
- Total profit
- $-47,740
- Equity at exit
- $23,345
Cash invested: $75,600 (down + closing). Projections, not guarantees.
Landlord ↔ Tenant lean methodology
- Overall (STATE)
- 87 Strongly Landlord-Friendly
- State Texas
- 87 Strongly Landlord-Friendly · R+5
- County
- — inherits STATE
- City
- — inherits STATE
ZIP-level market 77469
- Home prices YoY
- -25.1%
- Rents YoY
- -1.8%
- Active inventory
- 1332
- Price-to-rent
- 7.8×
Monthly cashflow live
- Estimated rent
- $2,870 medium interval (Pro) →
- Mortgage (P&I)
- −$1,416
- Tax from tax record
- −$500 /mo · $6,004/yr
- Insurance
- −$112
- HOA
- −$25
- Vacancy / Maint / Mgmt
- −$603
- Net cashflow
- $214
Break-even live
UW: 25.0% down · 7.5% · 30yr · 1.5% tax · 5.0% vac · 8.0% maint · 8.0% mgmt
Financing live
Cash to close
- Down payment
- $67,500
- Closing costs
- $8,100
- Reserves months
- —
- Total cash needed
- —
Loan-product check · same deal, 3 products live
Conventional
25% down · 7.5% · 30yr
- Down + closing
- —
- Monthly P&I
- —
- Monthly cashflow
- —
- DSCR
- —
- Eligible?
- —
Personal DTI + credit; lowest rate.
DSCR
20% down · 8.5% · 30yr
- Down + closing
- —
- Monthly P&I
- —
- Monthly cashflow
- —
- DSCR
- —
- Eligible?
- —
No personal income docs; deal must DSCR.
Hard money
10% down · 12.0% · 12mo
- Down + closing
- —
- Monthly P&I
- —
- Monthly cashflow
- —
- DSCR
- —
- Eligible?
- —
Short-term bridge; refi at stabilization.
Rent comps 4 comps
| Address | Beds | Baths | Sqft | Rent | $/sqft | DOM | Units | Dist |
|---|---|---|---|---|---|---|---|---|
| 4516 Bartagrass Dr Richmond, TX | 4.0 | 2.0 | 2160 | $3,850 | $1.78 | 44d | 1 | 0.53mi |
| 5120 Twin Summit Dr Richmond, TX | 4.0 | 2.0 | 1932 | $2,099 | $1.09 | 13d | 1 | 1.35mi |
| 930 Salado Slough Ln Rosenberg, TX | 4.0 | 2.5 | 2427 | $2,149 | $0.89 | 3d | 1 | 1.45mi |
| 3715 Rock Ledge Dr Richmond, TX | 3.0 | 2.5 | 2398 | $2,400 | $1.00 | 10d | 1 | 1.50mi |
HOA detail
- Monthly dues
- $25 · $300/yr
Listing history 19 events
-
2026-06-18days on market $270,000 Active 134 DOM
-
2026-06-17days on market $270,000 Active 133 DOM
-
2026-06-16days on market $270,000 Active 132 DOM
-
2026-06-15days on market $270,000 Active 131 DOM
-
2026-06-13days on market $270,000 Active 129 DOM
-
2026-06-10days on market $270,000 Active 125 DOM
-
2026-06-08days on market $270,000 Active 124 DOM
-
2026-06-07days on market $270,000 Active 123 DOM
-
2026-06-04days on market $270,000 Active 120 DOM
-
2026-06-03days on market $270,000 Active 119 DOM
-
2026-06-02days on market $270,000 Active 118 DOM
-
2026-06-01days on market $270,000 Active 117 DOM
-
2026-05-31days on market $270,000 Active 116 DOM
-
2026-02-05price $270,000 492-char remark
Show marketing remark (492 chars)
Welcome to a very nice house, very well kept, it offers you 3 bedrooms all up stairs, with walking closets and a big game room all bedrooms with ceiling fans. 2 full bathrooms up stairs, and a half bathroom down stairs. Down stairs you find a combination of living room and dining room, a kitchen with a breakfast area, big pantry and a lager laundry area. House was painted on 12/24 and the carpet change on 11/24. As well as the dishwasher, refrigerator, and stove were changed on 12/24.
-
2026-02-04$265,000 Active 492-char remark
Show marketing remark (492 chars)
Welcome to a very nice house, very well kept, it offers you 3 bedrooms all up stairs, with walking closets and a big game room all bedrooms with ceiling fans. 2 full bathrooms up stairs, and a half bathroom down stairs. Down stairs you find a combination of living room and dining room, a kitchen with a breakfast area, big pantry and a lager laundry area. House was painted on 12/24 and the carpet change on 11/24. As well as the dishwasher, refrigerator, and stove were changed on 12/24.
-
2026-01-25historical
-
2025-06-13price $285,000
-
2025-02-17price $289,500
-
2025-01-06$295,999 Active
ⓘ Source: listings_history table (triggers on properties + properties_extension) + one-shot
backfill from property_details.listing_events for pre-trigger history.
Tax reassessment forecast TX · Resets to sale price
- Current annual tax
- $6,004 · $500/mo
- Projected year-2 tax
- $6,004 · $500/mo
- Expected delta
- $0/yr ($0/mo · 0.0%)
ⓘ Screening estimate from a state-policy table — verify with the county assessor before closing.
Climate risk First Street
- Flood 5/10 Major FEMA zone X (unshaded) · 65% chance over 30 yrs
- Wildfire 4/10 Moderate
- Heat 9/10 Extreme 7 d/yr ≥110°F today · 23 d/yr by 30 yrs out
- Wind 9/10 Extreme 99% chance of damaging wind over 30 yrs
- Air quality 2/10 Low 1 unhealthy d/yr today · 1 by 30 yrs out
Nearby sold comps map
Loading sold comps map…
Walkable amenities ~0.75 mi
Loading nearby amenities…
Taxation est. · year 1
- Rental income
- $34,446
- − Mortgage interest
- −$15,124
- − Property taxes
- −$6,004
- − Insurance
- −$1,350
- − Repairs & maintenance
- −$2,756
- − Management
- −$2,756
- − HOA
- −$300
- − Depreciation
- −$7,855
- Taxable loss
- −$1,698
- Est. tax savings @ 24.0%
- +$408
- After-tax cash flow
- $2,975/yr
For passive investors: Depreciation is non-cash, so a rental often shows a tax loss while cash-flowing — sheltering income. Rental losses are passive: they offset passive income freely, and up to $25,000/yr can offset ordinary (W-2) income if you actively participate and your MAGI is under $100k (phasing out to $0 by $150k); unused losses carry forward. On sale, claimed depreciation is recaptured at up to 25%, and gains may owe capital-gains tax (a 1031 exchange can defer both). Figures are a year-1 estimate at your 24.0% rate — not tax advice; consult a CPA.
Schools (NCES district)
- District
- Lamar CISD
- NCES district ID
- 4826580
- Math proficiency
- 50% ▼ -12.00%
- Reading proficiency
- 53% ▼ -4.00%
- Median HH income
- $75,213
- Composite
- 46.43/100
- National rank
- #2452
- State rank
- #116 of 826 in TX
Livability — Rosenberg
- Score
- 62/100
- State rank
- #922
- US rank
- #16414
Category grades
Schools grade is shown separately in the Schools card above.
Census & demographics
- Census place
- Rosenberg, TX
- County
- Fort Bend County · 836,777 people
- Metro
- Houston-The Woodlands-Sugar Land, TX
- Population (ZIP)
- 69,826
- Household income
- $102,125
- Rent vs Own
- Severe rent burden
- 1292.0
Population outlook (Fort Bend County) Hauer SSP2
- Today (2025)
- 1,004,526 people
- By 2030
- 1,153,104 · +14.8%
- By 2040
- 1,453,718 · +44.7%
- By 2050
- 1,753,781 · +74.6%
- By 2075
- 2,455,772 · +144.5%
- By 2100
- 2,930,528 · +191.7%
Race, ethnicity, and origin ACS 2023
- Neighborhood character
- Highly diverse neighborhood (Simpson 0.76)
- Race & ethnicity
- Hispanic / Latino 29% White 27% Black 25% Two or more races 15% Asian 15%
- Hispanic origin (detail)
- Mexican 21%
- Common ancestry
- Romanian 1% Lithuanian 1%
- Foreign-born
- 24% · Canada, Vietnam, China
- Languages at home
- 65% English-only · Spanish 17% Other Indo-European 7% Other Asian/Pacific 2%
Political lean MEDSL · Fort Bend
- 2024 margin
- Toss-up / Even · D 49.5% · R 47.9% · Other 2.6%
- 2008→2024 swing
- +4.0pp toward D · 2008: -2.4pp · 2024: 1.6pp
- All cycles
- 2024: D+1.6 2020: D+10.6 2016: D+6.6 2012: R+6.8 2008: R+2.4
Not yet ingested
- Civics
- —
Market trends
- HPI YoY
- ▼ -78.66%
- Current HPI
- 234.9892
- Rent YoY
- ▼ -1.81%
- Metro
- Houston-The Woodlands-Sugar Land, TX
- State GDP YoY
- ▲ 3.95%
- F500 in state
- 110
Industry mix (Fortune 500 HQ in TX)
| Industry | F500 HQs | Revenue |
|---|---|---|
| Energy | 16 | $1,198B |
|
||
| Technology | 5 | $198B |
|
||
| Engineering / Construction | 4 | $72B |
|
||
| Energy Services | 3 | $60B |
|
||
| Utilities | 3 | $41B |
|
||
| Healthcare | 2 | $330B |
|
||
Price history
-8.8% since first listed6 events — show timeline
- 2026-02-05 Price Changed $270,000 HARMLS
- 2026-02-04 Listed $265,000 HARMLS
- 2026-01-25 Listing Removed — HARMLS
- 2025-06-13 Price Changed $285,000 HARMLS
- 2025-02-17 Price Changed $289,500 HARMLS
- 2025-01-06 Listed $295,999 HARMLS
Property tax history
+3.2%/yrLatest (2025): $6,004 · +9.2% YoY. Source: county tax records.
Cash-flow waterfall
monthlySold comps — $/sqft
last 12 mo · ≤1 miLoading sold comps…