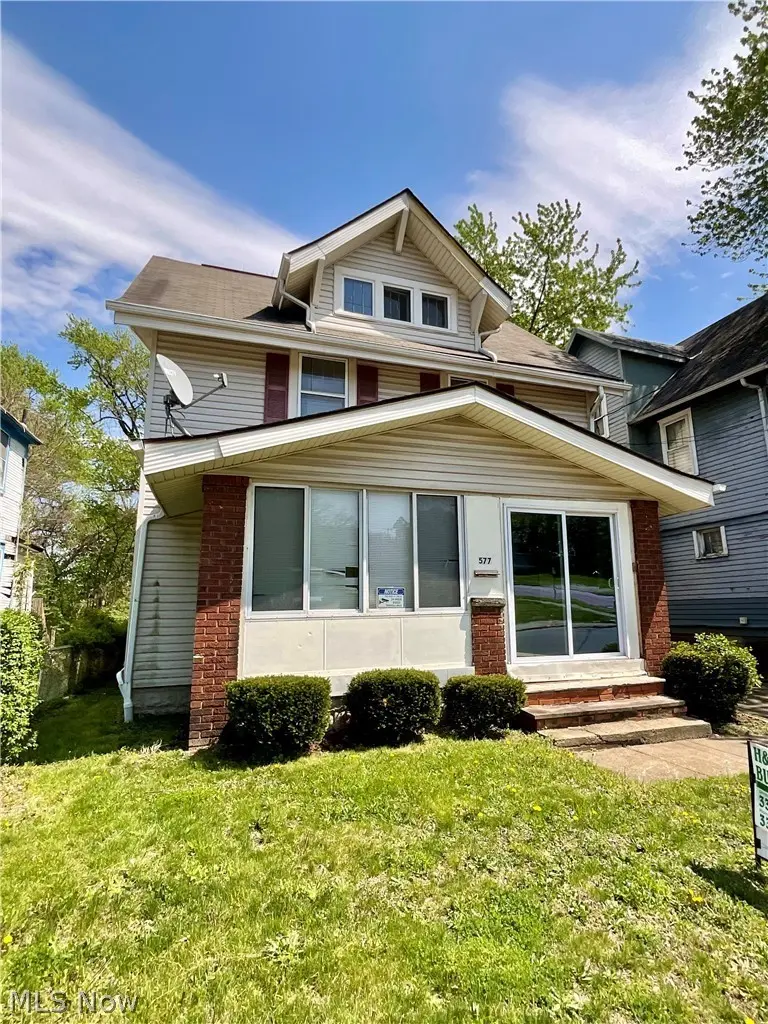
577 Rhodes Ave · Akron, OH
Flood risk 1/10 · Minimal
- FEMA flood zone
- X (unshaded)
- Chance of flooding over 30 yrs
- 0.0%
- Est. flood insurance / yr
- $473 – $860
Fire risk 1/10 · Minimal
- Est. fire insurance / yr
- $713 – $1,323
Heat risk 3/10 · Minor
- Hot days now (above 97°F)
- 7 days/yr
- Hot days in 30 yrs
- 17 days/yr
Wind risk 1/10 · Minimal
- Chance of severe wind over 30 yrs
- —
Air-quality risk 3/10 · Minor
- Unhealthy air days now
- 2 days/yr
- Unhealthy air days in 30 yrs
- 4 days/yr
Risk factors via First Street. Map © Google.
Why this score? — see what drove the B+ grade
The composite is a weighted blend of 9 inputs, each scored 0–100. Each bar is that input's sub-score; the figure is the points it added to the 100-point composite (weight × sub-score).
- Cash flow +30.0/30.0
- ARV discount +15.0/15.0
- DSCR +10.0/10.0
- 1% rule +8.5/10.0
- Appreciation +4.9/10.0
- Livability +4.0/5.0
- Rent growth +2.5/5.0
- Condition / age +2.5/5.0
- Schools +2.1/10.0
$98,900
🖨 Deal sheet (PDF) 📄 Offer letter ✓ Due diligence
Listing remarks MLS
Welcome to 577 Rhodes Avenue! This traditional 3 bedroom 1.5 bathroom Colonial features classic character with timeless design. Located in an area experiencing continued growth and investment, the property is positioned near ongoing estimated $21 million dollar expansion of the Akron Zoo, bringing new energy and development to the neighborhood. The spacious traditional layout include an enclosed front porch/sun room-a great space to relax, read or enjoy morning coffee- a large kitchen equipped with refrigerator and stove, brick fireplace, and loft-style attic that could serve as an additional bedroom, home office, gym or recreation area. Freshly painted throughout, newer carpet in bedrooms, 1 car garage and fenced in backyard perfect for pets to roam and children to play— schedule your showing today! Potential investment opportunity- Market Rent: $1250-$1300 Cash on Cash ROI: approx 16% (solid cash flow)
Key facts
- Loft-style attic
- Brick fireplace
- Fenced in backyard
Tags
Neighborhood map
What this means for you Summary
Snapshot
- This is a 3-bed/1.5-bath single-family listed at $99k.
Deal economics
- At list price, monthly cash flow is $406 ($5k/yr) — positive.
- The deal already cash-flows at list — no discount required.
- Meets the 1% rule at list price ($1k rent vs $99k).
- Recommended offer: $93k (6.0% below list) — sets the bar for market timing.
- Cap rate 11.2% vs local median 6.6% in Akron — top-decile yield for the area; either an underpriced asset or a hidden risk that comps aren't pricing in. Stress-test before assuming the spread holds.
Location & tenants
- Location reads 81/100 on livability (#104 in OH, #1,591 nationally) — a professional / high-income tenant draw. Strengths: amenities A+, commute A+, cost of living A+; Watch: crime F, employment F.
- Akron City (urban): math 22% / reading 30% proficiency, ranked #602 of 656 in OH (top 92%) — low school quality limits family demand, transient renter base, plan for 1-2y turnover; 66% free/reduced lunch — lower-income household profile, screen leases tightly.
- Market conditions: 42 active listings in the ZIP; 40 comparable units currently listed for rent nearby; rentals lingering (median 45d on market — plan ~5-8 weeks vacancy on turnover, expect pricing pressure); 50% of comp listings sitting > 30 days — soft ceiling on asking rent; lower-income renter base — watch delinquency; 1,114 units permitted in Summit County in 2024 (397 in 5+ unit buildings).
- At $1,335/mo this rent would consume 58% of the median local household income ($28k/yr) (locally 787% of renters already pay >50% of income on rent) — very limited rent-growth headroom before tenants either downsize or default.
Forward outlook
- In year one you build about $490 of equity ($684 loan paydown + $-194 appreciation (-0.2% local appreciation)).
- Summit County population projected to shrink 6% by 2050 — rents likely to lag national; underwrite the cash flow, not the appreciation.
- At projected returns (-0.2% appreciation + 3.0% rent growth), your $28k cash investment doubles in ~5 years — after that, you're playing with house money.
Negotiation context
- It's been on market 78 days — a 6% lower offer ($93k) is reasonable based on typical stale-listing flexibility.
- 4 sale attempts since 27y ago with the ask held roughly flat each time — persistent listings suggest the price (not the market) is what's stuck; bring a comps-based counter.
- Current owner paid $20k; list at $99k implies a 394% gain — meaningful room to come down on a strong offer.
Risks & watch-outs
- Watch-outs: built in 1918 — expect roof / HVAC / electrical / plumbing capex.
Questions for the listing agent
- It's been on market 78 days. Have you received any prior offers? Is the seller open to a 6% concession, seller financing, or rate buy-down credit?
- Built in 1918 — when were the roof, HVAC, electrical panel, plumbing, and water heater last replaced?
- Why hasn't it sold? Are there any deal-killer items the seller is aware of (foundation, flood, title, zoning, code violations)?
- Is there a deadline driving the sale (1031 exchange, divorce, estate, relocation)? That informs how much negotiation room exists.
- Crime grade is F in this area — have there been break-ins, vandalism, or insurance claims at this property in the last 3 years? What carrier currently insures it and at what premium?
- What's the average days-on-market for RENTAL listings here right now (not sales)? A rising rental-DOM trend means longer vacancies and softer asking-rent achievability than the comps imply.
- What's the recent tenant-quality profile in this submarket — average credit score on applications, eviction rate, late-payment / NSF rate, and stable-employment percentage? A property-management company in the area should have these aggregated.
- How much new for-sale + rental construction is in the pipeline within 1–3 miles? Heavy new supply typically softens prices + rents 12–24 months out; constrained supply supports both.
Investment metrics
- 1% rule
- 1.35% ✓
- Cap rate
- 11.22%
- Cash-on-cash
- 17.59%
- DSCR
- 1.78
- GRM
- 6.2
CMA / ARV
- ARV (median comp)
- $124,717
- List price
- $98,900
- Delta
- -20.70%
- Verdict
- UNDERPRICED
- Comps
- 20 within 1.0 mi
Show comp detail 12 sales within ~0.75 mi
| Address | Dist | Beds/Ba | Sqft | Sold | Price | $/sf | Match |
|---|---|---|---|---|---|---|---|
| 557 Wildwood Ave | 0.57mi | 3/1.0 | 1,545 (+0%) | 2mo | $65,000 | $42 | 70 |
| 595 Rhodes Ave | 0.03mi | 3/1.0 | 1,326 (-14%) | 8mo | $52,500 | $40 | 67 |
| 677 Crossings Ln | 0.46mi | 3/2.5 | 1,440 (-7%) | 1mo | $220,000 | $153 | 63 |
| 445 Beechwood Dr | 0.68mi | 3/1.0 | 1,498 (-3%) | 2mo | $142,850 | $95 | 60 |
| 555 Hoye Ave | 0.62mi | 4/1.0 (+1) | 1,505 (-2%) | 2mo | $15,500 | $10 | 59 |
| 568 Auld Farm Cir | 0.44mi | 3/2.5 | 1,664 (+8%) | 5mo | $227,000 | $136 | 58 |
| 413 Crestwood Ave | 0.67mi | 3/2.0 | 1,450 (-6%) | 4mo | $157,000 | $108 | 54 |
| 212 Gale St | 0.62mi | 4/1.5 (+1) | 1,671 (+8%) | 2mo | $115,000 | $69 | 50 |
| 975 Raymond St | 0.74mi | 4/1.0 (+1) | 1,648 (+7%) | 2mo | $80,000 | $49 | 45 |
| 385 Campbell St | 0.61mi | 4/1.0 (+1) | 1,387 (-10%) | 6mo | $105,000 | $76 | 42 |
| 144 Hall St | 0.72mi | 4/2.0 (+1) | 1,668 (+8%) | 8mo | $80,000 | $48 | 39 |
| 614 East Ave | 0.64mi | 4/3.0 (+1) | 1,767 (+15%) | 4mo | $103,000 | $58 | 32 |
Match score weights: distance 35% · size 25% · config 20% · recency 20%. Top-matched comps best support the ARV.
Projected returns pro-forma
-0.2% appreciation · 3.0% rent growth · sell at horizon
- IRR
- 16.7%
- Equity multiple
- 1.80×
- Total profit
- $22,049
- Equity at exit
- $27,750
- IRR
- 21.4%
- Equity multiple
- 3.33×
- Total profit
- $64,442
- Equity at exit
- $32,594
Cash invested: $27,692 (down + closing). Projections, not guarantees.
Landlord ↔ Tenant lean methodology
- Overall (STATE)
- 73 Landlord-Friendly
- State Ohio
- 73 Landlord-Friendly · R+6
- County
- — inherits STATE
- City
- — inherits STATE
ZIP-level market 44307
- Home prices YoY
- -0.2%
- Active inventory
- 42
- Price-to-rent
- 6.2×
Monthly cashflow live
- Estimated rent
- $1,335 high interval (Pro) →
- Mortgage (P&I)
- −$519
- Tax from tax record
- −$89 /mo · $1,070/yr
- Insurance
- −$41
- HOA
- −$0
- Vacancy / Maint / Mgmt
- −$280
- Net cashflow
- $406
Break-even live
Sensitivity live
| Price | -10% $462 | -5% $434 | +0% $406 | +5% $378 | +10% $350 |
|---|---|---|---|---|---|
| Rent | -10% $300 | -5% $353 | +0% $406 | +5% $459 | +10% $511 |
| Rate | -1.0pp $456 | -0.5pp $431 | base $406 | +0.5pp $380 | +1.0pp $354 |
UW: 25.0% down · 7.5% · 30yr · 1.5% tax · 5.0% vac · 8.0% maint · 8.0% mgmt
Financing live
Cash to close
- Down payment
- $24,725
- Closing costs
- $2,967
- Reserves months
- —
- Total cash needed
- —
Loan-product check · same deal, 3 products live
Conventional
25% down · 7.5% · 30yr
- Down + closing
- —
- Monthly P&I
- —
- Monthly cashflow
- —
- DSCR
- —
- Eligible?
- —
Personal DTI + credit; lowest rate.
DSCR
20% down · 8.5% · 30yr
- Down + closing
- —
- Monthly P&I
- —
- Monthly cashflow
- —
- DSCR
- —
- Eligible?
- —
No personal income docs; deal must DSCR.
Hard money
10% down · 12.0% · 12mo
- Down + closing
- —
- Monthly P&I
- —
- Monthly cashflow
- —
- DSCR
- —
- Eligible?
- —
Short-term bridge; refi at stabilization.
Rent comps 40 comps
| Address | Beds | Baths | Sqft | Rent | $/sqft | DOM | Units | Dist |
|---|---|---|---|---|---|---|---|---|
| 445 S Maple St Akron, OH | 3.0 | 1.5 | 1041 | $1,240 | $1.19 | 44d | 7 | 0.41mi |
| 378 Trigonia Dr Akron, OH | 3.0 | 1.5 | 1090 | $1,200 | $1.10 | 44d | 1 | 0.47mi |
| 677 Crossings Ln Akron, OH | 3.0 | 2.5 | 1440 | $1,950 | $1.35 | 24d | 1 | 0.48mi |
| 686 East Ave Akron, OH | 4.0 | 2.0 | 2032 | $1,700 | $0.84 | 44d | 1 | 0.61mi |
| 931 Trimble Dr Akron, OH | 2.0 | 1.5 | 1448 | $1,495 | $1.03 | 24d | 1 | 0.64mi |
| 202 Westwood Ave Akron, OH | 3.0 | 1.0 | 1344 | $1,250 | $0.93 | 15d | 1 | 0.65mi |
| 844 Lawton St Akron, OH | 4.0 | 2.0 | 1240 | $1,175 | $0.95 | 44d | 1 | 0.70mi |
| 530 S Main St Akron, OH | 1.0–2.0 | 1.0–2.0 | 937 | $2,195 | $2.34 | 44d | 2 | 0.77mi |
| 401 S Main St Akron, OH | 4.0 | 1.0–4.0 | 814 | $1,534 | $1.88 | 15d | 54 | 0.84mi |
| 311 Crestwood Ave Akron, OH | 4.0 | 2.0 | 1800 | $1,395 | $0.78 | 44d | 1 | 0.84mi |
| 378 Wildwood Ave Akron, OH | 4.0 | 1.0 | 1544 | $1,200 | $0.78 | 44d | 1 | 0.85mi |
| 91 Westwood Ave Akron, OH | 3.0 | 1.0 | 1631 | $1,450 | $0.89 | 15d | 1 | 0.85mi |
| 730 Noble Ave Akron, OH | 3.0 | 1.0 | 1092 | $1,200 | $1.10 | 24d | 1 | 0.85mi |
| 575 Noble Ave Akron, OH | 3.0 | 1.0 | 1300 | $1,350 | $1.04 | 15d | 1 | 0.86mi |
| 22 E Exchange St Unit 233 Akron, OH | 2.0 | 2.0 | 1052 | $1,599 | $1.52 | 44d | 1 | 0.87mi |
| 22 E Exchange St Apt 310 Akron, OH | 3.0 | 3.0 | 1496 | $1,962 | $1.31 | 44d | 1 | 0.87mi |
| 783 Boulevard St Akron, OH | 4.0 | 1.0 | 1440 | $999 | $0.69 | 24d | 1 | 0.88mi |
| 55 S Balch St Unit A Akron, OH | 2.0 | 1.0 | 1500 | $800 | $0.53 | 24d | 1 | 0.90mi |
| 53 S Balch St Unit 55 Akron, OH | 2.0 | 1.0 | 1500 | $850 | $0.57 | 15d | 1 | 0.90mi |
| 627 Crosby St Unit B Akron, OH | 4.0 | 1.0 | 1200 | $875 | $0.73 | 44d | 1 | 0.91mi |
| 724 Crosby St Akron, OH | 2.0 | 1.0 | 1582 | $995 | $0.63 | 24d | 1 | 0.91mi |
| 724 Crosby St Unit 1 Akron, OH | 2.0 | 1.0 | 1582 | $995 | $0.63 | 44d | 1 | 0.91mi |
| 961 Lawton St Akron, OH | 3.0 | 1.0 | 1144 | $1,450 | $1.27 | 15d | 1 | 0.93mi |
| 924 Hamlin St Akron, OH | 3.0 | 1.0 | 1106 | $1,300 | $1.18 | 44d | 1 | 0.93mi |
| 207 Crosby St Akron, OH | 4.0 | 1.0 | 1200 | $1,395 | $1.16 | 44d | 1 | 0.93mi |
| 713 Crosby St Unit 1496092P Akron, OH | 3.0 | 2.0 | 1840 | $5,078 | $2.76 | 21d | 1 | 0.93mi |
| 991 Diana Ave Akron, OH | 3.0 | 2.0 | 1264 | $1,325 | $1.05 | 44d | 1 | 0.96mi |
| 918 Bye St Akron, OH | 3.0 | 1.0 | 1248 | $1,200 | $0.96 | 44d | 1 | 0.97mi |
| 156 S Main St Akron, OH | 2.0–3.0 | 2.0 | 1197 | $2,985 | $2.49 | 24d | 4 | 1.00mi |
| 321 Grace Ave Akron, OH | 3.0 | 2.0 | 1484 | $1,175 | $0.79 | 15d | 1 | 1.02mi |
| 637 Storer Ave Akron, OH | 3.0 | 1.5 | 1322 | $1,250 | $0.95 | 15d | 1 | 1.06mi |
| 295 Noble Ave Akron, OH | 3.0 | 2.5 | 1488 | $1,600 | $1.08 | 44d | 1 | 1.14mi |
| 685 Longview Ave Akron, OH | 3.0 | 1.0 | 1100 | $1,150 | $1.05 | 44d | 1 | 1.21mi |
| 1313 Manchester Rd Akron, OH | 3.0 | 1.0 | 1221 | $1,200 | $0.98 | 21d | 1 | 1.21mi |
| 1161 La Croix Ave Akron, OH | 3.0 | 1.0 | 1452 | $1,200 | $0.83 | 24d | 1 | 1.22mi |
| 1171 La Croix Ave Unit 2 Akron, OH | 2.0 | 1.0 | 1267 | $975 | $0.77 | 44d | 1 | 1.22mi |
| 406 Sumner St Akron, OH | 2.0–4.0 | 1.0–2.0 | 836 | $1,085 | $1.30 | 15d | 3 | 1.28mi |
| 600 Sherman St Akron, OH | 4.0 | 1.0–2.0 | 824 | $1,400 | $1.70 | 15d | 14 | 1.36mi |
| 288 Cross St Akron, OH | 4.0 | 2.0 | 1512 | $1,295 | $0.86 | 44d | 1 | 1.37mi |
| 1090 Hartford Ave Akron, OH | 4.0 | 1.0 | 1328 | $1,125 | $0.85 | 44d | 1 | 1.38mi |
Listing history 16 events
-
2026-06-03status $98,900 Pending 78 DOM
-
2026-06-02days on market $98,900 Active 78 DOM
-
2026-06-01days on market $98,900 Active 77 DOM
-
2026-05-31days on market $98,900 Active 76 DOM
-
2026-05-31days on market $98,900 Active 75 DOM
-
2026-04-06price $98,900 934-char remark
Show marketing remark (934 chars)
Welcome to 577 Rhodes Avenue! This traditional 3 bedroom 1.5 bathroom Colonial features classic character with timeless design. Located in an area experiencing continued growth and investment, the property is positioned near ongoing estimated $21 million dollar expansion of the Akron Zoo, bringing new energy and development to the neighborhood. The spacious traditional layout include an enclosed front porch/sun room-a great space to relax, read or enjoy morning coffee- a large kitchen equipped with refrigerator and stove, brick fireplace, and loft-style attic that could serve as an additional bedroom, home office, gym or recreation area. Freshly painted throughout, newer carpet in bedrooms, 1 car garage and fenced in backyard perfect for pets to roam and children to play— schedule your showing today! Potential investment opportunity- Market Rent: $1250-$1300 Cash on Cash ROI: approx 16% (solid cash flow)
-
2026-03-16$101,900 Active 934-char remark
Show marketing remark (934 chars)
Welcome to 577 Rhodes Avenue! This traditional 3 bedroom 1.5 bathroom Colonial features classic character with timeless design. Located in an area experiencing continued growth and investment, the property is positioned near ongoing estimated $21 million dollar expansion of the Akron Zoo, bringing new energy and development to the neighborhood. The spacious traditional layout include an enclosed front porch/sun room-a great space to relax, read or enjoy morning coffee- a large kitchen equipped with refrigerator and stove, brick fireplace, and loft-style attic that could serve as an additional bedroom, home office, gym or recreation area. Freshly painted throughout, newer carpet in bedrooms, 1 car garage and fenced in backyard perfect for pets to roam and children to play— schedule your showing today! Potential investment opportunity- Market Rent: $1250-$1300 Cash on Cash ROI: approx 16% (solid cash flow)
-
2026-03-01historical
-
2026-02-13price $101,900
-
2025-12-12price $109,900
-
2025-09-17price $119,900
-
2025-09-05$129,900 Active
-
2007-09-28soldstatus $20,000
-
2007-09-28soldstatus $20,000
-
2007-06-11$23,900
-
1999-11-17$42,900
ⓘ Source: listings_history table (triggers on properties + properties_extension) + one-shot
backfill from property_details.listing_events for pre-trigger history.
Tax reassessment forecast OH · Partial reset (capped growth)
- Current annual tax
- $1,070 · $89/mo
- Projected year-2 tax
- $1,307 · $109/mo
- Expected delta
- +$236/yr (+$20/mo · 22.1%)
ⓘ Screening estimate from a state-policy table — verify with the county assessor before closing.
Climate risk First Street
- Flood 1/10 Low FEMA zone X (unshaded) · 0% chance over 30 yrs
- Wildfire 1/10 Low
- Heat 3/10 Moderate 7 d/yr ≥97°F today · 17 d/yr by 30 yrs out
- Wind 1/10 Low
- Air quality 3/10 Moderate 2 unhealthy d/yr today · 4 by 30 yrs out
Nearby sold comps map
Loading sold comps map…
Walkable amenities ~0.75 mi
Loading nearby amenities…
Taxation est. · year 1
- Rental income
- $16,024
- − Mortgage interest
- −$5,540
- − Property taxes
- −$1,070
- − Insurance
- −$494
- − Repairs & maintenance
- −$1,282
- − Management
- −$1,282
- − Depreciation
- −$2,877
- Taxable income
- $3,479
- Est. tax owed @ 24.0%
- −$835
- After-tax cash flow
- $4,036/yr
For passive investors: Depreciation is non-cash, so a rental often shows a tax loss while cash-flowing — sheltering income. Rental losses are passive: they offset passive income freely, and up to $25,000/yr can offset ordinary (W-2) income if you actively participate and your MAGI is under $100k (phasing out to $0 by $150k); unused losses carry forward. On sale, claimed depreciation is recaptured at up to 25%, and gains may owe capital-gains tax (a 1031 exchange can defer both). Figures are a year-1 estimate at your 24.0% rate — not tax advice; consult a CPA.
Schools (NCES district)
- District
- Akron City
- NCES district ID
- 3904348
- Math proficiency
- 22% ▼ -17.00%
- Reading proficiency
- 30% ▼ -12.00%
- Median HH income
- $33,811
- Composite
- 21.31/100
- National rank
- #8383
- State rank
- #602 of 656 in OH
Livability — Akron
- Score
- 81/100
- State rank
- #104
- US rank
- #1591
Category grades
Schools grade is shown separately in the Schools card above.
Census & demographics
- Census place
- Akron, OH
- County
- Summit County · 440,783 people
- City population
- 174,375
- Metro
- Akron, OH
- Population (ZIP)
- 6,653
- Household income
- $27,697
- Rent vs Own
- Severe rent burden
- 787.0
Population outlook (Summit County) Hauer SSP2
- Today (2025)
- 546,583 people
- By 2030
- 544,028 · -0.5%
- By 2040
- 531,363 · -2.8%
- By 2050
- 514,923 · -5.8%
- By 2075
- 481,765 · -11.9%
- By 2100
- 432,265 · -20.9%
Race, ethnicity, and origin ACS 2023
- Neighborhood character
- Predominantly Black (73%)
- Race & ethnicity
- Black 73% White 17% Two or more races 5% Hispanic / Latino 5%
- Common ancestry
- Slovak 1% Romanian 1% Iranian 1%
- Foreign-born
- 2% · Canada
- Languages at home
- 98% English-only · Spanish 2% French/Haitian/Cajun 1%
Political lean MEDSL · Summit
- 2024 margin
- Lean D (+7.0) · D 53.0% · R 46.0%
- 2008→2024 swing
- -9.6pp toward R · 2008: 16.6pp · 2024: 7.0pp
- All cycles
- 2024: D+7.0 2020: D+9.6 2016: D+8.2 2012: D+14.8 2008: D+16.6
Not yet ingested
- Civics
- —
Market trends
- HPI YoY
- ▼ -0.20%
- Current HPI
- 81.3728
- Rent YoY
- —
- Metro
- Akron, OH
- State GDP YoY
- ▲ 1.98%
- F500 in state
- 48
Industry mix (Fortune 500 HQ in OH)
| Industry | F500 HQs | Revenue |
|---|---|---|
| Insurance | 3 | $145B |
|
||
| Industrial Machinery | 3 | $49B |
|
||
| Financial Services | 3 | $24B |
|
||
| Consumer Goods | 2 | $93B |
|
||
| Aerospace / Defense | 2 | $47B |
|
||
| Utilities | 2 | $33B |
|
||
Price history
+130.5% since first listed11 events — show timeline
- 2026-04-06 Price Changed $98,900 MLSNOW
- 2026-03-16 Listed $101,900 MLSNOW
- 2026-03-01 Listing Removed — MLSNOW
- 2026-02-13 Price Changed $101,900 MLSNOW
- 2025-12-12 Price Changed $109,900 MLSNOW
- 2025-09-17 Price Changed $119,900 MLSNOW
- 2025-09-05 Listed $129,900 MLSNOW
- 2007-09-28 Sold (Public Records) $20,000 Public Records
- 2007-09-28 Sold (MLS) $20,000 MLSNOW
- 2007-06-11 Listed $23,900 MLSNOW
- 1999-11-17 Listed $42,900 MLSNOW
Property tax history
+0.3%/yrLatest (2025): $1,070 · +0.1% YoY. Source: county tax records.
Cash-flow waterfall
monthlySold comps — $/sqft
last 12 mo · ≤1 miLoading sold comps…