 Duplex
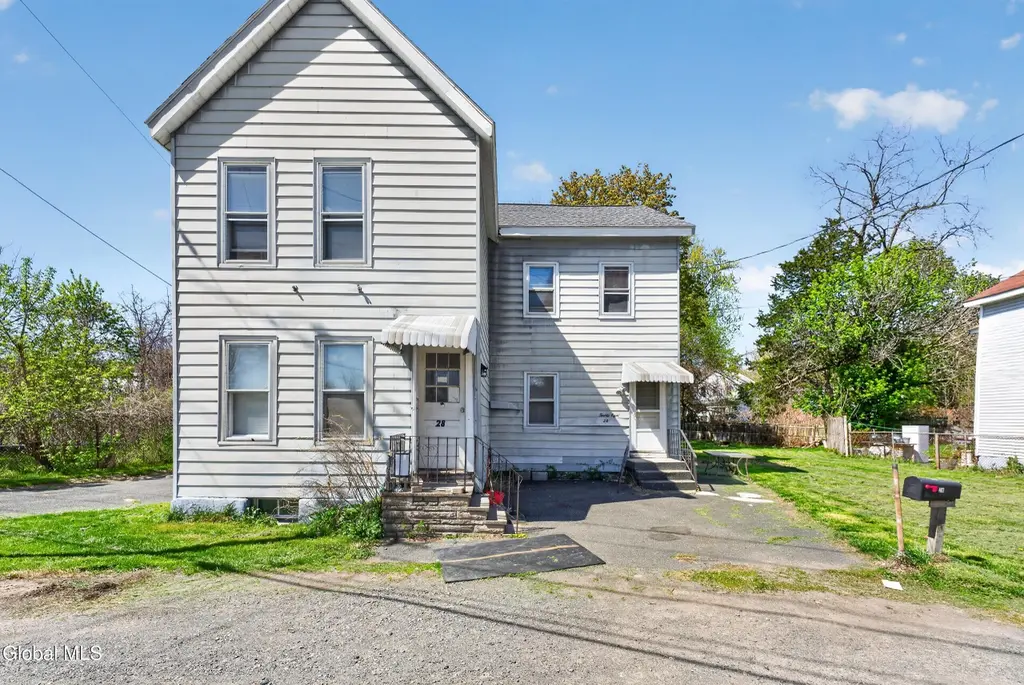
28 Mohawk Ave · Waterford, NY
Flood risk 10/10 · Severe
- FEMA flood zone
- AE
- Chance of flooding over 30 yrs
- 0.99%
- Est. flood insurance / yr
- $2,026 – $9,024
Fire risk 2/10 · Minimal
- Est. fire insurance / yr
- $691 – $1,283
Heat risk 4/10 · Minor
- Hot days now (above 98°F)
- 7 days/yr
- Hot days in 30 yrs
- 17 days/yr
Wind risk 3/10 · Minor
- Chance of severe wind over 30 yrs
- 6.0%
Air-quality risk 2/10 · Minimal
- Unhealthy air days now
- 0 days/yr
- Unhealthy air days in 30 yrs
- 1 days/yr
Risk factors via First Street. Map © Google.
Why this score? — see what drove the B grade
The composite is a weighted blend of 9 inputs, each scored 0–100. Each bar is that input's sub-score; the figure is the points it added to the 100-point composite (weight × sub-score).
- Cash flow +30.0/30.0
- 1% rule +10.0/10.0
- DSCR +10.0/10.0
- ARV discount +7.5/15.0
- Schools +5.1/10.0
- Livability +3.7/5.0
- Rent growth +2.5/5.0
- Condition / age +2.5/5.0
- Appreciation +0.0/10.0
$199,900
🖨 Deal sheet (PDF) 📄 Offer letter ✓ Due diligence
Multi-family units
County records classify this as Multi-Family (2-4 Unit). Listing-text estimate: 2 units. confirmed
Listing remarks MLS
Completely remodeled after Irene!! Great 2 Family Home. Low Taxes-Great Investment Opportunity. Tenants paying 1,700 a month. Second floor could easily pay more rent. New roof in 2006, Carport, shed, entire yard is fenced in. Conv. to I787/I90/I87. Excellent Condition
Key facts
- Two family
- Newer roof
- Heart of waterford
Tags
Property features AI
Finance
- Financial info: Two-unit property
Exterior
- Parking: Driveway parking for 2 vehicles
- Utilities: Public water; Public sewer
- Home design: Duplex
- Construction: Aluminum siding construction
- Exterior features: Shingle roof; Aluminum siding; 0.24-acre lot
Interior
- Bedrooms: Unit 1: 3 bedrooms; Unit 2: 3 bedrooms
- Bathrooms: Each unit has 1 full bathroom (one on the 1st level and one on the 2nd level across units overall)
- Heating & cooling: Baseboard heating; Radiant heating; Natural gas heating
- Interior features: Full, unfinished basement; Unit tenants pay heat, electricity, and gas; owner pays water and sewer
- Laundry & utility: Laundry located in the basement
Neighborhood map
What this means for you Summary
Snapshot
- This is a 2 × 3-bed/1.0-bath units multifamily listed at $200k.
Deal economics
- At list price, monthly cash flow is $1k ($13k/yr) — positive. Per door: $553/mo.
- The deal already cash-flows at list — no discount required.
- Meets the 1% rule at list price ($4k rent vs $200k).
Location & tenants
- Location reads 74/100 on livability (#285 in NY, #4,586 nationally) — a middle-class / working-renter tenant base. Strengths: housing A+, health & safety A+, crime A-; Watch: commute D+, amenities D.
- Waterford-Halfmoon Union Free School District (rural): math 60% / reading 54% proficiency, ranked #322 of 755 in NY (top 43%) — acceptable for families but not a draw, mixed tenant base, ~2y average lease.
- Zoned schools: Waterford-Halfmoon Elementary School (math 42% / reading 62%, grade C-, #988 of 2,108 statewide, top 49%, 402 students, 45% FRL); Waterford-Halfmoon Junior-Senior High School (math 62% / reading 44%, grade C-, #934 of 1,100 statewide, top 86%, 336 students, 36% FRL).
- Market conditions: 48 active listings in the ZIP; solid renter incomes; 1,132 units permitted in Saratoga County in 2024 (378 in 5+ unit buildings).
- At $3,961/mo this rent would consume 52% of the median local household income ($92k/yr) (locally 129% of renters already pay >50% of income on rent) — very limited rent-growth headroom before tenants either downsize or default.
Forward outlook
- Local home prices are declining (-3.0%/yr); year-one equity from $1k of loan paydown is wiped out by about $6k of value loss. Plan a longer hold.
- Saratoga County population projected at +4% by 2050 — modest demand growth; plan on rents tracking national, not racing it.
- At projected returns (-3.0% appreciation + 3.0% rent growth), your $56k cash investment doubles in ~6 years — after that, you're playing with house money.
Negotiation context
- Only 6 days on market — expect competitive offers; lowballing is unlikely to land.
- 3 sale attempts since 20y ago with the ask held roughly flat each time — persistent listings suggest the price (not the market) is what's stuck; bring a comps-based counter.
- Current owner paid $170k; 18% above their basis — modest negotiation headroom, anchor on the comps not their cost.
Risks & watch-outs
- Watch-outs: property tax is 2.6% of price; flood insurance adds $460/mo; built in 1900 — expect roof / HVAC / electrical / plumbing capex.
- Climate carrying-cost: in FEMA flood zone AE (mandatory federal flood insurance) — expect insurance premiums to compound above CPI over the hold.
Questions for the listing agent
- Can we see the unit-by-unit rent roll, current vacancy, and any below-market leases? What's the average tenancy length?
- What capital expenditures (roof, boiler, parking lot, exteriors) have been made in the last 5 years, and what's planned in the next 2?
- Built in 1900 — when were the roof, HVAC, electrical panel, plumbing, and water heater last replaced?
- Property tax is high relative to price — has the assessment been appealed recently, and will the sale trigger a re-assessment?
- What's the actual annual flood-insurance premium (NFIP or private), and is the property in a SFHA with mandatory coverage?
- Is there a deadline driving the sale (1031 exchange, divorce, estate, relocation)? That informs how much negotiation room exists.
- What's the average days-on-market for RENTAL listings here right now (not sales)? A rising rental-DOM trend means longer vacancies and softer asking-rent achievability than the comps imply.
- What's the recent tenant-quality profile in this submarket — average credit score on applications, eviction rate, late-payment / NSF rate, and stable-employment percentage? A property-management company in the area should have these aggregated.
- How much new apartment / multifamily construction is in the pipeline within 1–3 miles? Heavy new supply (>2% of stock underway) typically softens rents 12–24 months out; light construction supports rent growth.
Investment metrics
- 1% rule
- 1.98% ✓
- Cap rate
- 15.70%
- Cash-on-cash
- 33.58%
- DSCR
- 2.49
- GRM
- 4.2
CMA / ARV
- ARV (median comp)
- $422,360
- List price
- $199,900
- Delta
- -52.67%
- Verdict
- UNDERPRICED
- Comps
- 20 within 1.0 mi
Show comp detail 12 sales within ~0.75 mi
| Address | Dist | Beds/Ba | Sqft | Sold | Price | $/sf | Match |
|---|---|---|---|---|---|---|---|
| 28 Mohawk Ave | 0.00mi | 6/2.0 | 2,302 (0%) | 1mo | $170,000 | $74 | 100 |
| 811 1st Ave | 0.57mi | 6/2.0 | 2,288 (-1%) | 6mo | $268,000 | $117 | 67 |
| 3 9th St | 0.19mi | 5/2.0 (-1) | 2,624 (+14%) | 4mo | $263,200 | $100 | 60 |
| 15-17 4th St | 0.18mi | 5/3.0 (-1) | 2,548 (+11%) | 6mo | $354,000 | $139 | 60 |
| 797 1st Ave | 0.58mi | 5/3.0 (-1) | 2,336 (+2%) | 8mo | $425,000 | $182 | 55 |
| 12 Front St | 0.36mi | 6/3.5 | 2,414 (+5%) | 19mo | $258,000 | $107 | 53 |
| 109 Third St | 0.50mi | 6/2.0 | 2,548 (+11%) | 8mo | $290,000 | $114 | 53 |
| 41 Middle St | 0.22mi | 5/3.5 (-1) | 2,432 (+6%) | 23mo | $209,000 | $86 | 50 |
| 761 2nd Ave | 0.68mi | 6/2.0 | 2,544 (+10%) | 3mo | $165,000 | $65 | 48 |
| 798 1st Ave | 0.60mi | 6/2.0 | 2,112 (-8%) | 14mo | $120,000 | $57 | 46 |
| 108 1st Ave | 0.70mi | 5/2.0 (-1) | 2,496 (+8%) | 19mo | $240,000 | $96 | 32 |
| 838 2nd Ave | 0.64mi | 6/7.0 | 2,470 (+7%) | 11mo | $523,000 | $212 | 29 |
Match score weights: distance 35% · size 25% · config 20% · recency 20%. Top-matched comps best support the ARV.
Projected returns pro-forma
-3.0% appreciation · 3.0% rent growth · sell at horizon
- IRR
- 17.0%
- Equity multiple
- 1.69×
- Total profit
- $38,507
- Equity at exit
- $29,806
- IRR
- 25.6%
- Equity multiple
- 3.25×
- Total profit
- $126,085
- Equity at exit
- $17,284
Cash invested: $55,972 (down + closing). Projections, not guarantees.
Landlord ↔ Tenant lean methodology
- Overall (STATE)
- 15 Strongly Tenant-Friendly
- State New York
- 15 Strongly Tenant-Friendly · D+10
- County
- — inherits STATE
- City
- — inherits STATE
ZIP-level market 12188
- Home prices YoY
- -13.3%
- Active inventory
- 48
- Price-to-rent
- 8.4×
Monthly cashflow live
- Estimated rent
- $3,961 high interval (Pro) →
- Mortgage (P&I)
- −$1,048
- Tax from tax record
- −$431 /mo · $5,174/yr
- Insurance
- −$83
- Flood insurance flood zone
- −$460 /mo · $5,525/yr
- HOA
- −$0
- Vacancy / Maint / Mgmt
- −$832
- Net cashflow
- $1,106
Break-even live
Sensitivity live
| Price | -10% $1,219 | -5% $1,163 | +0% $1,106 | +5% $1,049 | +10% $993 |
|---|---|---|---|---|---|
| Rent | -10% $793 | -5% $950 | +0% $1,106 | +5% $1,263 | +10% $1,419 |
| Rate | -1.0pp $1,207 | -0.5pp $1,157 | base $1,106 | +0.5pp $1,054 | +1.0pp $1,002 |
2-unit breakdown (identical units grouped — click to expand)
| Units | Beds | Baths | Est. rent |
|---|---|---|---|
| 2× units | 3 | 1 | $3,962 |
| #1 | 3 | 1 | $1,981 |
| #2 | 3 | 1 | $1,981 |
| Total (2 units) | $3,961 | ||
UW: 25.0% down · 7.5% · 30yr · 1.5% tax · 5.0% vac · 8.0% maint · 8.0% mgmt
Financing live
Cash to close
- Down payment
- $49,975
- Closing costs
- $5,997
- Reserves months
- —
- Total cash needed
- —
Loan-product check · same deal, 3 products live
Conventional
25% down · 7.5% · 30yr
- Down + closing
- —
- Monthly P&I
- —
- Monthly cashflow
- —
- DSCR
- —
- Eligible?
- —
Personal DTI + credit; lowest rate.
DSCR
20% down · 8.5% · 30yr
- Down + closing
- —
- Monthly P&I
- —
- Monthly cashflow
- —
- DSCR
- —
- Eligible?
- —
No personal income docs; deal must DSCR.
Hard money
10% down · 12.0% · 12mo
- Down + closing
- —
- Monthly P&I
- —
- Monthly cashflow
- —
- DSCR
- —
- Eligible?
- —
Short-term bridge; refi at stabilization.
Listing history 10 events
-
2026-05-04status Pending 255-char remark
-
2026-04-28$199,900 Active 255-char remark
-
2012-11-05soldstatus $141,500
-
2012-10-25soldstatus $141,500 270-char remark
Show marketing remark (270 chars)
Completely remodeled after Irene!! Great 2 Family Home. Low Taxes-Great Investment Opportunity. Tenants paying 1,700 a month. Second floor could easily pay more rent. New roof in 2006, Carport, shed, entire yard is fenced in. Conv. to I787/I90/I87. Excellent Condition
-
2012-04-24historical 270-char remark
Show marketing remark (270 chars)
Completely remodeled after Irene!! Great 2 Family Home. Low Taxes-Great Investment Opportunity. Tenants paying 1,700 a month. Second floor could easily pay more rent. New roof in 2006, Carport, shed, entire yard is fenced in. Conv. to I787/I90/I87. Excellent Condition
-
2011-05-31$144,900 270-char remark
Show marketing remark (270 chars)
Completely remodeled after Irene!! Great 2 Family Home. Low Taxes-Great Investment Opportunity. Tenants paying 1,700 a month. Second floor could easily pay more rent. New roof in 2006, Carport, shed, entire yard is fenced in. Conv. to I787/I90/I87. Excellent Condition
-
2006-08-09soldstatus $80,000
-
2006-07-21soldstatus $80,000
Show marketing remark (261 chars)
Nice investment - owner live in and have tenant help pay the mortgage - income of $500. 1st flr $450. 2nd flr needs work and new roof. View of the Mohawk River - near the Waterford Locks, visitors center. A good place to invest. Sold As Is. Very Good Condition
-
2006-06-23historical
Show marketing remark (261 chars)
Nice investment - owner live in and have tenant help pay the mortgage - income of $500. 1st flr $450. 2nd flr needs work and new roof. View of the Mohawk River - near the Waterford Locks, visitors center. A good place to invest. Sold As Is. Very Good Condition
-
2006-05-20$79,900
Show marketing remark (261 chars)
Nice investment - owner live in and have tenant help pay the mortgage - income of $500. 1st flr $450. 2nd flr needs work and new roof. View of the Mohawk River - near the Waterford Locks, visitors center. A good place to invest. Sold As Is. Very Good Condition
ⓘ Source: listings_history table (triggers on properties + properties_extension) + one-shot
backfill from property_details.listing_events for pre-trigger history.
Tax reassessment forecast NY · Partial reset (capped growth)
- Current annual tax
- $5,174 · $431/mo
- Projected year-2 tax
- $5,174 · $431/mo
- Expected delta
- $0/yr ($0/mo · 0.0%)
ⓘ Screening estimate from a state-policy table — verify with the county assessor before closing.
Climate risk First Street
- Flood 10/10 Extreme FEMA zone AE · 99% chance over 30 yrs
- Wildfire 2/10 Low
- Heat 4/10 Moderate 7 d/yr ≥98°F today · 17 d/yr by 30 yrs out
- Wind 3/10 Moderate 6% chance of damaging wind over 30 yrs
- Air quality 2/10 Low 0 unhealthy d/yr today · 1 by 30 yrs out
Nearby sold comps map
Loading sold comps map…
Walkable amenities ~0.75 mi
Loading nearby amenities…
Taxation est. · year 1
- Rental income
- $47,532
- − Mortgage interest
- −$11,198
- − Property taxes
- −$5,174
- − Insurance
- −$6,524
- − Repairs & maintenance
- −$3,803
- − Management
- −$3,803
- − Depreciation
- −$5,815
- Taxable income
- $11,216
- Est. tax owed @ 24.0%
- −$2,692
- After-tax cash flow
- $10,581/yr
For passive investors: Depreciation is non-cash, so a rental often shows a tax loss while cash-flowing — sheltering income. Rental losses are passive: they offset passive income freely, and up to $25,000/yr can offset ordinary (W-2) income if you actively participate and your MAGI is under $100k (phasing out to $0 by $150k); unused losses carry forward. On sale, claimed depreciation is recaptured at up to 25%, and gains may owe capital-gains tax (a 1031 exchange can defer both). Figures are a year-1 estimate at your 24.0% rate — not tax advice; consult a CPA.
Schools (NCES district)
- District
- Waterford-Halfmoon Union Free School District
- NCES district ID
- 3630060
- Math proficiency
- 60% ▲ 3.00%
- Reading proficiency
- 54% ▲ 2.00%
- Median HH income
- $53,359
- Composite
- 50.65/100
- National rank
- #3943
- State rank
- #322 of 755 in NY
Livability — Waterford
- Score
- 74/100
- State rank
- #285
- US rank
- #4586
Category grades
Schools grade is shown separately in the Schools card above.
Census & demographics
- County
- Saratoga County · 166,192 people
- City population
- 10,988
- Metro
- Albany-Schenectady-Troy, NY
- Population (ZIP)
- 10,988
- Household income
- $92,279
- Rent vs Own
- Severe rent burden
- 129.0
Population outlook (Saratoga County) Hauer SSP2
- Today (2025)
- 238,889 people
- By 2030
- 243,681 · +2.0%
- By 2040
- 249,118 · +4.3%
- By 2050
- 248,638 · +4.1%
- By 2075
- 241,675 · +1.2%
- By 2100
- 213,150 · -10.8%
Race, ethnicity, and origin ACS 2023
- Neighborhood character
- Predominantly White (88%)
- Race & ethnicity
- White 88% Hispanic / Latino 4% Two or more races 4% Black 3% Native American 2% Asian 1%
- Common ancestry
- Lithuanian 8% Romanian 4% German 2%
- Foreign-born
- 5% · Canada
- Languages at home
- 94% English-only · French/Haitian/Cajun 2% Other Indo-European 2% Spanish 1%
Political lean MEDSL · Saratoga
- 2024 margin
- Toss-up / Even · D 50.9% · R 49.1%
- 2008→2024 swing
- -1.6pp toward R · 2008: 3.4pp · 2024: 1.8pp
- All cycles
- 2024: D+1.8 2020: D+5.4 2016: R+4.4 2012: D+2.1 2008: D+3.4
Not yet ingested
- Civics
- —
Market trends
- HPI YoY
- ▼ -48.55%
- Current HPI
- 316.5619
- Rent YoY
- —
- Metro
- Albany-Schenectady-Troy, NY
- State GDP YoY
- ▲ 2.60%
- F500 in state
- 92
Industry mix (Fortune 500 HQ in NY)
| Industry | F500 HQs | Revenue |
|---|---|---|
| Financial Services | 10 | $950B |
|
||
| Consumer Goods | 9 | $162B |
|
||
| Insurance | 4 | $225B |
|
||
| Telecommunications | 2 | $144B |
|
||
| Pharmaceuticals | 2 | $112B |
|
||
| Media / Entertainment | 2 | $69B |
|
||
Price history
+112.8% since first listed11 events — show timeline
- 2026-06-04 Sold (MLS) $170,000 Global MLS
- 2026-05-04 Pending — Global MLS
- 2026-04-28 Listed $199,900 Global MLS
- 2012-11-05 Sold (Public Records) $141,500 Public Records
- 2012-10-25 Sold (MLS) $141,500 Global MLS
- 2012-04-24 Listing Removed — Global MLS
- 2011-05-31 Listed $144,900 Global MLS
- 2006-08-09 Sold (Public Records) $80,000 Public Records
- 2006-07-21 Sold (MLS) $80,000 Global MLS
- 2006-06-23 Listing Removed — Global MLS
- 2006-05-20 Listed $79,900 Global MLS
Property tax history
+6.6%/yrLatest (2025): $5,174 · +2.2% YoY. Source: county tax records.
Cash-flow waterfall
monthlySold comps — $/sqft
last 12 mo · ≤1 miLoading sold comps…