 🌊 Lakefront
13360 Southampton Dr · Bonita Springs, FL
Flood risk 1/10 · Minimal
- FEMA flood zone
- X (unshaded)
- Chance of flooding over 30 yrs
- 0.0%
- Est. flood insurance / yr
- $507 – $1,088
Fire risk 4/10 · Minor
- Est. fire insurance / yr
- $947 – $1,759
Heat risk 10/10 · Severe
- Hot days now (above 107°F)
- 7 days/yr
- Hot days in 30 yrs
- 31 days/yr
Wind risk 10/10 · Severe
- Chance of severe wind over 30 yrs
- 99.0%
Air-quality risk 2/10 · Minimal
- Unhealthy air days now
- 2 days/yr
- Unhealthy air days in 30 yrs
- 2 days/yr
Risk factors via First Street. Map © Google.
Why this score? — see what drove the D+ grade
The composite is a weighted blend of 9 inputs, each scored 0–100. Each bar is that input's sub-score; the figure is the points it added to the 100-point composite (weight × sub-score).
- ARV discount +15.0/15.0
- Cash flow +11.6/30.0
- 1% rule +6.4/10.0
- Schools +4.1/10.0
- Livability +3.5/5.0
- DSCR +3.4/10.0
- Condition / age +2.5/5.0
- Rent growth +2.3/5.0
- Appreciation +0.0/10.0
$495,000
🖨 Deal sheet (PDF) 📄 Offer letter ✓ Due diligence
Listing remarks
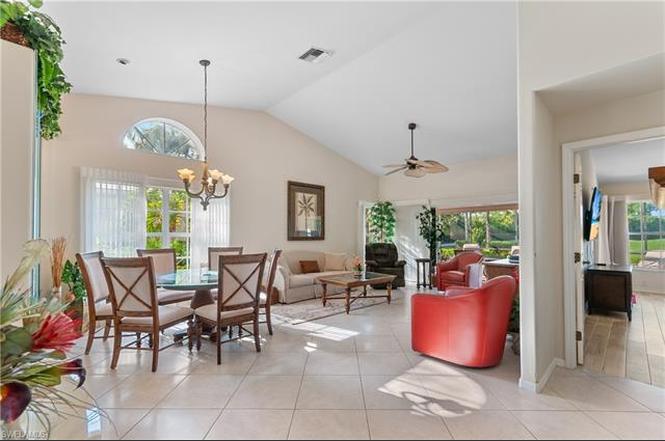
EXQUISITE LAKE AND GOLF COURSE VIEW RESIDENCE: Discover this meticulously maintained home nestled on a premium lot boasting a rare southwest exposure, offering breathtaking vistas of the serene lake and lush golf course. This versatile property features 3 bedrooms (or 2 bedrooms plus a den), 2 bathrooms, and 1,626 square feet of air-conditioned living space, designed for both comfort and elegance. Upon entering through the front door, you're immediately captivated by the panoramic lake and golf course views that flood the interior with natural light. The open and inviting floor plan is enhanced by soaring vaulted ceilings, beautiful tile flooring throughout the main areas, and warm wood-gr
Key facts
- Spacious kitchen
- Panoramic views
- Premium lot
Tags
Property features AI
Finance
- Other: Part of a larger community with 799 units; Subdivision: Worthington (Villas)
- Financial info: Taxes listed separately
- HOA & community: Mandatory HOA; Monthly master HOA fee of $1,088; Monthly HOA fee of $249; HOA covers golf course, internet/Wi‑Fi, lawn and landscape maintenance, legal/accounting, manager, master antenna/satellite, reserves, security, and street lights; Community amenities include clubhouse, community pool and spa, exercise room, tennis and bocce courts, putting green, restaurant, cabana, business center, library, electric vehicle charging, private membership, underground utilities and streetlights; Community type: gated, golf course, tennis (golf bundled); On-site management; Total annual recurring HOA fees: $17,044; Total one-time fees: $12,500
Exterior
- Parking: Attached 2-car garage
- Security: Gated community; On-site management
- Utilities: Central water; Central sewer; Electric service (central)
- Home design: Single-family residence; One-story ranch; Built in 1992; Rear exposure faces southwest; Located on a golf course with lake view
- Construction: Concrete block construction; Tile roof; Concrete foundation
- Exterior features: Automatic sprinkler system; Screened lanai/porch; Shutters (electric); Single-hung and sliding windows; Stucco exterior; Below-ground concrete private spa (electric heated; equipment stays)
Interior
- Kitchen: Kitchen island; Dishwasher; Disposal; Microwave; Range; Refrigerator/ice maker
- Bedrooms: 3 bedrooms
- Flooring: Tile flooring
- Bathrooms: 2 full bathrooms; Master bath with dual sinks and separate tub and shower
- Heating & cooling: Central electric heat; Central electric air conditioning; Ceiling fans
- Interior features: Foyer; High-speed internet available; Pantry; Pull-down attic stairs; Smoke detectors; Volume ceilings; Walk-in closet; Window coverings; Great room floor plan; Split-bedroom layout; Partially furnished
- Laundry & utility: Washer; Dryer; Washer/Dryer hookup; Auto garage door opener
Neighborhood map
What this means for you Summary
Snapshot
- This is a 3-bed/2.0-bath single-family listed at $495k.
Deal economics
- At list price, monthly cash flow is $-151 ($-2k/yr) — negative.
- To cash-flow at today's rent, offer at most $468k (5.4% below list).
- Meets the 1% rule at list price ($6k rent vs $495k).
- Recommended offer: $436k (12.0% below list) — sets the bar for market timing.
- Cap rate 5.9% vs local median 1.7% in Bonita Springs — top-decile yield for the area; either an underpriced asset or a hidden risk that comps aren't pricing in. Stress-test before assuming the spread holds.
Location & tenants
- Location reads 70/100 on livability (#428 in FL) — a middle-class / working-renter tenant base. Strengths: crime A+, housing A+, employment A; Watch: cost of living C-, health & safety D, amenities F.
- Lee (suburban): math 47% / reading 50% proficiency, ranked #42 of 73 in FL (top 58%) — families likely to look elsewhere, expect single-tenant / working-renter base with shorter leases.
- Zoned schools: Pinewoods Elementary School (math 81% / reading 74%, grade A, #163 of 2,144 statewide, top 8%, 1,089 students, 25% FRL); Lexington Middle School (math 55% / reading 54%, grade B-, #183 of 571 statewide, top 34%, 1,138 students, 44% FRL); South Fort Myers High School (math 23% / reading 30%, grade F, #489 of 667 statewide, top 74%, 1,917 students, 50% FRL) — zoned schools average 39% FRL vs 57% district-wide (18 pts lower); this property's tenant base skews higher-income than the district average.
- Market conditions: Rents soft (-0.6%/yr); 843 active listings in the ZIP; 40 comparable units currently listed for rent nearby; rentals at typical pace (median 26d on market — plan ~3-4 weeks tenant-placement turnaround); solid renter incomes; 15,411 units permitted in Lee County in 2024 (4,686 in 5+ unit buildings).
- At $5,640/mo this rent would consume 74% of the median local household income ($91k/yr) (locally 976% of renters already pay >50% of income on rent) — very limited rent-growth headroom before tenants either downsize or default.
Forward outlook
- Local home prices are declining (-3.0%/yr); year-one equity from $3k of loan paydown is wiped out by about $15k of value loss. Plan a longer hold.
- Lee County population projected at +44% by 2050 — long-run rental-demand tailwind backs the buy-and-hold thesis.
Negotiation context
- It's been on market 159 days — a 12% lower offer ($436k) is reasonable based on typical stale-listing flexibility.
- 2 sale attempts since 8y ago; this cycle's ask has dropped $80k (14%) from the opening price — seller is motivated, your offer sets the floor, not the list.
- Current owner paid $355k; 39% above their basis — modest negotiation headroom, anchor on the comps not their cost.
Risks & watch-outs
- Watch-outs: HOA is 24% of rent.
- Climate carrying-cost: severe wind risk, 99% chance of damaging wind over 30y; extreme-heat days projected 7→31/yr by 2055 (HVAC capex compounding) — expect insurance premiums to compound above CPI over the hold.
Questions for the listing agent
- What do current leases actually rent for vs. the listed asking? Can we see a recent rent roll and the last 12 months of T-12 income?
- It's been on market 159 days. Have you received any prior offers? Is the seller open to a 12% concession, seller financing, or rate buy-down credit?
- What does the HOA fee cover, when was the last increase, and are there any pending special assessments or reserve-fund shortfalls?
- Why hasn't it sold? Are there any deal-killer items the seller is aware of (foundation, flood, title, zoning, code violations)?
- Is there a deadline driving the sale (1031 exchange, divorce, estate, relocation)? That informs how much negotiation room exists.
- The area grade is low — what's the realistic commute time and amenity access for the typical tenant pool here? Any planned neighborhood developments (good or bad) we should know about?
- This sits on a lake — are riparian / water-frontage rights deeded with the parcel? Any dock permits, shoreline easements, or HOA water-use restrictions?
- What's the documented flood / surge / shoreline-erosion history here (FEMA AND non-FEMA — e.g., storm surge, creek backup, septic-field saturation)?
- Any water-quality or seasonal algae-bloom issues that affect tenant satisfaction or short-term-rental demand?
- What's the average days-on-market for RENTAL listings here right now (not sales)? A rising rental-DOM trend means longer vacancies and softer asking-rent achievability than the comps imply.
- What's the recent tenant-quality profile in this submarket — average credit score on applications, eviction rate, late-payment / NSF rate, and stable-employment percentage? A property-management company in the area should have these aggregated.
- How much new for-sale + rental construction is in the pipeline within 1–3 miles? Heavy new supply typically softens prices + rents 12–24 months out; constrained supply supports both.
Investment metrics
- 1% rule
- 1.14% ✓
- Cap rate
- 5.93%
- Cash-on-cash
- -1.31%
- DSCR
- 0.94
- GRM
- 7.3
CMA / ARV
- ARV (on-the-fly)
- $774,870
- Comps found
- 3
Show comp detail 3 sales within ~0.75 mi
| Address | Dist | Beds/Ba | Sqft | Sold | Price | $/sf | Match |
|---|---|---|---|---|---|---|---|
| 13460 Bridgeford Ave | 0.10mi | 3/2.0 | 1,630 (+0%) | 23mo | $619,000 | $380 | 76 |
| 12658 Buttonbush Pl | 0.75mi | 3/2.0 | 1,758 (+8%) | 8mo | $620,000 | $353 | 45 |
| 12735 Maiden Cane Ln | 0.74mi | 3/2.0 | 1,493 (-8%) | 16mo | $420,000 | $281 | 39 |
Match score weights: distance 35% · size 25% · config 20% · recency 20%. Top-matched comps best support the ARV.
Projected returns pro-forma
-3.0% appreciation · 0.0% rent growth · sell at horizon
- IRR
- -23.0%
- Equity multiple
- 0.24×
- Total profit
- $-105,560
- Equity at exit
- $73,806
- IRR
- -34.4%
- Equity multiple
- -0.19×
- Total profit
- $-164,895
- Equity at exit
- $42,799
Cash invested: $138,600 (down + closing). Projections, not guarantees.
Landlord ↔ Tenant lean methodology
- Overall (STATE)
- 87 Strongly Landlord-Friendly
- State Florida
- 87 Strongly Landlord-Friendly · R+3
- County
- — inherits STATE
- City
- — inherits STATE
ZIP-level market 34135
- Rents YoY
- -0.6%
- Active inventory
- 843
- Price-to-rent
- 7.3×
Monthly cashflow live
- Estimated rent
- $5,640 high interval (Pro) →
- Mortgage (P&I)
- −$2,596
- Tax from tax record
- −$468 /mo · $5,613/yr
- Insurance
- −$206
- HOA
- −$1,337
- Vacancy / Maint / Mgmt
- −$1,184
- Net cashflow
- $-151
Break-even live
Sensitivity live
| Price | -10% $129 | -5% $-11 | +0% $-151 | +5% $-291 | +10% $-431 |
|---|---|---|---|---|---|
| Rent | -10% $-597 | -5% $-374 | +0% $-151 | +5% $72 | +10% $294 |
| Rate | -1.0pp $98 | -0.5pp $-25 | base $-151 | +0.5pp $-280 | +1.0pp $-410 |
UW: 25.0% down · 7.5% · 30yr · 1.5% tax · 5.0% vac · 8.0% maint · 8.0% mgmt
Financing live
Cash to close
- Down payment
- $123,750
- Closing costs
- $14,850
- Reserves months
- —
- Total cash needed
- —
Loan-product check · same deal, 3 products live
Conventional
25% down · 7.5% · 30yr
- Down + closing
- —
- Monthly P&I
- —
- Monthly cashflow
- —
- DSCR
- —
- Eligible?
- —
Personal DTI + credit; lowest rate.
DSCR
20% down · 8.5% · 30yr
- Down + closing
- —
- Monthly P&I
- —
- Monthly cashflow
- —
- DSCR
- —
- Eligible?
- —
No personal income docs; deal must DSCR.
Hard money
10% down · 12.0% · 12mo
- Down + closing
- —
- Monthly P&I
- —
- Monthly cashflow
- —
- DSCR
- —
- Eligible?
- —
Short-term bridge; refi at stabilization.
Rent comps 40 comps
| Address | Beds | Baths | Sqft | Rent | $/sqft | DOM | Units | Dist |
|---|---|---|---|---|---|---|---|---|
| 13270 Sherburne Cir #2903 Bonita Springs, FL | 2.0 | 2.0 | 1487 | $6,000 | $4.03 | 25d | 1 | 0.19mi |
| 13260 Sherburne Cir #2704 Bonita Springs, FL | 2.0 | 2.0 | 1446 | $6,500 | $4.50 | 23d | 1 | 0.22mi |
| 13256 Sherburne Cir #2603 Bonita Springs, FL | 3.0 | 2.0 | 1576 | $6,500 | $4.12 | 25d | 1 | 0.24mi |
| 13520 Southampton Dr Bonita Springs, FL | 3.0 | 2.0 | 1642 | $8,000 | $4.87 | 25d | 1 | 0.27mi |
| 13070 Amberley Ct #902 Bonita Springs, FL | 2.0 | 2.0 | 1076 | $5,800 | $5.39 | 25d | 1 | 0.28mi |
| 13060 Amberley Ct #809 Bonita Springs, FL | 2.0 | 2.0 | 1204 | $5,500 | $4.57 | 25d | 1 | 0.32mi |
| 13231 Sherburne Cir #1504 Bonita Springs, FL | 2.0 | 2.0 | 1446 | $6,500 | $4.50 | 25d | 1 | 0.34mi |
| 13611 Worthington Way #1312 Bonita Springs, FL | 3.0 | 2.0 | 1312 | $5,500 | $4.19 | 25d | 1 | 0.34mi |
| 13050 Amberley Ct #708 Bonita Springs, FL | 2.0 | 2.0 | 1204 | $5,500 | $4.57 | 25d | 1 | 0.35mi |
| 13046 Amberley Ct Unit 602RA Bonita Springs, FL | 2.0 | 2.0 | 1076 | $2,000 | $1.86 | 25d | 1 | 0.40mi |
| 13046 Amberley Ct Unit 602R Bonita Springs, FL | 2.0 | 2.0 | 1076 | $5,500 | $5.11 | 25d | 1 | 0.40mi |
| 13962 Southampton Dr #4404 Bonita Springs, FL | 2.0 | 2.0 | 1446 | $6,500 | $4.50 | 25d | 1 | 0.40mi |
| 13641 Worthington Way Bonita Springs, FL | 2.0 | 2.0 | 1140 | $4,000 | $3.51 | 5d | 2 | 0.40mi |
| 13641 Worthington Way Bonita Springs, FL | 2.0 | 2.0 | 1140 | $4,150 | $3.64 | 17d | 2 | 0.40mi |
| 13641 Worthington Way #1610 Bonita Springs, FL | 2.0 | 2.0 | 1204 | $5,799 | $4.82 | 23d | 1 | 0.40mi |
| 13080 Bridgeford Ave Bonita Springs, FL | 2.0 | 2.0 | 1882 | $9,000 | $4.78 | 16d | 1 | 0.45mi |
| 28076 Cavendish Ct #2101 Bonita Springs, FL | 3.0 | 2.0 | 1222 | $6,250 | $5.11 | 25d | 1 | 0.56mi |
| 28068 Cavendish Ct #2301 Bonita Springs, FL | 3.0 | 2.0 | 1222 | $6,000 | $4.91 | 15d | 1 | 0.58mi |
| 28068 Cavendish Ct #2310 Bonita Springs, FL | 2.0 | 2.0 | 1339 | $5,500 | $4.11 | 25d | 1 | 0.58mi |
| 28064 Cavendish Ct #2404 Bonita Springs, FL | 2.0 | 2.0 | 1076 | $5,300 | $4.93 | 25d | 1 | 0.61mi |
| 28048 Cavendish Ct #5904 Bonita Springs, FL | 2.0 | 2.0 | 1446 | $6,500 | $4.50 | 23d | 1 | 0.62mi |
| 27906 Radiant Ct Bonita Springs, FL | 3.0 | 2.5 | 1638 | $2,650 | $1.62 | 15d | 1 | 0.62mi |
| 27906 Radiant Ct Bonita Springs, FL | 3.0 | 2.5 | 1637 | $2,650 | $1.62 | 5d | 1 | 0.62mi |
| 27906 Radiant Ct Bonita Springs, FL | 3.0 | 2.5 | 1638 | $2,650 | $1.62 | 16d | 1 | 0.62mi |
| 27874 Radiant Ct Bonita Springs, FL | 3.0 | 2.5 | 1657 | $2,790 | $1.68 | 3d | 1 | 0.66mi |
| 27874 Radiant Ct Bonita Springs, FL | 3.0 | 2.5 | 1657 | $2,950 | $1.78 | 23d | 1 | 0.66mi |
| 28536 F B Fowler Ct Bonita Springs, FL | 3.0 | 2.0 | 1765 | $6,500 | $3.68 | 25d | 1 | 0.69mi |
| 28648 San Lucas Ln #102 Bonita Springs, FL | 2.0 | 2.0 | 1940 | $8,000 | $4.12 | 25d | 1 | 0.76mi |
| 27825 Solis Grande Dr Bonita Springs, FL | 3.0 | 2.5 | 1831 | $2,500 | $1.37 | 25d | 1 | 0.77mi |
| 12607 Fox Ridge Dr #4102 Bonita Springs, FL | 2.0 | 2.0 | 1357 | $2,000 | $1.47 | 25d | 1 | 0.81mi |
| 12606 Fox Ridge Dr #7202 Bonita Springs, FL | 3.0 | 3.0 | 1743 | $2,400 | $1.38 | 25d | 1 | 0.81mi |
| 12622 Hunters Ridge Dr Bonita Springs, FL | 3.0 | 2.0 | 1787 | $7,500 | $4.20 | 5d | 1 | 0.83mi |
| 14099 Tivoli Ter Bonita Springs, FL | 3.0 | 2.0 | 2205 | $3,500 | $1.59 | 15d | 1 | 0.87mi |
| 12770 Bonita Vista Pl Bonita Springs, FL | 1.0–3.0 | 1.0–2.0 | 1116 | $3,454 | $3.09 | 3d | 70 | 0.92mi |
| 28008 Sosta Ln #4 Bonita Springs, FL | 3.0 | 2.0 | 1541 | $6,000 | $3.89 | 25d | 1 | 1.18mi |
| 12080 Matera Ln #204 Bonita Springs, FL | 2.0 | 2.0 | 1467 | $7,500 | $5.11 | 17d | 1 | 1.20mi |
| 28576 Alessandria Cir Bonita Springs, FL | 3.0 | 3.0 | 1868 | $2,595 | $1.39 | 21d | 1 | 1.28mi |
| 12040 Matera Ln #104 Bonita Springs, FL | 2.0 | 2.0 | 1467 | $7,500 | $5.11 | 16d | 1 | 1.30mi |
| 28086 Sosta Ln #1 Bonita Springs, FL | 2.0 | 2.0 | 1402 | $2,300 | $1.64 | 5d | 1 | 1.31mi |
| 12015 Matera Ln #102 Bonita Springs, FL | 3.0 | 2.0 | 1467 | $7,500 | $5.11 | 25d | 1 | 1.37mi |
HOA detail
- Monthly dues
- $1,337 · $16,044/yr
Listing history 21 events
-
2026-06-22days on market $495,000 Active 159 DOM
-
2026-06-17days on market $495,000 Active 155 DOM
-
2026-06-16days on market $495,000 Active 154 DOM
-
2026-06-15days on market $495,000 Active 153 DOM
-
2026-06-13days on market $495,000 Active 151 DOM
-
2026-06-10days on market $495,000 Active 148 DOM
-
2026-06-09days on market $495,000 Active 147 DOM
-
2026-06-07days on market $495,000 Active 145 DOM
-
2026-06-02days on market $495,000 Active 140 DOM
-
2026-06-01days on market $495,000 Active 139 DOM
-
2026-06-01days on market $495,000 Active 138 DOM
-
2026-05-24price $520,000
-
2026-03-11price $530,000
-
2026-01-14$575,000 Active
-
2020-10-28soldstatus $355,000
-
2020-06-04price $369,900
-
2018-07-01historical
-
2018-01-12$399,000 Active
-
2005-08-12soldstatus $400,000
-
2002-07-05soldstatus $195,000
-
1998-08-24soldstatus $175,000
ⓘ Source: listings_history table (triggers on properties + properties_extension) + one-shot
backfill from property_details.listing_events for pre-trigger history.
Tax reassessment forecast FL · Resets to sale price
- Current annual tax
- $5,613 · $468/mo
- Projected year-2 tax
- $5,613 · $468/mo
- Expected delta
- $0/yr ($0/mo · 0.0%)
ⓘ Screening estimate from a state-policy table — verify with the county assessor before closing.
Climate risk First Street
- Flood 1/10 Low FEMA zone X (unshaded) · 0% chance over 30 yrs
- Wildfire 4/10 Moderate
- Heat 10/10 Extreme 7 d/yr ≥107°F today · 31 d/yr by 30 yrs out
- Wind 10/10 Extreme 99% chance of damaging wind over 30 yrs
- Air quality 2/10 Low 2 unhealthy d/yr today · 2 by 30 yrs out
Nearby sold comps map
Loading sold comps map…
Walkable amenities ~0.75 mi
Loading nearby amenities…
Taxation est. · year 1
- Rental income
- $67,680
- − Mortgage interest
- −$27,728
- − Property taxes
- −$5,613
- − Insurance
- −$2,475
- − Repairs & maintenance
- −$5,414
- − Management
- −$5,414
- − HOA
- −$16,044
- − Depreciation
- −$14,400
- Taxable loss
- −$9,409
- Est. tax savings @ 24.0%
- +$2,258
- After-tax cash flow
- $443/yr
For passive investors: Depreciation is non-cash, so a rental often shows a tax loss while cash-flowing — sheltering income. Rental losses are passive: they offset passive income freely, and up to $25,000/yr can offset ordinary (W-2) income if you actively participate and your MAGI is under $100k (phasing out to $0 by $150k); unused losses carry forward. On sale, claimed depreciation is recaptured at up to 25%, and gains may owe capital-gains tax (a 1031 exchange can defer both). Figures are a year-1 estimate at your 24.0% rate — not tax advice; consult a CPA.
Schools (NCES district)
- District
- Lee
- NCES district ID
- 1201080
- Math proficiency
- 47% ▼ -11.00%
- Reading proficiency
- 50% ▼ -4.00%
- Median HH income
- $49,518
- Composite
- 41.49/100
- National rank
- #3458
- State rank
- #42 of 73 in FL
Livability — Bonita Springs
- Score
- 70/100
- State rank
- #428
- US rank
- #7576
Category grades
Schools grade is shown separately in the Schools card above.
Census & demographics
- Census place
- Bonita Springs, FL
- County
- Lee County · 788,662 people
- City population
- 64,727
- Metro
- Cape Coral-Fort Myers, FL
- Population (ZIP)
- 48,252
- Household income
- $91,380
- Rent vs Own
- Severe rent burden
- 976.0
Population outlook (Lee County) Hauer SSP2
- Today (2025)
- 871,946 people
- By 2030
- 955,468 · +9.6%
- By 2040
- 1,113,587 · +27.7%
- By 2050
- 1,256,891 · +44.1%
- By 2075
- 1,560,270 · +78.9%
- By 2100
- 1,726,848 · +98.0%
Race, ethnicity, and origin ACS 2023
- Neighborhood character
- Predominantly White (69%)
- Race & ethnicity
- White 69% Hispanic / Latino 26% Two or more races 13% Native American 3% Black 2%
- Hispanic origin (detail)
- Mexican 8% Puerto Rican 4% Cuban 3%
- Common ancestry
- Romanian 5% Lithuanian 2% Slovak 2%
- Foreign-born
- 22% · Canada, Jamaica
- Languages at home
- 74% English-only · Spanish 21% French/Haitian/Cajun 1% Russian/Polish/Slavic 1%
Political lean MEDSL · Lee
- 2024 margin
- Strong R (+28.4) · D 35.5% · R 63.9%
- 2008→2024 swing
- -18.0pp toward R · 2008: -10.4pp · 2024: -28.4pp
- All cycles
- 2024: R+28.4 2020: R+19.2 2016: R+20.4 2012: R+16.6 2008: R+10.4
Not yet ingested
- Civics
- —
Market trends
- HPI YoY
- ▼ -188.86%
- Current HPI
- 243.4153
- Rent YoY
- ▼ -0.61%
- Metro
- Cape Coral-Fort Myers, FL
- State GDP YoY
- ▲ 3.28%
- F500 in state
- 36
Industry mix (Fortune 500 HQ in FL)
| Industry | F500 HQs | Revenue |
|---|---|---|
| Industrial Technology | 2 | $29B |
|
||
| Insurance | 2 | $17B |
|
||
| Retail | 1 | $60B |
|
||
| Technology Distribution | 1 | $58B |
|
||
| Homebuilding | 1 | $35B |
|
||
| Technology Manufacturing | 1 | $35B |
|
||
Price history
+197.1% since first listed10 events — show timeline
- 2026-05-24 Price Changed $520,000 BEARMLS
- 2026-03-11 Price Changed $530,000 BEARMLS
- 2026-01-14 Listed $575,000 BEARMLS
- 2020-10-28 Sold (Public Records) $355,000 Public Records
- 2020-06-04 Price Changed $369,900 BEARMLS
- 2018-07-01 Listing Removed — NAPLESMLS
- 2018-01-12 Listed $399,000 NAPLESMLS
- 2005-08-12 Sold (Public Records) $400,000 Public Records
- 2002-07-05 Sold (Public Records) $195,000 Public Records
- 1998-08-24 Sold (Public Records) $175,000 Public Records
Property tax history
+3.5%/yrLatest (2025): $5,613 · +6.1% YoY. Source: county tax records.
Cash-flow waterfall
monthlySold comps — $/sqft
last 12 mo · ≤1 miLoading sold comps…