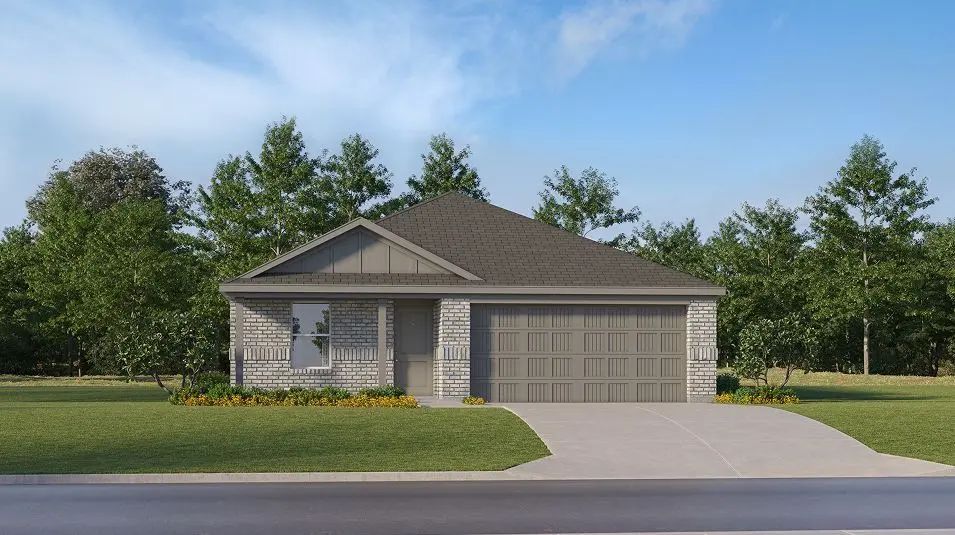
403 Monarch Trl · Huntsville, TX
Flood risk No data
- FEMA flood zone
- —
- Chance of flooding over 30 yrs
- —
- Est. flood insurance / yr
- —
Fire risk No data
- Est. fire insurance / yr
- —
Heat risk No data
- Hot days now (above threshold)
- —
- Hot days in 30 yrs
- —
Wind risk No data
- Chance of severe wind over 30 yrs
- —
Air-quality risk No data
- Unhealthy air days now
- —
- Unhealthy air days in 30 yrs
- —
Risk factors via First Street. Map © Google.
Why this score? — see what drove the D grade
The composite is a weighted blend of 9 inputs, each scored 0–100. Each bar is that input's sub-score; the figure is the points it added to the 100-point composite (weight × sub-score).
- Cash flow +12.3/30.0
- ARV discount +10.9/15.0
- Condition / age +4.0/5.0
- DSCR +3.7/10.0
- 1% rule +3.5/10.0
- Rent growth +3.2/5.0
- Livability +3.2/5.0
- Schools +2.6/10.0
- Appreciation +0.0/10.0
$225,490
🖨 Deal sheet 📄 Offer letter ✓ Due diligence
Listing remarks
This single-level home showcases a spacious open floorplan shared between the kitchen, dining area and family room for easy entertaining. An owner's suite enjoys a private location in a rear corner of the home, complemented by an en-suite bathroom and walk-in closet. There are three secondary bedrooms at the front of the home, which are comfortable spaces for household members and overnight guests.
Key facts
- Walk-in closet
- Open floorplan
- En-suite bathroom
Tags
Property features AI
Finance
- Financial info: List price $225,490
Exterior
- Parking: 2 total parking spaces; 2-car garage
- Home design: Single-family home; Oxford plan
- Exterior features: 1,716 living area
Interior
- Bedrooms: 4 bedrooms
- Bathrooms: 2 full bathrooms
- Interior features: Spec new construction (Oxford plan)
Neighborhood map
What this means for you Summary
Snapshot
- This is a 4-bed/2.0-bath single-family listed at $225k. Condition is rated good.
Deal economics
- At list price, monthly cash flow is $-41 ($-492/yr) — negative.
- To cash-flow at today's rent, offer at most $220k (2.6% below list).
- To meet the 1% rule (rent ≥ 1% of price), the offer needs to be $192k (14.8% below list).
- Recommended offer: $192k (14.8% below list) — sets the bar for 1% rule.
- Cap rate 6.1% vs local median 2.6% in Huntsville — top-decile yield for the area; either an underpriced asset or a hidden risk that comps aren't pricing in. Stress-test before assuming the spread holds.
Location & tenants
- Location reads 63/100 on livability (#825 in TX) — a middle-class / working-renter tenant base. Strengths: cost of living A+; Watch: amenities C-, schools D-, crime D-.
- Huntsville ISD (town): math 25% / reading 37% proficiency, ranked #621 of 826 in TX (top 75%) — families likely to look elsewhere, expect single-tenant / working-renter base with shorter leases.
- Market conditions: Rents rising (+2.9%/yr); 518 active listings in the ZIP; 3 comparable units currently listed for rent nearby; rentals lingering (median 44d on market — plan ~5-8 weeks vacancy on turnover, expect pricing pressure); 100% of comp listings sitting > 30 days — soft ceiling on asking rent; 527 units permitted in Walker County in 2024 (0 in 5+ unit buildings).
- This rent runs 41% of the median local income ($56k/yr) — at the standard rent-burdened threshold; future hikes will face affordability resistance.
Forward outlook
- Local home prices are declining (-3.0%/yr); year-one equity from $2k of loan paydown is wiped out by about $7k of value loss. Plan a longer hold.
- Walker County population projected at +29% by 2050 — long-run rental-demand tailwind backs the buy-and-hold thesis.
Negotiation context
- Only 4 days on market — expect competitive offers; lowballing is unlikely to land.
Questions for the listing agent
- What do current leases actually rent for vs. the listed asking? Can we see a recent rent roll and the last 12 months of T-12 income?
- Is there a deadline driving the sale (1031 exchange, divorce, estate, relocation)? That informs how much negotiation room exists.
- Schools are D-rated, which usually means shorter tenancies and higher turnover. Who's the typical renter profile here, and what's been the actual vacancy rate?
- Crime grade is D in this area — have there been break-ins, vandalism, or insurance claims at this property in the last 3 years? What carrier currently insures it and at what premium?
- The area grade is low — what's the realistic commute time and amenity access for the typical tenant pool here? Any planned neighborhood developments (good or bad) we should know about?
- What's the average days-on-market for RENTAL listings here right now (not sales)? A rising rental-DOM trend means longer vacancies and softer asking-rent achievability than the comps imply.
- What's the recent tenant-quality profile in this submarket — average credit score on applications, eviction rate, late-payment / NSF rate, and stable-employment percentage? A property-management company in the area should have these aggregated.
- How much new for-sale + rental construction is in the pipeline within 1–3 miles? Heavy new supply typically softens prices + rents 12–24 months out; constrained supply supports both.
Investment metrics
- 1% rule
- 0.85% ✗
- Cap rate
- 6.07%
- Cash-on-cash
- -0.78%
- DSCR
- 0.97
- GRM
- 9.8
CMA / ARV
- ARV (on-the-fly)
- $243,672
- Comps found
- 12
Show comp detail 12 sales within ~0.75 mi
| Address | Dist | Beds/Ba | Sqft | Sold | Price | $/sf | Match |
|---|---|---|---|---|---|---|---|
| 606 Monarch Trl | 0.15mi | 4/2.0 | 1,716 (0%) | 1mo | $263,990 | $154 | 92 |
| 410 Monarch Trl | 0.04mi | 4/2.0 | 1,751 (+2%) | 3mo | $239,000 | $136 | 92 |
| 218 Lantana Ln | 0.09mi | 4/2.0 | 1,676 (-2%) | 1mo | $261,990 | $156 | 91 |
| 417 Monarch Trl | 0.07mi | 4/2.0 | 1,749 (+2%) | 3mo | $249,080 | $142 | 91 |
| 511 Monarch Trl | 0.13mi | 4/2.0 | 1,751 (+2%) | 5mo | $237,330 | $136 | 87 |
| 102 Lantana Ln | 0.21mi | 4/2.0 | 1,751 (+2%) | 1mo | $239,999 | $137 | 86 |
| 518 Monarch Trl | 0.17mi | 4/2.0 | 1,749 (+2%) | 5mo | $234,999 | $134 | 85 |
| 432 Monarch Trl | 0.18mi | 4/2.0 | 1,749 (+2%) | 5mo | $235,840 | $135 | 84 |
| 412 Monarch Trl | 0.05mi | 3/2.0 (-1) | 1,602 (-7%) | 1mo | $237,630 | $148 | 81 |
| 508 Monarch Trl | 0.15mi | 3/2.0 (-1) | 1,602 (-7%) | 3mo | $209,000 | $130 | 74 |
| 220 Lantana Ln | 0.08mi | 4/2.5 | 1,922 (+12%) | 1mo | $285,990 | $149 | 74 |
| 421 Monarch Trl | 0.18mi | 3/2.0 (-1) | 1,602 (-7%) | 5mo | $230,000 | $144 | 71 |
Match score weights: distance 35% · size 25% · config 20% · recency 20%. Top-matched comps best support the ARV.
Projected returns pro-forma
-3.0% appreciation · 2.89% rent growth · sell at horizon
- IRR
- -17.7%
- Equity multiple
- 0.38×
- Total profit
- $-39,333
- Equity at exit
- $33,621
- IRR
- -10.0%
- Equity multiple
- 0.39×
- Total profit
- $-38,363
- Equity at exit
- $19,496
Cash invested: $63,137 (down + closing). Projections, not guarantees.
Landlord ↔ Tenant lean methodology
- Overall (STATE)
- 87 Strongly Landlord-Friendly
- State Texas
- 87 Strongly Landlord-Friendly · R+5
- County
- — inherits STATE
- City
- — inherits STATE
ZIP-level market 77320
- Home prices YoY
- -33.0%
- Rents YoY
- 2.9%
- Active inventory
- 518
- Price-to-rent
- 9.8×
Monthly cashflow live
- Estimated rent
- $1,921 medium interval (Pro) →
- Mortgage (P&I)
- −$1,182
- Tax est. 1.5%
- −$282 /mo · $3,382/yr
- Insurance
- −$94
- HOA
- −$0
- Vacancy / Maint / Mgmt
- −$403
- Net cashflow
- $-41
Break-even live
UW: 25.0% down · 7.5% · 30yr · 1.5% tax · 5.0% vac · 8.0% maint · 8.0% mgmt
Financing live
Cash to close
- Down payment
- $56,372
- Closing costs
- $6,765
- Reserves months
- —
- Total cash needed
- —
Loan-product check · same deal, 3 products live
Conventional
25% down · 7.5% · 30yr
- Down + closing
- —
- Monthly P&I
- —
- Monthly cashflow
- —
- DSCR
- —
- Eligible?
- —
Personal DTI + credit; lowest rate.
DSCR
20% down · 8.5% · 30yr
- Down + closing
- —
- Monthly P&I
- —
- Monthly cashflow
- —
- DSCR
- —
- Eligible?
- —
No personal income docs; deal must DSCR.
Hard money
10% down · 12.0% · 12mo
- Down + closing
- —
- Monthly P&I
- —
- Monthly cashflow
- —
- DSCR
- —
- Eligible?
- —
Short-term bridge; refi at stabilization.
Rent comps 3 comps
| Address | Beds | Baths | Sqft | Rent | $/sqft | DOM | Units | Dist |
|---|---|---|---|---|---|---|---|---|
| 3272 State Highway 30 Huntsville, TX | 1.0–3.0 | 1.0–2.0 | 1070 | $2,085 | $1.95 | 43d | 20 | 0.27mi |
| 107 Crosstimbers St Huntsville, TX | 3.0 | 2.0 | 1093 | $1,249 | $1.14 | 43d | 1 | 0.70mi |
| 149 Col Etheredge Blvd Huntsville, TX | 1.0–3.0 | 1.0–3.0 | 993 | $1,710 | $1.72 | 43d | 9 | 0.81mi |
Listing history 1 events
-
2026-05-30days on market $225,490 Active 4 DOM
ⓘ Source: listings_history table (triggers on properties + properties_extension) + one-shot
backfill from property_details.listing_events for pre-trigger history.
Nearby sold comps map
Loading sold comps map…
Walkable amenities ~0.75 mi
Loading nearby amenities…
Taxation est. · year 1
- Rental income
- $23,048
- − Mortgage interest
- −$12,631
- − Property taxes
- −$3,382
- − Insurance
- −$1,127
- − Repairs & maintenance
- −$1,844
- − Management
- −$1,844
- − Depreciation
- −$6,560
- Taxable loss
- −$4,340
- Est. tax savings @ 24.0%
- +$1,042
- After-tax cash flow
- $550/yr
For passive investors: Depreciation is non-cash, so a rental often shows a tax loss while cash-flowing — sheltering income. Rental losses are passive: they offset passive income freely, and up to $25,000/yr can offset ordinary (W-2) income if you actively participate and your MAGI is under $100k (phasing out to $0 by $150k); unused losses carry forward. On sale, claimed depreciation is recaptured at up to 25%, and gains may owe capital-gains tax (a 1031 exchange can defer both). Figures are a year-1 estimate at your 24.0% rate — not tax advice; consult a CPA.
Condition & rehab AI · 21 photos
This single-level home features a spacious open floorplan with modern finishes and a good condition. It is ready for move-in and would benefit from a fresh coat of paint on the exterior trim and cleaning of gutters to enhance its curb appeal and value.
Value-add opportunities
- Both Paint exterior trim — Enhances curb appeal and value
- Both Clean gutters — Improves drainage and property value
Renovation cost estimate screening
Value-add ROI direction
- Both Paint exterior trim — Enhances curb appeal and value ↑
- Both Clean gutters — Improves drainage and property value ↑
ⓘ Cost ranges are severity-bucket heuristics (US national rule-of-thumb). Get contractor quotes + a written scope before underwriting a rehab budget.
Schools (NCES district)
- District
- Huntsville ISD
- NCES district ID
- 4824030
- Math proficiency
- 25% ▼ -6.00%
- Reading proficiency
- 37% ▼ -2.00%
- Median HH income
- $36,597
- Composite
- 25.71/100
- National rank
- #7383
- State rank
- #621 of 826 in TX
Livability — Huntsville
- Score
- 63/100
- State rank
- #825
- US rank
- #14909
Category grades
Schools grade is shown separately in the Schools card above.
Census & demographics
- Census place
- Huntsville, TX
- County
- Walker County · 75,669 people
- City population
- 75,669
- Metro
- Huntsville, TX
- Population (ZIP)
- 38,152
- Household income
- $55,663
- Rent vs Own
- Severe rent burden
- 1030.0
Population outlook (Walker County) Hauer SSP2
- Today (2025)
- 77,602 people
- By 2030
- 82,007 · +5.7%
- By 2040
- 90,436 · +16.5%
- By 2050
- 100,240 · +29.2%
- By 2075
- 123,667 · +59.4%
- By 2100
- 135,073 · +74.1%
Race, ethnicity, and origin ACS 2023
- Neighborhood character
- Diverse neighborhood (Simpson 0.64)
- Race & ethnicity
- White 50% Hispanic / Latino 26% Black 21% Two or more races 15%
- Hispanic origin (detail)
- Mexican 20%
- Common ancestry
- Lithuanian 2% Italian 2% Slovak 2%
- Foreign-born
- 9% · Canada, Vietnam
- Languages at home
- 79% English-only · Spanish 19%
Political lean MEDSL · Walker
- 2024 margin
- Solid R (+40.0) · D 29.6% · R 69.6%
- 2008→2024 swing
- -17.6pp toward R · 2008: -22.4pp · 2024: -40.0pp
- All cycles
- 2024: R+40.0 2020: R+31.7 2016: R+34.5 2012: R+28.4 2008: R+22.4
Not yet ingested
- Civics
- —
Market trends
- HPI YoY
- ▼ -93.48%
- Current HPI
- 190.199
- Rent YoY
- ▲ 2.89%
- Metro
- Huntsville, TX
- State GDP YoY
- ▲ 3.95%
- F500 in state
- 110
Industry mix (Fortune 500 HQ in TX)
| Industry | F500 HQs | Revenue |
|---|---|---|
| Energy | 16 | $1,198B |
|
||
| Technology | 5 | $198B |
|
||
| Engineering / Construction | 4 | $72B |
|
||
| Energy Services | 3 | $60B |
|
||
| Utilities | 3 | $41B |
|
||
| Healthcare | 2 | $330B |
|
||
Cash-flow waterfall
monthlySold comps — $/sqft
last 12 mo · ≤1 miLoading sold comps…