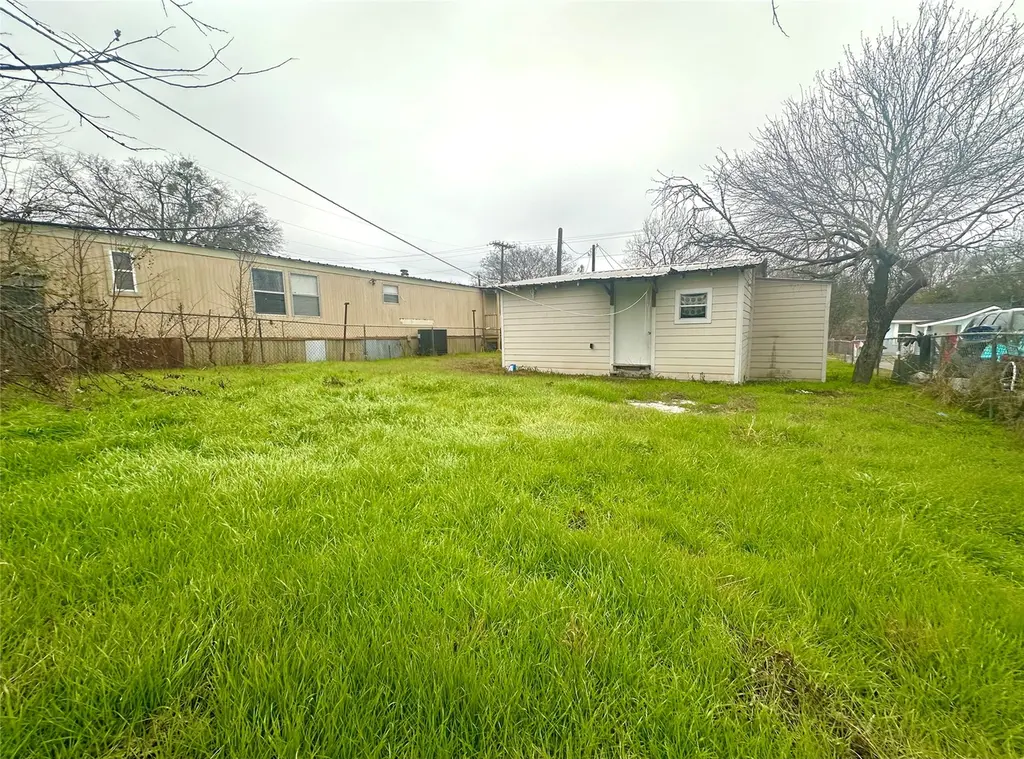
820 Chihuahua St · Lockhart, TX
Flood risk 1/10 · Minimal
- FEMA flood zone
- X (unshaded)
- Chance of flooding over 30 yrs
- 0.0%
- Est. flood insurance / yr
- $507 – $1,088
Fire risk 6/10 · Moderate
- Est. fire insurance / yr
- $1,222 – $2,270
Heat risk 8/10 · Major
- Hot days now (above 108°F)
- 7 days/yr
- Hot days in 30 yrs
- 21 days/yr
Wind risk 8/10 · Major
- Chance of severe wind over 30 yrs
- 80.0%
Air-quality risk 1/10 · Minimal
- Unhealthy air days now
- 0 days/yr
- Unhealthy air days in 30 yrs
- 0 days/yr
Risk factors via First Street. Map © Google.
Why this score? — see what drove the B- grade
The composite is a weighted blend of 9 inputs, each scored 0–100. Each bar is that input's sub-score; the figure is the points it added to the 100-point composite (weight × sub-score).
- Cash flow +25.0/30.0
- ARV discount +15.0/15.0
- DSCR +8.1/10.0
- 1% rule +8.0/10.0
- Livability +3.4/5.0
- Rent growth +2.5/5.0
- Condition / age +2.5/5.0
- Schools +2.4/10.0
- Appreciation +0.0/10.0
$85,000
🖨 Deal sheet (PDF) 📄 Offer letter ✓ Due diligence
Listing remarks
Fixer-Upper with Value-Add Potential Affordable investment property in Lockhart featuring 2 bedrooms, 1.5 bathrooms, and 648 square feet. The home requires repairs and renovation, providing an opportunity for investors, flippers, or buyers seeking a project. Situated minutes from downtown Lockhart with easy access to restaurants, shopping, and local attractions. Offered as-is and priced accordingly. NO HOA.
Key facts
- 3,998 sq ft lot
- 2 parking spots
- Built 1920
Tags
Property features AI
Exterior
- Parking: Driveway; 2 total parking spaces
- Utilities: Electricity available; Public sewer; Public water
- Home design: Single-story home; Faces west; Resale property
- Construction: HardiPlank exterior; Aluminum roof; Pillar/post/pier foundation; Year built per public records
- Exterior features: Porch; Back yard; Front yard
Interior
- Bedrooms: 2 main-level bedrooms
- Flooring: Vinyl flooring
- Bathrooms: 1 full bathroom; 1 half bathroom
- Heating & cooling: Central air conditioning
- Interior features: Main-level primary bedroom; See remarks
- Laundry & utility: Dedicated laundry room
Neighborhood map
What this means for you Summary
Snapshot
- This is a 2-bed/1.0-bath single-family listed at $85k.
Deal economics
- At list price, monthly cash flow is $184 ($2k/yr) — positive.
- The deal already cash-flows at list — no discount required.
- Meets the 1% rule at list price ($1k rent vs $85k).
- Recommended offer: $84k (1.5% below list) — sets the bar for market timing.
- Cap rate 8.9% vs local median 3.0% in Lockhart — top-decile yield for the area; either an underpriced asset or a hidden risk that comps aren't pricing in. Stress-test before assuming the spread holds.
Location & tenants
- Location reads 67/100 on livability (#535 in TX) — a middle-class / working-renter tenant base. Strengths: cost of living A+, housing A+, crime B+; Watch: schools D-, amenities F, commute F.
- Lockhart ISD (town): math 27% / reading 29% proficiency, ranked #657 of 826 in TX (top 80%) — low school quality limits family demand, transient renter base, plan for 1-2y turnover; 62% free/reduced lunch — lower-income household profile, screen leases tightly.
- Market conditions: 452 active listings in the ZIP; 10 comparable units currently listed for rent nearby; rentals lingering (median 45d on market — plan ~5-8 weeks vacancy on turnover, expect pricing pressure); 60% of comp listings sitting > 30 days — soft ceiling on asking rent; 529 units permitted in Caldwell County in 2024 (6 in 5+ unit buildings).
- This rent is only 18% of the median local income ($75k/yr) — well below the 30% rent-burden line; pricing power to push rent on renewal without tenant pushback.
Forward outlook
- Local home prices are declining (-3.0%/yr); year-one equity from $588 of loan paydown is wiped out by about $3k of value loss. Plan a longer hold.
- Caldwell County population projected at +33% by 2050 — long-run rental-demand tailwind backs the buy-and-hold thesis.
Negotiation context
- It's been on market 15 days — a 2% lower offer ($84k) is reasonable based on typical stale-listing flexibility.
- 4 sale attempts with the ask held roughly flat each time — persistent listings suggest the price (not the market) is what's stuck; bring a comps-based counter.
Risks & watch-outs
- Watch-outs: property tax is 2.9% of price; built in 1920 — expect roof / HVAC / electrical / plumbing capex.
- Climate carrying-cost: severe wind risk, 80% chance of damaging wind over 30y; major wildfire risk; extreme-heat days projected 7→21/yr by 2055 (HVAC capex compounding) — expect insurance premiums to compound above CPI over the hold.
Questions for the listing agent
- Built in 1920 — when were the roof, HVAC, electrical panel, plumbing, and water heater last replaced?
- Property tax is high relative to price — has the assessment been appealed recently, and will the sale trigger a re-assessment?
- Is there a deadline driving the sale (1031 exchange, divorce, estate, relocation)? That informs how much negotiation room exists.
- Schools are D-rated, which usually means shorter tenancies and higher turnover. Who's the typical renter profile here, and what's been the actual vacancy rate?
- What's the average days-on-market for RENTAL listings here right now (not sales)? A rising rental-DOM trend means longer vacancies and softer asking-rent achievability than the comps imply.
- What's the recent tenant-quality profile in this submarket — average credit score on applications, eviction rate, late-payment / NSF rate, and stable-employment percentage? A property-management company in the area should have these aggregated.
- How much new for-sale + rental construction is in the pipeline within 1–3 miles? Heavy new supply typically softens prices + rents 12–24 months out; constrained supply supports both.
Investment metrics
- 1% rule
- 1.30% ✓
- Cap rate
- 8.90%
- Cash-on-cash
- 9.30%
- DSCR
- 1.41
- GRM
- 6.4
CMA / ARV
- ARV (median comp)
- $166,705
- List price
- $85,000
- Delta
- -55.01%
- Verdict
- UNDERPRICED
- Comps
- 18 within 1.0 mi
Show comp detail 3 sales within ~0.75 mi
| Address | Dist | Beds/Ba | Sqft | Sold | Price | $/sf | Match |
|---|---|---|---|---|---|---|---|
| 730 Chihuahua St | 0.14mi | 2/1.0 | 712 (+10%) | 2mo | $57,500 | $81 | 76 |
| 711 Sabine St | 0.23mi | 2/2.0 | 588 (-9%) | 13mo | $65,000 | $111 | 59 |
| 613 Cottonwood St | 0.16mi | 2/1.0 | 720 (+11%) | 22mo | $224,900 | $312 | 56 |
Match score weights: distance 35% · size 25% · config 20% · recency 20%. Top-matched comps best support the ARV.
Projected returns pro-forma
-3.0% appreciation · 3.0% rent growth · sell at horizon
- IRR
- -2.2%
- Equity multiple
- 0.92×
- Total profit
- $-1,952
- Equity at exit
- $12,674
- IRR
- 7.6%
- Equity multiple
- 1.58×
- Total profit
- $13,740
- Equity at exit
- $7,349
Cash invested: $23,800 (down + closing). Projections, not guarantees.
Landlord ↔ Tenant lean methodology
- Overall (STATE)
- 87 Strongly Landlord-Friendly
- State Texas
- 87 Strongly Landlord-Friendly · R+5
- County
- — inherits STATE
- City
- — inherits STATE
ZIP-level market 78644
- Home prices YoY
- -29.4%
- Active inventory
- 452
- Price-to-rent
- 6.4×
Monthly cashflow live
- Estimated rent
- $1,105 high interval (Pro) →
- Mortgage (P&I)
- −$446
- Tax from tax record
- −$207 /mo · $2,485/yr
- Insurance
- −$35
- HOA
- −$0
- Vacancy / Maint / Mgmt
- −$232
- Net cashflow
- $184
Break-even live
Sensitivity live
| Price | -10% $232 | -5% $208 | +0% $184 | +5% $160 | +10% $136 |
|---|---|---|---|---|---|
| Rent | -10% $97 | -5% $141 | +0% $184 | +5% $228 | +10% $272 |
| Rate | -1.0pp $227 | -0.5pp $206 | base $184 | +0.5pp $162 | +1.0pp $140 |
UW: 25.0% down · 7.5% · 30yr · 1.5% tax · 5.0% vac · 8.0% maint · 8.0% mgmt
Financing live
Cash to close
- Down payment
- $21,250
- Closing costs
- $2,550
- Reserves months
- —
- Total cash needed
- —
Loan-product check · same deal, 3 products live
Conventional
25% down · 7.5% · 30yr
- Down + closing
- —
- Monthly P&I
- —
- Monthly cashflow
- —
- DSCR
- —
- Eligible?
- —
Personal DTI + credit; lowest rate.
DSCR
20% down · 8.5% · 30yr
- Down + closing
- —
- Monthly P&I
- —
- Monthly cashflow
- —
- DSCR
- —
- Eligible?
- —
No personal income docs; deal must DSCR.
Hard money
10% down · 12.0% · 12mo
- Down + closing
- —
- Monthly P&I
- —
- Monthly cashflow
- —
- DSCR
- —
- Eligible?
- —
Short-term bridge; refi at stabilization.
Rent comps 10 comps
| Address | Beds | Baths | Sqft | Rent | $/sqft | DOM | Units | Dist |
|---|---|---|---|---|---|---|---|---|
| 1000 Chihuahua St Unit B Lockhart, TX | 1.0 | 1.0 | 500 | $775 | $1.55 | 13d | 1 | 0.13mi |
| 609 Cottonwood St Unit B Lockhart, TX | 1.0 | 1.0 | 380 | $950 | $2.50 | 44d | 1 | 0.15mi |
| 1204 Blackjack St Unit B Lockhart, TX | 2.0 | 1.0 | 750 | $1,150 | $1.53 | 24d | 1 | 0.40mi |
| 137 Elm St Lockhart, TX | 2.0 | 1.0 | 650 | $1,025 | $1.58 | 44d | 1 | 1.09mi |
| 137 Elm St Unit 2 Lockhart, TX | 2.0 | 1.0 | 650 | $1,125 | $1.73 | 5d | 1 | 1.09mi |
| 137 Elm St Unit 12 Lockhart, TX | 2.0 | 1.0 | 650 | $1,125 | $1.73 | 44d | 1 | 1.09mi |
| 137 Elm St Unit 202 Lockhart, TX | 2.0 | 1.0 | 650 | $1,095 | $1.68 | 44d | 1 | 1.09mi |
| 137 Elm St Unit 19 Lockhart, TX | 2.0 | 1.0 | 650 | $1,125 | $1.73 | 24d | 1 | 1.10mi |
| 139 Elm St Lockhart, TX | 1.0 | 1.0 | 738 | $750 | $1.02 | 44d | 2 | 1.12mi |
| 518 Laredo St Lockhart, TX | 2.0 | 1.0 | 720 | $1,050 | $1.46 | 44d | 1 | 1.19mi |
Listing history 21 events
-
2026-06-18days on market $85,000 Active 15 DOM
-
2026-06-17days on market $85,000 Active 14 DOM
-
2026-06-16days on market $85,000 Active 13 DOM
-
2026-06-15days on market $85,000 Active 12 DOM
-
2026-06-13days on market $85,000 Active 10 DOM
-
2026-06-09days on market $85,000 Active 6 DOM
-
2026-06-08days on market $85,000 Active 5 DOM
-
2026-06-07days on market $85,000 Active 4 DOM
-
2026-06-04remarks 410-char remark
-
2026-06-04pricedays on market $85,000 Active 1 DOM
-
2026-05-31days on market $75,000 Active 86 DOM
-
2026-03-06$75,000 Active 197-char remark
-
2025-10-09price
-
2025-09-03Active
-
2025-07-01price
-
2025-06-06price
-
2025-05-24price
-
2025-02-05price
-
2025-01-14Active
-
2008-05-02soldstatus
-
2001-12-19soldstatus
ⓘ Source: listings_history table (triggers on properties + properties_extension) + one-shot
backfill from property_details.listing_events for pre-trigger history.
Tax reassessment forecast TX · Resets to sale price
- Current annual tax
- $2,485 · $207/mo
- Projected year-2 tax
- $2,485 · $207/mo
- Expected delta
- $0/yr ($0/mo · 0.0%)
ⓘ Screening estimate from a state-policy table — verify with the county assessor before closing.
Climate risk First Street
- Flood 1/10 Low FEMA zone X (unshaded) · 0% chance over 30 yrs
- Wildfire 6/10 Major
- Heat 8/10 Severe 7 d/yr ≥108°F today · 21 d/yr by 30 yrs out
- Wind 8/10 Severe 80% chance of damaging wind over 30 yrs
- Air quality 1/10 Low 0 unhealthy d/yr today · 0 by 30 yrs out
Nearby sold comps map
Loading sold comps map…
Walkable amenities ~0.75 mi
Loading nearby amenities…
Taxation est. · year 1
- Rental income
- $13,255
- − Mortgage interest
- −$4,761
- − Property taxes
- −$2,485
- − Insurance
- −$425
- − Repairs & maintenance
- −$1,060
- − Management
- −$1,060
- − Depreciation
- −$2,473
- Taxable income
- $990
- Est. tax owed @ 24.0%
- −$238
- After-tax cash flow
- $1,975/yr
For passive investors: Depreciation is non-cash, so a rental often shows a tax loss while cash-flowing — sheltering income. Rental losses are passive: they offset passive income freely, and up to $25,000/yr can offset ordinary (W-2) income if you actively participate and your MAGI is under $100k (phasing out to $0 by $150k); unused losses carry forward. On sale, claimed depreciation is recaptured at up to 25%, and gains may owe capital-gains tax (a 1031 exchange can defer both). Figures are a year-1 estimate at your 24.0% rate — not tax advice; consult a CPA.
Schools (NCES district)
- District
- Lockhart ISD
- NCES district ID
- 4827870
- Math proficiency
- 27% ▼ -12.00%
- Reading proficiency
- 29% ▼ -2.00%
- Median HH income
- $48,868
- Composite
- 24.44/100
- National rank
- #7674
- State rank
- #657 of 826 in TX
Livability — Lockhart
- Score
- 67/100
- State rank
- #535
- US rank
- #10453
Category grades
Schools grade is shown separately in the Schools card above.
Census & demographics
- Census place
- Lockhart, TX
- County
- Caldwell County · 25,195 people
- City population
- 22,348
- Metro
- Austin-Round Rock-Georgetown, TX
- Population (ZIP)
- 22,348
- Household income
- $74,709
- Rent vs Own
- Severe rent burden
- 324.0
Population outlook (Caldwell County) Hauer SSP2
- Today (2025)
- 46,557 people
- By 2030
- 49,673 · +6.7%
- By 2040
- 55,827 · +19.9%
- By 2050
- 61,832 · +32.8%
- By 2075
- 77,212 · +65.8%
- By 2100
- 89,225 · +91.6%
Race, ethnicity, and origin ACS 2023
- Neighborhood character
- Diverse neighborhood (Simpson 0.57)
- Race & ethnicity
- Hispanic / Latino 52% White 39% Two or more races 23% Black 4% Asian 1%
- Hispanic origin (detail)
- Mexican 45% Puerto Rican 2%
- Common ancestry
- Italian 1% Lithuanian 1% Serbian 1%
- Foreign-born
- 9% · Canada
- Languages at home
- 67% English-only · Spanish 32%
Political lean MEDSL · Caldwell
- 2024 margin
- R (+14.4) · D 42.2% · R 56.6% · Other 1.2%
- 2008→2024 swing
- -8.4pp toward R · 2008: -6.0pp · 2024: -14.4pp
- All cycles
- 2024: R+14.4 2020: R+9.1 2016: R+15.8 2012: R+11.1 2008: R+6.0
Not yet ingested
- Civics
- —
Market trends
- HPI YoY
- ▼ -99.62%
- Current HPI
- 239.7906
- Rent YoY
- —
- Metro
- Austin-Round Rock-Georgetown, TX
- State GDP YoY
- ▲ 3.95%
- F500 in state
- 110
Industry mix (Fortune 500 HQ in TX)
| Industry | F500 HQs | Revenue |
|---|---|---|
| Energy | 16 | $1,198B |
|
||
| Technology | 5 | $198B |
|
||
| Engineering / Construction | 4 | $72B |
|
||
| Energy Services | 3 | $60B |
|
||
| Utilities | 3 | $41B |
|
||
| Healthcare | 2 | $330B |
|
||
Price history
11 events — show timeline
- 2026-06-03 Listed $85,000 Unlock MLS
- 2026-03-06 Listed — Unlock MLS
- 2025-10-09 Price Changed — Unlock MLS
- 2025-09-03 Listed — Unlock MLS
- 2025-07-01 Price Changed — Unlock MLS
- 2025-06-06 Price Changed — Unlock MLS
- 2025-05-24 Price Changed — Unlock MLS
- 2025-02-05 Price Changed — Unlock MLS
- 2025-01-14 Listed — Unlock MLS
- 2008-05-02 Sold (Public Records) — Public Records
- 2001-12-19 Sold (Public Records) — Public Records
Property tax history
+12.6%/yrLatest (2026): $2,485 · -2.3% YoY. Source: county tax records.
Cash-flow waterfall
monthlySold comps — $/sqft
last 12 mo · ≤1 miLoading sold comps…