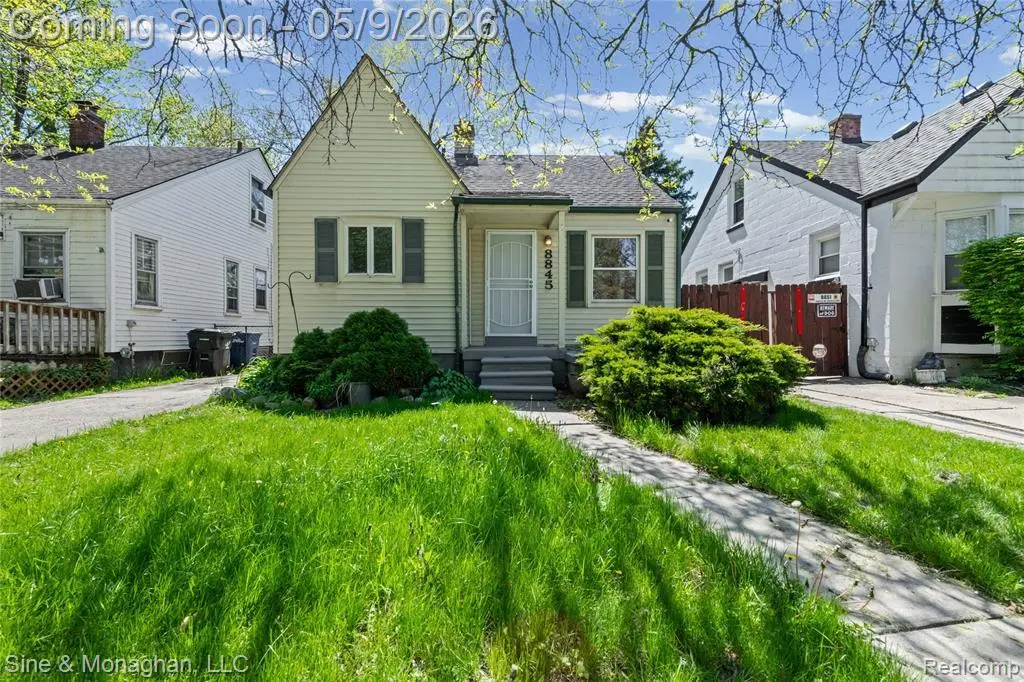
8845 Canyon St · Detroit, MI
Flood risk 1/10 · Minimal
- FEMA flood zone
- X (unshaded)
- Chance of flooding over 30 yrs
- 0.0%
- Est. flood insurance / yr
- $473 – $860
Fire risk 1/10 · Minimal
- Est. fire insurance / yr
- $784 – $1,456
Heat risk 3/10 · Minor
- Hot days now (above 96°F)
- 7 days/yr
- Hot days in 30 yrs
- 15 days/yr
Wind risk 2/10 · Minimal
- Chance of severe wind over 30 yrs
- —
Air-quality risk 3/10 · Minor
- Unhealthy air days now
- 3 days/yr
- Unhealthy air days in 30 yrs
- 4 days/yr
Risk factors via First Street. Map © Google.
Why this score? — see what drove the D- grade
The composite is a weighted blend of 9 inputs, each scored 0–100. Each bar is that input's sub-score; the figure is the points it added to the 100-point composite (weight × sub-score).
- Cash flow +17.6/30.0
- DSCR +5.5/10.0
- 1% rule +4.8/10.0
- Livability +3.7/5.0
- Rent growth +2.5/5.0
- Condition / age +2.5/5.0
- ARV discount +1.6/15.0
- Schools +1.3/10.0
- Appreciation +0.0/10.0
$114,900
🖨 Deal sheet (PDF) 📄 Offer letter ✓ Due diligence
Listing remarks MLS
Beautifully updated 3-bedroom, 1.5-bath home located in Cornerstone Village with a highly sought-after Grosse Pointe zip code. Featuring refinished hardwood floors, newer windows throughout, renovated kitchen and bathrooms, and a partially finished basement, this home offers comfort, style, and functionality. Perfect for homeowners looking for a move-in-ready property or investors seeking strong rental potential.
Key facts
- 4,356 sq ft lot
- Built 1941
- Listed 43 days
Property features AI
Finance
- Other: Lot approximately 0.1 acre (35 x 120)
- Financial info: No investor or income/expense details provided
- HOA & community: No HOA information provided
Exterior
- Parking: No garage
- Security: No specific security features provided
- Utilities: Public water; Public sewer
- Home design: Single-family residence; Two levels; Ground-level entry with steps
- Construction: Vinyl siding; Block foundation; Asphalt/composition roof; Built area: two-level home with finished space above and below grade
- Exterior features: Covered porch; Porch; Back yard fenced; Paved road access
Interior
- Kitchen: No specific kitchen appliance list provided
- Bedrooms: Total of 6 rooms (includes bedrooms and living areas)
- Flooring: No flooring information provided
- Bathrooms: 1 full bathroom; 1 half bathroom
- Heating & cooling: Forced air heating (natural gas); Ceiling fan(s); No central cooling
- Interior features: Gas water heater; Partially finished basement; Basement present
- Laundry & utility: No specific laundry appliances listed
Neighborhood map
What this means for you Summary
Snapshot
- This is a 3-bed/1.0-bath single-family listed at $115k.
Deal economics
- At list price, monthly cash flow is $90 ($1k/yr) — positive.
- The deal already cash-flows at list — no discount required.
- To meet the 1% rule (rent ≥ 1% of price), the offer needs to be $112k (2.1% below list).
- Recommended offer: $111k (3.0% below list) — sets the bar for market timing.
- Cap rate 7.2% vs local median 10.0% in Detroit — below-typical yield; the buyer is paying a premium for something (appreciation thesis, condition, location) that the cap rate doesn't capture.
Location & tenants
- Location reads 73/100 on livability (#218 in MI) — a middle-class / working-renter tenant base. Strengths: amenities A+, commute A+, cost of living A+; Watch: crime F, employment F.
- Detroit Public Schools Community District (urban): math 10% / reading 24% proficiency, ranked #499 of 540 in MI (top 92%) — low school quality limits family demand, transient renter base, plan for 1-2y turnover; 90% free/reduced lunch — lower-income household profile, screen leases tightly.
- Zoned schools: Marquette Elementarymiddle School (514 students, 94% FRL); East English Village Preparatory Academy At Finney (math 10% / reading 10%, grade F, #659 of 713 statewide, top 97%, 697 students, 85% FRL) — zoned schools at 89% FRL track the district average.
- Market conditions: 162 active listings in the ZIP; 8 comparable units currently listed for rent nearby; rentals lingering (median 46d on market — plan ~5-8 weeks vacancy on turnover, expect pricing pressure); 62% of comp listings sitting > 30 days — soft ceiling on asking rent; 2,639 units permitted in Wayne County in 2024 (1,216 in 5+ unit buildings).
Forward outlook
- Local home prices are declining (-3.0%/yr); year-one equity from $794 of loan paydown is wiped out by about $3k of value loss. Plan a longer hold.
- Wayne County population projected at -17% by 2050 — secular population decline; favor cash flow + early exit over multi-decade hold.
Negotiation context
- It's been on market 44 days — a 3% lower offer ($111k) is reasonable based on typical stale-listing flexibility.
- 15 sale attempts since 30y ago with the ask held roughly flat each time — persistent listings suggest the price (not the market) is what's stuck; bring a comps-based counter.
- Current owner paid $45k; list at $115k implies a 155% gain — meaningful room to come down on a strong offer.
Risks & watch-outs
- Watch-outs: built in 1941 — expect roof / HVAC / electrical / plumbing capex.
Questions for the listing agent
- It's been on market 44 days. Have you received any prior offers? Is the seller open to a 3% concession, seller financing, or rate buy-down credit?
- Built in 1941 — when were the roof, HVAC, electrical panel, plumbing, and water heater last replaced?
- Is there a deadline driving the sale (1031 exchange, divorce, estate, relocation)? That informs how much negotiation room exists.
- Schools are F-rated, which usually means shorter tenancies and higher turnover. Who's the typical renter profile here, and what's been the actual vacancy rate?
- Crime grade is F in this area — have there been break-ins, vandalism, or insurance claims at this property in the last 3 years? What carrier currently insures it and at what premium?
- The area grade is low — what's the realistic commute time and amenity access for the typical tenant pool here? Any planned neighborhood developments (good or bad) we should know about?
- What's the average days-on-market for RENTAL listings here right now (not sales)? A rising rental-DOM trend means longer vacancies and softer asking-rent achievability than the comps imply.
- What's the recent tenant-quality profile in this submarket — average credit score on applications, eviction rate, late-payment / NSF rate, and stable-employment percentage? A property-management company in the area should have these aggregated.
- How much new for-sale + rental construction is in the pipeline within 1–3 miles? Heavy new supply typically softens prices + rents 12–24 months out; constrained supply supports both.
Investment metrics
- 1% rule
- 0.98% ✗
- Cap rate
- 7.24%
- Cash-on-cash
- 3.37%
- DSCR
- 1.15
- GRM
- 8.5
CMA / ARV
- ARV (median comp)
- $101,675
- List price
- $114,900
- Delta
- 13.01%
- Verdict
- OVERPRICED
- Comps
- 20 within 1.0 mi
Show comp detail 5 sales within ~0.75 mi
| Address | Dist | Beds/Ba | Sqft | Sold | Price | $/sf | Match |
|---|---|---|---|---|---|---|---|
| 6183 Woodhall St | 0.45mi | 3/1.0 | 720 (+11%) | 1mo | $32,000 | $44 | 60 |
| 5558 Radnor St | 0.69mi | 2/1.0 (-1) | 660 (+2%) | 6mo | $18,000 | $27 | 55 |
| 9240 Camley St | 0.30mi | 2/1.0 (-1) | 729 (+12%) | 23mo | $110,000 | $151 | 41 |
| 19724 Mccormick St | 0.71mi | 2/1.0 (-1) | 696 (+7%) | 19mo | $80,000 | $115 | 34 |
| 5546 Neff Ave | 0.74mi | 2/1.0 (-1) | 720 (+11%) | 14mo | $74,900 | $104 | 31 |
Match score weights: distance 35% · size 25% · config 20% · recency 20%. Top-matched comps best support the ARV.
Projected returns pro-forma
-3.0% appreciation · 3.0% rent growth · sell at horizon
- IRR
- -11.0%
- Equity multiple
- 0.60×
- Total profit
- $-12,847
- Equity at exit
- $17,132
- IRR
- -1.7%
- Equity multiple
- 0.89×
- Total profit
- $-3,700
- Equity at exit
- $9,934
Cash invested: $32,172 (down + closing). Projections, not guarantees.
Landlord ↔ Tenant lean methodology
- Overall (STATE)
- 62 Landlord-Friendly
- State Michigan
- 62 Landlord-Friendly · EVEN
- County
- — inherits STATE
- City
- — inherits STATE
ZIP-level market 48236
- Active inventory
- 162
- Price-to-rent
- 8.5×
Monthly cashflow live
- Estimated rent
- $1,125 high interval (Pro) →
- Mortgage (P&I)
- −$603
- Tax from tax record
- −$148 /mo · $1,774/yr
- Insurance
- −$48
- HOA
- −$0
- Vacancy / Maint / Mgmt
- −$236
- Net cashflow
- $90
Break-even live
Sensitivity live
| Price | -10% $155 | -5% $123 | +0% $90 | +5% $58 | +10% $25 |
|---|---|---|---|---|---|
| Rent | -10% $1 | -5% $46 | +0% $90 | +5% $135 | +10% $179 |
| Rate | -1.0pp $148 | -0.5pp $120 | base $90 | +0.5pp $61 | +1.0pp $30 |
UW: 25.0% down · 7.5% · 30yr · 1.5% tax · 5.0% vac · 8.0% maint · 8.0% mgmt
Financing live
Cash to close
- Down payment
- $28,725
- Closing costs
- $3,447
- Reserves months
- —
- Total cash needed
- —
Loan-product check · same deal, 3 products live
Conventional
25% down · 7.5% · 30yr
- Down + closing
- —
- Monthly P&I
- —
- Monthly cashflow
- —
- DSCR
- —
- Eligible?
- —
Personal DTI + credit; lowest rate.
DSCR
20% down · 8.5% · 30yr
- Down + closing
- —
- Monthly P&I
- —
- Monthly cashflow
- —
- DSCR
- —
- Eligible?
- —
No personal income docs; deal must DSCR.
Hard money
10% down · 12.0% · 12mo
- Down + closing
- —
- Monthly P&I
- —
- Monthly cashflow
- —
- DSCR
- —
- Eligible?
- —
Short-term bridge; refi at stabilization.
Rent comps 8 comps
| Address | Beds | Baths | Sqft | Rent | $/sqft | DOM | Units | Dist |
|---|---|---|---|---|---|---|---|---|
| 11529 Roxbury St Detroit, MI | 2.0 | 1.0 | 720 | $1,200 | $1.67 | 14d | 1 | 0.92mi |
| 11611 Morang Ave Detroit, MI | 1.0–2.0 | 1.0 | 709 | $1,040 | $1.47 | 45d | 1 | 1.01mi |
| 4865 Cadieux Rd Unit 11 Detroit, MI | 2.0 | 1.0 | 630 | $1,200 | $1.90 | 45d | 1 | 1.23mi |
| 4837 Cadieux Rd Unit 9 Detroit, MI | 2.0 | 1.0 | 650 | $1,200 | $1.85 | 45d | 1 | 1.25mi |
| 4811 Cadieux Rd Unit 11 Detroit, MI | 2.0 | 1.0 | 663 | $1,200 | $1.81 | 23d | 1 | 1.27mi |
| 4811 Cadieux Rd Unit 10 Detroit, MI | 2.0 | 1.0 | 663 | $1,200 | $1.81 | 45d | 1 | 1.27mi |
| 12201 Morang Ave Unit 8 Detroit, MI | 2.0 | 1.0 | 610 | $875 | $1.43 | 45d | 1 | 1.29mi |
| 5284 Devonshire Rd Detroit, MI | 2.0 | 1.0 | 650 | $1,050 | $1.62 | 26d | 1 | 1.47mi |
Listing history 50 events
-
2026-06-21days on market $114,900 Active 44 DOM
-
2026-06-18days on market $114,900 Active 41 DOM
-
2026-06-17days on market $114,900 Active 40 DOM
-
2026-06-15days on market $114,900 Active 38 DOM
-
2026-06-13days on market $114,900 Active 36 DOM
-
2026-06-13days on market $114,900 Active 35 DOM
-
2026-06-09days on market $114,900 Active 32 DOM
-
2026-06-08days on market $114,900 Active 31 DOM
-
2026-06-07days on market $114,900 Active 30 DOM
-
2026-06-04days on market $114,900 Active 27 DOM
-
2026-06-03days on market $114,900 Active 26 DOM
-
2026-06-02days on market $114,900 Active 25 DOM
-
2026-06-01days on market $114,900 Active 24 DOM
-
2026-05-31days on market $114,900 Active 23 DOM
-
2026-05-09$114,900 Active 416-char remark
Show marketing remark (416 chars)
Beautifully updated 3-bedroom, 1.5-bath home located in Cornerstone Village with a highly sought-after Grosse Pointe zip code. Featuring refinished hardwood floors, newer windows throughout, renovated kitchen and bathrooms, and a partially finished basement, this home offers comfort, style, and functionality. Perfect for homeowners looking for a move-in-ready property or investors seeking strong rental potential.
-
2026-05-08historical $114,900 416-char remark
Show marketing remark (416 chars)
Beautifully updated 3-bedroom, 1.5-bath home located in Cornerstone Village with a highly sought-after Grosse Pointe zip code. Featuring refinished hardwood floors, newer windows throughout, renovated kitchen and bathrooms, and a partially finished basement, this home offers comfort, style, and functionality. Perfect for homeowners looking for a move-in-ready property or investors seeking strong rental potential.
-
2025-12-24historical
-
2025-12-23$45,000 Active
-
2025-12-23soldstatus $45,000 Closed
-
2025-12-23soldstatus $45,000
-
2025-12-23soldstatus $45,000
-
2025-12-23$45,000
-
2025-12-23$45,000
-
2019-03-21soldstatus $18,500 Sold
-
2019-03-21soldstatus $18,500 Closed
-
2019-03-07status Pending
-
2019-03-06status Pending
-
2019-02-08price $19,900
-
2019-02-08price $19,900
-
2019-01-08price $24,900
-
2019-01-08price $24,900
-
2018-12-18price $26,900
-
2018-12-18price $26,900
-
2018-11-20status Active
-
2018-11-20status Active
-
2018-11-08status Pending
-
2018-11-08status Pending
-
2018-11-01$27,900 Active
-
2018-11-01$27,900 Active
-
2015-11-02historical
-
2015-11-02historical
-
2015-09-25price $26,900
-
2015-08-12price $29,900
-
2015-06-23$35,900 Active
-
2015-06-23$26,900
-
2015-05-18historical
-
2015-05-18historical
-
2015-04-24$38,160 Active
-
2015-04-24$38,160
ⓘ Source: listings_history table (triggers on properties + properties_extension) + one-shot
backfill from property_details.listing_events for pre-trigger history.
Tax reassessment forecast MI · Partial reset (capped growth)
- Current annual tax
- $1,774 · $148/mo
- Projected year-2 tax
- $1,774 · $148/mo
- Expected delta
- $0/yr ($0/mo · 0.0%)
ⓘ Screening estimate from a state-policy table — verify with the county assessor before closing.
Climate risk First Street
- Flood 1/10 Low FEMA zone X (unshaded) · 0% chance over 30 yrs
- Wildfire 1/10 Low
- Heat 3/10 Moderate 7 d/yr ≥96°F today · 15 d/yr by 30 yrs out
- Wind 2/10 Low
- Air quality 3/10 Moderate 3 unhealthy d/yr today · 4 by 30 yrs out
Nearby sold comps map
Loading sold comps map…
Walkable amenities ~0.75 mi
Loading nearby amenities…
Taxation est. · year 1
- Rental income
- $13,497
- − Mortgage interest
- −$6,436
- − Property taxes
- −$1,774
- − Insurance
- −$574
- − Repairs & maintenance
- −$1,080
- − Management
- −$1,080
- − Depreciation
- −$3,343
- Taxable loss
- −$789
- Est. tax savings @ 24.0%
- +$189
- After-tax cash flow
- $1,273/yr
For passive investors: Depreciation is non-cash, so a rental often shows a tax loss while cash-flowing — sheltering income. Rental losses are passive: they offset passive income freely, and up to $25,000/yr can offset ordinary (W-2) income if you actively participate and your MAGI is under $100k (phasing out to $0 by $150k); unused losses carry forward. On sale, claimed depreciation is recaptured at up to 25%, and gains may owe capital-gains tax (a 1031 exchange can defer both). Figures are a year-1 estimate at your 24.0% rate — not tax advice; consult a CPA.
Schools (NCES district)
- District
- Detroit Public Schools Community District
- NCES district ID
- 2601103
- Math proficiency
- 10% ▼ -2.00%
- Reading proficiency
- 24% ▲ 6.00%
- Median HH income
- $25,815
- Composite
- 13.06/100
- National rank
- #9564
- State rank
- #499 of 540 in MI
Livability — Detroit
- Score
- 73/100
- State rank
- #218
- US rank
- #5427
Category grades
Schools grade is shown separately in the Schools card above.
Census & demographics
- Census place
- Detroit, MI
- City population
- 572,865
- Population (ZIP)
- 31,383
Population outlook (Wayne County) Hauer SSP2
- Today (2025)
- 1,675,273 people
- By 2030
- 1,620,300 · -3.3%
- By 2040
- 1,502,341 · -10.3%
- By 2050
- 1,384,039 · -17.4%
- By 2075
- 1,124,592 · -32.9%
- By 2100
- 881,193 · -47.4%
Race, ethnicity, and origin ACS 2023
- Neighborhood character
- Predominantly White (82%)
- Race & ethnicity
- White 82% Black 11% Two or more races 5% Asian 2% Hispanic / Latino 1%
- Common ancestry
- Romanian 10% Lithuanian 5% Italian 4%
- Foreign-born
- 7% · Canada
- Languages at home
- 93% English-only · Other Indo-European 2% Arabic 2% Spanish 1%
Political lean MEDSL · Wayne
- 2024 margin
- Strong D (+29.0) · D 62.7% · R 33.7% · Other 3.6%
- 2008→2024 swing
- -20.5pp toward R · 2008: 49.5pp · 2024: 29.0pp
- All cycles
- 2024: D+29.0 2020: D+38.1 2016: D+37.3 2012: D+46.9 2008: D+49.5
Not yet ingested
- Civics
- —
Market trends
- HPI YoY
- ▼ -285.11%
- Current HPI
- 181.0475
- Rent YoY
- —
- Metro
- —
- State GDP YoY
- ▲ 1.37%
- F500 in state
- 28
Industry mix (Fortune 500 HQ in MI)
| Industry | F500 HQs | Revenue |
|---|---|---|
| Automotive Parts | 3 | $48B |
|
||
| Automotive | 2 | $372B |
|
||
| Chemicals | 1 | $45B |
|
||
| Automotive Retail | 1 | $29B |
|
||
| Healthcare / Medical Devices | 1 | $23B |
|
||
| Automotive Technology | 1 | $20B |
|
||
Price history
+117.2% since first listed44 events — show timeline
- 2026-05-09 Listed $114,900 MiRealSource-MiMLS
- 2026-05-09 Listed $114,900 REALCOMP
- 2026-05-08 Coming Soon $114,900 MiRealSource-MiMLS
- 2025-12-24 Listing Removed — REALCOMP
- 2025-12-23 Listed $45,000 REALCOMP
- 2025-12-23 Listed $45,000 MiRealSource-MiMLS
- 2025-12-23 Listed $45,000 REALCOMP
- 2025-12-23 Sold (MLS) $45,000 MiRealSource-MiMLS
- 2025-12-23 Sold (MLS) $45,000 REALCOMP
- 2025-12-23 Sold (MLS) $45,000 REALCOMP
- 2019-03-21 Sold (MLS) $18,500 MiRealSource-MiMLS
- 2019-03-21 Sold (MLS) $18,500 REALCOMP
- 2019-03-07 Pending — MiRealSource-MiMLS
- 2019-03-06 Pending — REALCOMP
- 2019-02-08 Price Changed $19,900 MiRealSource-MiMLS
- 2019-02-08 Price Changed $19,900 REALCOMP
- 2019-01-08 Price Changed $24,900 MiRealSource-MiMLS
- 2019-01-08 Price Changed $24,900 REALCOMP
- 2018-12-18 Price Changed $26,900 MiRealSource-MiMLS
- 2018-12-18 Price Changed $26,900 REALCOMP
- 2018-11-20 Relisted — MiRealSource-MiMLS
- 2018-11-20 Relisted — REALCOMP
- 2018-11-08 Pending — MiRealSource-MiMLS
- 2018-11-08 Pending — REALCOMP
- 2018-11-01 Listed $27,900 MiRealSource-MiMLS
- 2018-11-01 Listed $27,900 REALCOMP
- 2015-11-02 Listing Removed — REALCOMP
- 2015-11-02 Listing Removed — MiRealSource-MiMLS
- 2015-09-25 Price Changed $26,900 REALCOMP
- 2015-08-12 Price Changed $29,900 REALCOMP
- 2015-06-23 Listed $35,900 REALCOMP
- 2015-06-23 Listed $26,900 MiRealSource-MiMLS
- 2015-05-18 Listing Removed — REALCOMP
- 2015-05-18 Listing Removed — MiRealSource-MiMLS
- 2015-04-24 Listed $38,160 REALCOMP
- 2015-04-24 Listed $38,160 MiRealSource-MiMLS
- 2002-06-20 Sold (Public Records) $80,000 Public Records
- 2002-05-24 Sold (MLS) $80,000 MiRealSource-MiMLS
- 2002-03-05 Listing Removed — MiRealSource-MiMLS
- 2001-12-26 Listed $83,900 MiRealSource-MiMLS
- 1996-09-10 Sold (Public Records) $50,900 Public Records
- 1996-08-26 Sold (MLS) $50,900 MiRealSource-MiMLS
- 1996-08-05 Listing Removed — MiRealSource-MiMLS
- 1996-07-12 Listed $52,900 MiRealSource-MiMLS
Property tax history
+4.3%/yrLatest (2025): $1,774 · -26.3% YoY. Source: county tax records.
Cash-flow waterfall
monthlySold comps — $/sqft
last 12 mo · ≤1 miLoading sold comps…