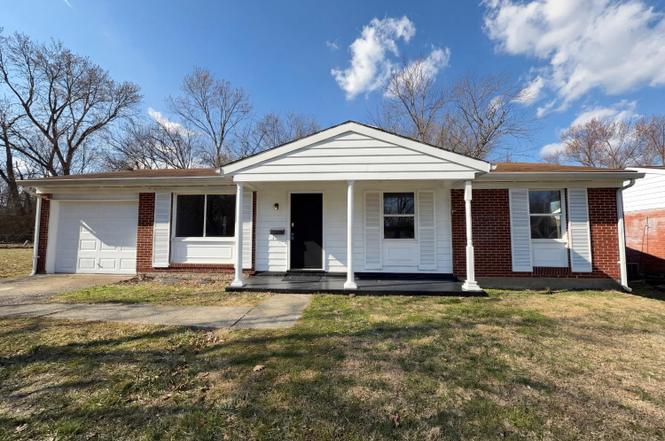
1858 Aspenhill Dr · New Burlington, OH
Flood risk 1/10 · Minimal
- FEMA flood zone
- X (unshaded)
- Chance of flooding over 30 yrs
- 0.0%
- Est. flood insurance / yr
- $507 – $1,088
Fire risk 1/10 · Minimal
- Est. fire insurance / yr
- $713 – $1,323
Heat risk 4/10 · Minor
- Hot days now (above 103°F)
- 7 days/yr
- Hot days in 30 yrs
- 19 days/yr
Wind risk 2/10 · Minimal
- Chance of severe wind over 30 yrs
- 1.0%
Air-quality risk 4/10 · Minor
- Unhealthy air days now
- 4 days/yr
- Unhealthy air days in 30 yrs
- 6 days/yr
Risk factors via First Street. Map © Google.
Why this score? — see what drove the D- grade
The composite is a weighted blend of 9 inputs, each scored 0–100. Each bar is that input's sub-score; the figure is the points it added to the 100-point composite (weight × sub-score).
- Cash flow +12.8/30.0
- ARV discount +6.9/15.0
- DSCR +3.8/10.0
- Rent growth +3.3/5.0
- Livability +3.2/5.0
- 1% rule +3.1/10.0
- Condition / age +2.5/5.0
- Schools +1.6/10.0
- Appreciation +0.0/10.0
$212,000
🖨 Deal sheet 📄 Offer letter ✓ Due diligence
Listing remarks MLS
Remodeled brick ranch tucked away in cul-de-sac. Garage converted to part storage area- part fam rm, could be 4th BR. New carpet, paint, flooring, kitchen counterw/double deep sinks. Fenced yard & patio
Key facts
- New flooring
- New appliances
- Patio
Tags
Property features AI
Finance
- Other:
- Financial info:
- HOA & community: No HOA
Exterior
- Parking:
- Security:
- Utilities: Public water; Public sewer; Natural gas
- Home design: Traditional single-family home; One story (single level); Slab foundation
- Construction: Brick and wood siding construction; Composition roof
- Exterior features: Located on a cul-de-sac; Aluminum, storm, double-pane and vinyl windows
Interior
- Kitchen:
- Bedrooms: Four bedrooms, all on main level; Primary bedroom approximately 10 x 14
- Flooring:
- Bathrooms: One full bathroom on main level; One half (partial) bathroom on main level
- Heating & cooling: Gas heating; Central air conditioning; Gas water heater
- Interior features: Six total rooms
- Laundry & utility:
Neighborhood map
What this means for you Summary
Snapshot
- This is a 3-bed/1.5-bath single-family listed at $212k.
Deal economics
- At list price, monthly cash flow is $-18 ($-213/yr) — negative.
- To cash-flow at today's rent, offer at most $209k (1.5% below list).
- To meet the 1% rule (rent ≥ 1% of price), the offer needs to be $171k (19.3% below list).
- Recommended offer: $171k (19.3% below list) — sets the bar for 1% rule.
Location & tenants
- Location reads 64/100 on livability (#782 in OH) — a middle-class / working-renter tenant base. Strengths: cost of living A+, housing A+, crime A-; Watch: schools F, amenities F, commute F.
- Mt Healthy City (suburban): math 12% / reading 24% proficiency, ranked #636 of 656 in OH (top 97%) — low school quality limits family demand, transient renter base, plan for 1-2y turnover; 75% free/reduced lunch — lower-income household profile, screen leases tightly.
- Market conditions: Rents rising (+3.3%/yr); 42 active listings in the ZIP; 5 comparable units currently listed for rent nearby; rentals leasing fast (median 2d on market — plan ~1-2 weeks tenant-placement turnaround); 801 units permitted in Hamilton County in 2024 (190 in 5+ unit buildings).
Forward outlook
- Local home prices are declining (-3.0%/yr); year-one equity from $1k of loan paydown is wiped out by about $6k of value loss. Plan a longer hold.
Negotiation context
- It's been on market 108 days — a 9% lower offer ($193k) is reasonable based on typical stale-listing flexibility.
- 3 sale attempts since 23y ago; this cycle's ask is 17206% above the opening price — seller raised mid-cycle; expect resistance to lowballs.
- Current owner paid $183k; 16% above their basis — modest negotiation headroom, anchor on the comps not their cost.
Questions for the listing agent
- What do current leases actually rent for vs. the listed asking? Can we see a recent rent roll and the last 12 months of T-12 income?
- It's been on market 108 days. Have you received any prior offers? Is the seller open to a 19% concession, seller financing, or rate buy-down credit?
- Built in 1962 — when were the roof, HVAC, electrical panel, plumbing, and water heater last replaced?
- Why hasn't it sold? Are there any deal-killer items the seller is aware of (foundation, flood, title, zoning, code violations)?
- Is there a deadline driving the sale (1031 exchange, divorce, estate, relocation)? That informs how much negotiation room exists.
- Schools are F-rated, which usually means shorter tenancies and higher turnover. Who's the typical renter profile here, and what's been the actual vacancy rate?
- The area grade is low — what's the realistic commute time and amenity access for the typical tenant pool here? Any planned neighborhood developments (good or bad) we should know about?
- What's the average days-on-market for RENTAL listings here right now (not sales)? A rising rental-DOM trend means longer vacancies and softer asking-rent achievability than the comps imply.
- What's the recent tenant-quality profile in this submarket — average credit score on applications, eviction rate, late-payment / NSF rate, and stable-employment percentage? A property-management company in the area should have these aggregated.
- How much new for-sale + rental construction is in the pipeline within 1–3 miles? Heavy new supply typically softens prices + rents 12–24 months out; constrained supply supports both.
Investment metrics
- 1% rule
- 0.81% ✗
- Cap rate
- 6.19%
- Cash-on-cash
- -0.36%
- DSCR
- 0.98
- GRM
- 10.3
CMA / ARV
- ARV (on-the-fly)
- $209,420
- Comps found
- 12
Show comp detail 12 sales within ~0.75 mi
| Address | Dist | Beds/Ba | Sqft | Sold | Price | $/sf | Match |
|---|---|---|---|---|---|---|---|
| 1990 Bluehill Dr | 0.25mi | 3/1.5 | 1,025 (-10%) | 0mo | $180,000 | $176 | 72 |
| 1834 Aspenhill Dr | 0.05mi | 3/1.0 | 1,000 (-12%) | 6mo | $185,000 | $185 | 71 |
| 1890 Lotushill Dr | 0.17mi | 3/1.0 | 1,000 (-12%) | 4mo | $189,999 | $190 | 67 |
| 1819 Aspenhill Dr | 0.09mi | 3/1.0 | 1,000 (-12%) | 8mo | $180,000 | $180 | 67 |
| 1825 Aspenhill Dr | 0.08mi | 3/1.0 | 1,000 (-12%) | 10mo | $195,000 | $195 | 66 |
| 1934 Windmill Way | 0.27mi | 3/1.0 | 1,025 (-10%) | 9mo | $168,000 | $164 | 62 |
| 10592 Mill Rd | 0.51mi | 2/2.0 (-1) | 1,118 (-1%) | 10mo | $214,000 | $191 | 59 |
| 10410 Maria Ave | 0.52mi | 3/1.0 | 1,212 (+7%) | 5mo | $231,000 | $191 | 58 |
| 10493 Mill Rd | 0.57mi | 3/3.0 | 1,189 (+5%) | 2mo | $310,000 | $261 | 58 |
| 2074 Roosevelt Ave | 0.40mi | 3/1.0 | 1,275 (+13%) | 4mo | $177,500 | $139 | 55 |
| 10731 Valiant Dr | 0.75mi | 3/1.0 | 1,194 (+6%) | 0mo | $209,000 | $175 | 54 |
| 2333 Merriway Ln | 0.69mi | 3/1.0 | 1,040 (-8%) | 10mo | $177,500 | $171 | 44 |
Match score weights: distance 35% · size 25% · config 20% · recency 20%. Top-matched comps best support the ARV.
Projected returns pro-forma
-3.0% appreciation · 3.3% rent growth · sell at horizon
- IRR
- -16.6%
- Equity multiple
- 0.41×
- Total profit
- $-35,001
- Equity at exit
- $31,610
- IRR
- -7.9%
- Equity multiple
- 0.50×
- Total profit
- $-29,933
- Equity at exit
- $18,330
Cash invested: $59,360 (down + closing). Projections, not guarantees.
Landlord ↔ Tenant lean methodology
- Overall (STATE)
- 73 Landlord-Friendly
- State Ohio
- 73 Landlord-Friendly · R+6
- County
- — inherits STATE
- City
- — inherits STATE
ZIP-level market 45240
- Rents YoY
- 3.3%
- Active inventory
- 42
- Price-to-rent
- 10.3×
Monthly cashflow live
- Estimated rent
- $1,711 high interval (Pro) →
- Mortgage (P&I)
- −$1,112
- Tax from tax record
- −$169 /mo · $2,032/yr
- Insurance
- −$88
- HOA
- −$0
- Vacancy / Maint / Mgmt
- −$359
- Net cashflow
- $-18
Break-even live
UW: 25.0% down · 7.5% · 30yr · 1.5% tax · 5.0% vac · 8.0% maint · 8.0% mgmt
Financing live
Cash to close
- Down payment
- $53,000
- Closing costs
- $6,360
- Reserves months
- —
- Total cash needed
- —
Loan-product check · same deal, 3 products live
Conventional
25% down · 7.5% · 30yr
- Down + closing
- —
- Monthly P&I
- —
- Monthly cashflow
- —
- DSCR
- —
- Eligible?
- —
Personal DTI + credit; lowest rate.
DSCR
20% down · 8.5% · 30yr
- Down + closing
- —
- Monthly P&I
- —
- Monthly cashflow
- —
- DSCR
- —
- Eligible?
- —
No personal income docs; deal must DSCR.
Hard money
10% down · 12.0% · 12mo
- Down + closing
- —
- Monthly P&I
- —
- Monthly cashflow
- —
- DSCR
- —
- Eligible?
- —
Short-term bridge; refi at stabilization.
Rent comps 5 comps
| Address | Beds | Baths | Sqft | Rent | $/sqft | DOM | Units | Dist |
|---|---|---|---|---|---|---|---|---|
| 11060 Quailwood Dr Cincinnati, OH | 1.0–2.0 | 1.0–2.0 | 702 | $1,226 | $1.75 | 1d | 3 | 0.74mi |
| 2096 Quail Ct Cincinnati, OH | 1.0–2.0 | 1.0–1.5 | 725 | $1,238 | $1.71 | 1d | 4 | 0.77mi |
| 2300 Walden Glen Cir Cincinnati, OH | 1.0–3.0 | 1.0–1.5 | 830 | $1,599 | $1.93 | 1d | 9 | 0.89mi |
| 2753 Town Terrace Dr Cincinnati, OH | 2.0–3.0 | 1.0–1.5 | 968 | $1,450 | $1.50 | 21d | 4 | 1.29mi |
| 2504 Houston Rd Cincinnati, OH | 2.0 | 2.0 | 1105 | $2,995 | $2.71 | 1d | 1 | 1.33mi |
Listing history 27 events
-
2026-06-18days on market $212,000 Active 108 DOM
-
2026-06-17days on market $212,000 Active 107 DOM
-
2026-06-16days on market $212,000 Active 106 DOM
-
2026-06-15days on market $212,000 Active 105 DOM
-
2026-06-13days on market $212,000 Active 103 DOM
-
2026-06-13days on market $212,000 Active 102 DOM
-
2026-06-09days on market $212,000 Active 99 DOM
-
2026-06-08days on market $212,000 Active 98 DOM
-
2026-06-07days on market $212,000 Active 97 DOM
-
2026-06-05days on market $212,000 Active 94 DOM
-
2026-06-03days on market $212,000 Active 93 DOM
-
2026-06-02days on market $212,000 Active 92 DOM
-
2026-06-01days on market $212,000 Active 91 DOM
-
2026-05-31days on market $212,000 Active 90 DOM
-
2026-04-09price $212,000
-
2026-03-20historical $1,225
-
2026-03-18$1,225
-
2026-03-02$216,000 Active
-
2026-02-05soldstatus $182,700
-
2003-06-19soldstatus $82,000
-
2003-06-12soldstatus $82,000 206-char remark
Show marketing remark (206 chars)
Remodeled brick ranch tucked away in cul-de-sac. Garage converted to part storage area- part fam rm, could be 4th BR. New carpet, paint, flooring, kitchen counterw/double deep sinks. Fenced yard & patio
-
2003-04-07$82,900 206-char remark
Show marketing remark (206 chars)
Remodeled brick ranch tucked away in cul-de-sac. Garage converted to part storage area- part fam rm, could be 4th BR. New carpet, paint, flooring, kitchen counterw/double deep sinks. Fenced yard & patio
-
1992-09-02soldstatus $37,500
-
1991-05-15soldstatus $35,000
-
1989-12-22soldstatus $44,000
-
1986-09-05soldstatus $37,427
-
1985-01-15soldstatus $36,930
ⓘ Source: listings_history table (triggers on properties + properties_extension) + one-shot
backfill from property_details.listing_events for pre-trigger history.
Tax reassessment forecast OH · Partial reset (capped growth)
- Current annual tax
- $2,032 · $169/mo
- Projected year-2 tax
- $2,670 · $222/mo
- Expected delta
- +$638/yr (+$53/mo · 31.4%)
ⓘ Screening estimate from a state-policy table — verify with the county assessor before closing.
Climate risk First Street
- Flood 1/10 Low FEMA zone X (unshaded) · 0% chance over 30 yrs
- Wildfire 1/10 Low
- Heat 4/10 Moderate 7 d/yr ≥103°F today · 19 d/yr by 30 yrs out
- Wind 2/10 Low 100% chance of damaging wind over 30 yrs
- Air quality 4/10 Moderate 4 unhealthy d/yr today · 6 by 30 yrs out
Nearby sold comps map
Loading sold comps map…
Walkable amenities ~0.75 mi
Loading nearby amenities…
Taxation est. · year 1
- Rental income
- $20,531
- − Mortgage interest
- −$11,875
- − Property taxes
- −$2,032
- − Insurance
- −$1,060
- − Repairs & maintenance
- −$1,642
- − Management
- −$1,642
- − Depreciation
- −$6,167
- Taxable loss
- −$3,888
- Est. tax savings @ 24.0%
- +$933
- After-tax cash flow
- $720/yr
For passive investors: Depreciation is non-cash, so a rental often shows a tax loss while cash-flowing — sheltering income. Rental losses are passive: they offset passive income freely, and up to $25,000/yr can offset ordinary (W-2) income if you actively participate and your MAGI is under $100k (phasing out to $0 by $150k); unused losses carry forward. On sale, claimed depreciation is recaptured at up to 25%, and gains may owe capital-gains tax (a 1031 exchange can defer both). Figures are a year-1 estimate at your 24.0% rate — not tax advice; consult a CPA.
Schools (NCES district)
- District
- Mt Healthy City
- NCES district ID
- 3904441
- Math proficiency
- 12% ▼ -21.00%
- Reading proficiency
- 24% ▼ -9.00%
- Median HH income
- $42,699
- Composite
- 15.51/100
- National rank
- #9303
- State rank
- #636 of 656 in OH
Livability — New Burlington
- Score
- 64/100
- State rank
- #782
- US rank
- #14211
Category grades
Schools grade is shown separately in the Schools card above.
Census & demographics
- Census place
- New Burlington, OH
- County
- Hamilton County · 701,295 people
- Metro
- Cincinnati, OH-KY-IN
- Population (ZIP)
- 29,600
- Household income
- $71,947
- Rent vs Own
- Severe rent burden
- 693.0
Population outlook (Hamilton County) Hauer SSP2
- Today (2025)
- 826,054 people
- By 2030
- 830,947 · +0.6%
- By 2040
- 832,319 · +0.8%
- By 2050
- 822,428 · -0.4%
- By 2075
- 788,688 · -4.5%
- By 2100
- 710,674 · -14.0%
Race, ethnicity, and origin ACS 2023
- Neighborhood character
- Diverse neighborhood (Simpson 0.59)
- Race & ethnicity
- Black 59% White 25% Hispanic / Latino 8% Two or more races 5% Asian 4%
- Hispanic origin (detail)
- Mexican 2%
- Common ancestry
- Lithuanian 1% Romanian 1%
- Foreign-born
- 13% · Canada, India, China
- Languages at home
- 85% English-only · Spanish 6% French/Haitian/Cajun 3% Other Indo-European 2%
Political lean MEDSL · Hamilton
- 2024 margin
- D (+14.9) · D 57.0% · R 42.1%
- 2008→2024 swing
- +7.9pp toward D · 2008: 7.0pp · 2024: 14.9pp
- All cycles
- 2024: D+14.9 2020: D+15.9 2016: D+9.5 2012: D+4.9 2008: D+7.0
Not yet ingested
- Civics
- —
Market trends
- HPI YoY
- ▼ -209.84%
- Current HPI
- 246.1355
- Rent YoY
- ▲ 3.30%
- Metro
- Cincinnati, OH-KY-IN
- State GDP YoY
- ▲ 1.98%
- F500 in state
- 48
Industry mix (Fortune 500 HQ in OH)
| Industry | F500 HQs | Revenue |
|---|---|---|
| Insurance | 3 | $145B |
|
||
| Industrial Machinery | 3 | $49B |
|
||
| Financial Services | 3 | $24B |
|
||
| Consumer Goods | 2 | $93B |
|
||
| Aerospace / Defense | 2 | $47B |
|
||
| Utilities | 2 | $33B |
|
||
Price history
+474.1% since first listed13 events — show timeline
- 2026-04-09 Price Changed $212,000 Cincy MLS
- 2026-03-20 Rental Removed $1,225 RENTSPREE
- 2026-03-18 Listed for Rent $1,225 RENTSPREE
- 2026-03-02 Listed $216,000 Cincy MLS
- 2026-02-05 Sold (Public Records) $182,700 Public Records
- 2003-06-19 Sold (Public Records) $82,000 Public Records
- 2003-06-12 Sold (MLS) $82,000 Cincy MLS
- 2003-04-07 Listed $82,900 Cincy MLS
- 1992-09-02 Sold (Public Records) $37,500 Public Records
- 1991-05-15 Sold (Public Records) $35,000 Public Records
- 1989-12-22 Sold (Public Records) $44,000 Public Records
- 1986-09-05 Sold (Public Records) $37,427 Public Records
- 1985-01-15 Sold (Public Records) $36,930 Public Records
Property tax history
+1.6%/yrLatest (2025): $2,032 · -1.9% YoY. Source: county tax records.
Cash-flow waterfall
monthlySold comps — $/sqft
last 12 mo · ≤1 miLoading sold comps…