6228 Taramore Ln · Huntsville, AL
Flood risk No data
- FEMA flood zone
- —
- Chance of flooding over 30 yrs
- —
- Est. flood insurance / yr
- —
Fire risk No data
- Est. fire insurance / yr
- —
Heat risk No data
- Hot days now (above threshold)
- —
- Hot days in 30 yrs
- —
Wind risk No data
- Chance of severe wind over 30 yrs
- —
Air-quality risk No data
- Unhealthy air days now
- —
- Unhealthy air days in 30 yrs
- —
Risk factors via First Street. Map © Google.
Why this score? — see what drove the D grade
The composite is a weighted blend of 9 inputs, each scored 0–100. Each bar is that input's sub-score; the figure is the points it added to the 100-point composite (weight × sub-score).
- Appreciation +10.0/10.0
- ARV discount +8.3/15.0
- Cash flow +6.9/30.0
- Livability +4.1/5.0
- Rent growth +3.1/5.0
- Schools +2.9/10.0
- Condition / age +2.5/5.0
- 1% rule +2.0/10.0
- DSCR +1.1/10.0
$259,850
🖨 Deal sheet (PDF) 📄 Offer letter ✓ Due diligence
Listing remarks
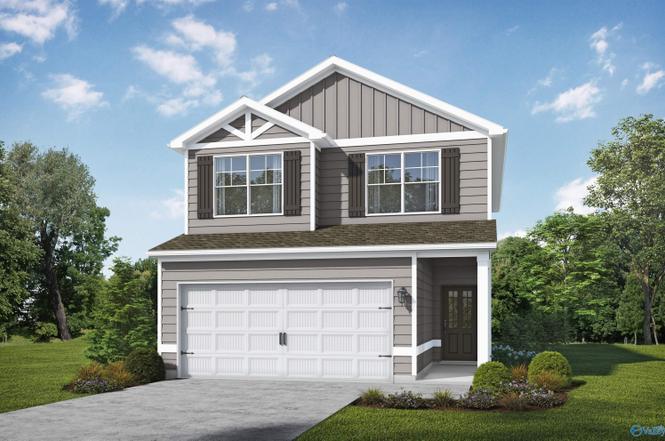
Under Construction-The Marlin is a masterpiece of entertaining. Host game day around the quartz kitchen island without missing a play, or take the party to the patio for a cookout. Retreat upstairs to a luxurious primary suite featuring a deep soaking tub for ultimate relaxation. Two additional bedrooms with elegant trey ceilings offer stylish comfort for family or guests. Complete with a spacious 2-car garage for your vehicles and gear, the Marlin perfectly balances social energy with private serenity. Visuals feature a similar home for inspiration. Pricing is the base starting point; final price varies based on upgrades and features selected.
Key facts
- Patio for a cookout
- Deep soaking tub
- 5,075 sq ft lot
Tags
Neighborhood map
What this means for you Summary
Snapshot
- This is a 3-bed/2.5-bath single-family listed at $260k.
Deal economics
- At list price, monthly cash flow is $-392 ($-5k/yr) — negative.
- To cash-flow at today's rent, offer at most $203k (21.9% below list).
- To meet the 1% rule (rent ≥ 1% of price), the offer needs to be $182k (30.0% below list).
- Recommended offer: $182k (30.0% below list) — sets the bar for 1% rule.
Location & tenants
- Location reads 82/100 on livability (#3 in AL, #1,082 nationally) — a professional / high-income tenant draw. Strengths: commute A+, cost of living A+, housing A+; Watch: crime F.
- Huntsville City (urban): math 21% / reading 46% proficiency, ranked #48 of 129 in AL (top 37%) — families likely to look elsewhere, expect single-tenant / working-renter base with shorter leases.
- Zoned schools: Providence Elementary (math 14% / reading 42%, grade F, #385 of 627 statewide, top 62%, 848 students, 52% FRL); Williams Middle School (math 16% / reading 50%, grade F, #101 of 257 statewide, top 40%, 548 students, 58% FRL); Columbia High School (math 12% / reading 17%, grade F, #220 of 305 statewide, top 77%, 954 students, 50% FRL).
- Market conditions: Rents rising (+2.6%/yr); 216 active listings in the ZIP; 14 comparable units currently listed for rent nearby; rentals at typical pace (median 26d on market — plan ~3-4 weeks tenant-placement turnaround); solid renter incomes; 4,709 units permitted in Madison County in 2024 (1,186 in 5+ unit buildings).
Forward outlook
- In year one you build about $28k of equity ($2k loan paydown + $26k appreciation (10.0% local appreciation)).
- Madison County population projected at +18% by 2050 — long-run rental-demand tailwind backs the buy-and-hold thesis.
- By year 2, paydown + projected appreciation supports a ~$45k cash-out refi (75% LTV) — recoverable capital for the next deal without selling this one.
Negotiation context
- It's been on market 45 days — a 3% lower offer ($252k) is reasonable based on typical stale-listing flexibility.
Questions for the listing agent
- What do current leases actually rent for vs. the listed asking? Can we see a recent rent roll and the last 12 months of T-12 income?
- It's been on market 45 days. Have you received any prior offers? Is the seller open to a 30% concession, seller financing, or rate buy-down credit?
- What does the HOA fee cover, when was the last increase, and are there any pending special assessments or reserve-fund shortfalls?
- Is there a deadline driving the sale (1031 exchange, divorce, estate, relocation)? That informs how much negotiation room exists.
- Crime grade is F in this area — have there been break-ins, vandalism, or insurance claims at this property in the last 3 years? What carrier currently insures it and at what premium?
- The area grade is low — what's the realistic commute time and amenity access for the typical tenant pool here? Any planned neighborhood developments (good or bad) we should know about?
- What's the average days-on-market for RENTAL listings here right now (not sales)? A rising rental-DOM trend means longer vacancies and softer asking-rent achievability than the comps imply.
- What's the recent tenant-quality profile in this submarket — average credit score on applications, eviction rate, late-payment / NSF rate, and stable-employment percentage? A property-management company in the area should have these aggregated.
- How much new for-sale + rental construction is in the pipeline within 1–3 miles? Heavy new supply typically softens prices + rents 12–24 months out; constrained supply supports both.
Investment metrics
- 1% rule
- 0.70% ✗
- Cap rate
- 4.48%
- Cash-on-cash
- -6.47%
- DSCR
- 0.71
- GRM
- 11.9
CMA / ARV
- ARV (on-the-fly)
- $264,604
- Comps found
- 12
Show comp detail 12 sales within ~0.75 mi
| Address | Dist | Beds/Ba | Sqft | Sold | Price | $/sf | Match |
|---|---|---|---|---|---|---|---|
| 6225 Taramore Ln #88 | 0.02mi | 3/2.5 | 1,594 (0%) | 1mo | $261,250 | $164 | 98 |
| 6603 Shearleaf Rd NW | 0.19mi | 3/2.0 | 1,538 (-4%) | 2mo | $309,000 | $201 | 82 |
| 7040 Camrose Ln | 0.09mi | 3/2.0 | 1,504 (-6%) | 3mo | $288,500 | $192 | 82 |
| 6220 Taramore Ln | 0.01mi | 3/2.5 | 1,768 (+11%) | 1mo | $264,983 | $150 | 80 |
| 6003 Taramore Ln | 0.06mi | 4/2.0 (+1) | 1,545 (-3%) | 6mo | $265,000 | $172 | 80 |
| 6216 Taramore Ln NW | 0.37mi | 3/2.5 | 1,594 (0%) | 8mo | $264,062 | $166 | 76 |
| 7004 Ashton Springs Blvd | 0.18mi | 3/2.0 | 1,685 (+6%) | 5mo | $295,250 | $175 | 76 |
| 6032 Stonewater Ct | 0.13mi | 3/2.5 | 1,747 (+10%) | 4mo | $268,000 | $153 | 74 |
| 8216 Stone Mill Dr | 0.47mi | 3/2.0 | 1,622 (+2%) | 7mo | $320,000 | $197 | 67 |
| 7609 Ashor Dr NW | 0.52mi | 3/2.0 | 1,658 (+4%) | 6mo | $270,000 | $163 | 62 |
| 6215 Taramore Ln | 0.39mi | 3/2.5 | 1,768 (+11%) | 7mo | $259,850 | $147 | 58 |
| 7611 Ashor Dr NW | 0.50mi | 3/2.0 | 1,794 (+12%) | 5mo | $275,000 | $153 | 50 |
Match score weights: distance 35% · size 25% · config 20% · recency 20%. Top-matched comps best support the ARV.
Projected returns pro-forma
10.0% appreciation · 2.57% rent growth · sell at horizon
- IRR
- 19.6%
- Equity multiple
- 2.59×
- Total profit
- $115,789
- Equity at exit
- $234,093
- IRR
- 17.9%
- Equity multiple
- 5.94×
- Total profit
- $359,169
- Equity at exit
- $504,831
Cash invested: $72,758 (down + closing). Projections, not guarantees.
Landlord ↔ Tenant lean methodology
- Overall (STATE)
- 90 Strongly Landlord-Friendly
- State Alabama
- 90 Strongly Landlord-Friendly · R+15
- County
- — inherits STATE
- City
- — inherits STATE
ZIP-level market 35806
- Home prices YoY
- 20.0%
- Rents YoY
- 2.6%
- Active inventory
- 216
- Price-to-rent
- 11.9×
Monthly cashflow live
- Estimated rent
- $1,818 high interval (Pro) →
- Mortgage (P&I)
- −$1,363
- Tax est. 1.5%
- −$325 /mo · $3,898/yr
- Insurance
- −$108
- HOA
- −$33
- Vacancy / Maint / Mgmt
- −$382
- Net cashflow
- $-392
Break-even live
Sensitivity live
| Price | -10% $-213 | -5% $-303 | +0% $-392 | +5% $-482 | +10% $-572 |
|---|---|---|---|---|---|
| Rent | -10% $-536 | -5% $-464 | +0% $-392 | +5% $-321 | +10% $-249 |
| Rate | -1.0pp $-262 | -0.5pp $-326 | base $-392 | +0.5pp $-460 | +1.0pp $-528 |
UW: 25.0% down · 7.5% · 30yr · 1.5% tax · 5.0% vac · 8.0% maint · 8.0% mgmt
Financing live
Cash to close
- Down payment
- $64,962
- Closing costs
- $7,796
- Reserves months
- —
- Total cash needed
- —
Loan-product check · same deal, 3 products live
Conventional
25% down · 7.5% · 30yr
- Down + closing
- —
- Monthly P&I
- —
- Monthly cashflow
- —
- DSCR
- —
- Eligible?
- —
Personal DTI + credit; lowest rate.
DSCR
20% down · 8.5% · 30yr
- Down + closing
- —
- Monthly P&I
- —
- Monthly cashflow
- —
- DSCR
- —
- Eligible?
- —
No personal income docs; deal must DSCR.
Hard money
10% down · 12.0% · 12mo
- Down + closing
- —
- Monthly P&I
- —
- Monthly cashflow
- —
- DSCR
- —
- Eligible?
- —
Short-term bridge; refi at stabilization.
Rent comps 14 comps
| Address | Beds | Baths | Sqft | Rent | $/sqft | DOM | Units | Dist |
|---|---|---|---|---|---|---|---|---|
| 7203 Chatfield Way NW Huntsville, AL | 4.0 | 2.5 | 2047 | $1,799 | $0.88 | 45d | 1 | 0.18mi |
| 8223 Stone Mill Dr NW Huntsville, AL | 3.0 | 2.5 | 2046 | $2,300 | $1.12 | 45d | 1 | 0.43mi |
| 7601 Discovery Point Dr NW Huntsville, AL | 3.0 | 2.5 | 1720 | $1,720 | $1.00 | 45d | 1 | 0.56mi |
| 7599 Discovery Point Dr NW Huntsville, AL | 3.0 | 2.5 | 1500 | $1,720 | $1.15 | 25d | 1 | 0.57mi |
| 7597 Discovery Point Dr NW Huntsville, AL | 3.0 | 2.5 | 1550 | $1,800 | $1.16 | 25d | 1 | 0.57mi |
| 7589 Discovery Point Dr NW Huntsville, AL | 3.0 | 2.5 | 1500 | $1,720 | $1.15 | 25d | 1 | 0.59mi |
| 7582 Discovery Point Dr NW Huntsville, AL | 3.0 | 2.5 | 1500 | $1,720 | $1.15 | 25d | 1 | 0.60mi |
| 7559 Discovery Point Dr NW Huntsville, AL | 3.0 | 2.5 | 1555 | $2,450 | $1.58 | 15d | 1 | 0.66mi |
| 710 Nick Fitcheard Rd NW Huntsville, AL | 2.0 | 2.0 | 1200 | $1,359 | $1.13 | 15d | 7 | 0.69mi |
| 7502 Discovery Point Dr NW Huntsville, AL | 3.0 | 2.5 | 1626 | $1,825 | $1.12 | 45d | 1 | 0.77mi |
| 7500 Discovery Point Dr NW Huntsville, AL | 3.0 | 2.5 | 1527 | $1,822 | $1.19 | 15d | 7 | 0.79mi |
| 351 Lofton Rd NW Huntsville, AL | 4.0 | 2.5 | 2186 | $2,315 | $1.06 | 15d | 1 | 0.98mi |
| 1012 Scarlet Woods Huntsville, AL | 2.0 | 2.0 | 1626 | $1,699 | $1.04 | 23d | 1 | 1.48mi |
| 41 Addison Park Dr Huntsville, AL | 1.0–3.0 | 1.0–2.0 | 1155 | $1,635 | $1.42 | 15d | 45 | 1.48mi |
HOA detail
- Monthly dues
- $33 · $396/yr
Listing history 2 events
-
2026-04-27status Pending
-
2026-03-13$259,850 Active
ⓘ Source: listings_history table (triggers on properties + properties_extension) + one-shot
backfill from property_details.listing_events for pre-trigger history.
Nearby sold comps map
Loading sold comps map…
Walkable amenities ~0.75 mi
Loading nearby amenities…
Taxation est. · year 1
- Rental income
- $21,817
- − Mortgage interest
- −$14,556
- − Property taxes
- −$3,898
- − Insurance
- −$1,299
- − Repairs & maintenance
- −$1,745
- − Management
- −$1,745
- − HOA
- −$396
- − Depreciation
- −$7,559
- Taxable loss
- −$9,382
- Est. tax savings @ 24.0%
- +$2,252
- After-tax cash flow
- $-2,458/yr
For passive investors: Depreciation is non-cash, so a rental often shows a tax loss while cash-flowing — sheltering income. Rental losses are passive: they offset passive income freely, and up to $25,000/yr can offset ordinary (W-2) income if you actively participate and your MAGI is under $100k (phasing out to $0 by $150k); unused losses carry forward. On sale, claimed depreciation is recaptured at up to 25%, and gains may owe capital-gains tax (a 1031 exchange can defer both). Figures are a year-1 estimate at your 24.0% rate — not tax advice; consult a CPA.
Schools (NCES district)
- District
- Huntsville City
- NCES district ID
- 0101800
- Math proficiency
- 21% ▼ -23.00%
- Reading proficiency
- 46% ▬ 0.00%
- Median HH income
- $48,264
- Composite
- 28.84/100
- National rank
- #6647
- State rank
- #48 of 129 in AL
Livability — Huntsville
- Score
- 82/100
- State rank
- #3
- US rank
- #1082
Category grades
Schools grade is shown separately in the Schools card above.
Census & demographics
- Census place
- Huntsville, AL
- County
- Madison County · 380,832 people
- City population
- 220,435
- Metro
- Huntsville, AL
- Population (ZIP)
- 29,161
- Household income
- $86,768
- Rent vs Own
- Severe rent burden
- 1249.0
Population outlook (Madison County) Hauer SSP2
- Today (2025)
- 392,086 people
- By 2030
- 409,788 · +4.5%
- By 2040
- 440,557 · +12.4%
- By 2050
- 460,990 · +17.6%
- By 2075
- 502,872 · +28.3%
- By 2100
- 513,623 · +31.0%
Race, ethnicity, and origin ACS 2023
- Neighborhood character
- Diverse neighborhood (Simpson 0.57)
- Race & ethnicity
- White 58% Black 30% Hispanic / Latino 5% Two or more races 5% Asian 4%
- Hispanic origin (detail)
- Mexican 2% Puerto Rican 2%
- Common ancestry
- Slovak 2% Italian 2% Serbian 2%
- Foreign-born
- 7% · Canada, Vietnam, China
- Languages at home
- 93% English-only · Spanish 2% Other Indo-European 1% Other Asian/Pacific 1%
Political lean MEDSL · Madison
- 2024 margin
- Lean R (+9.0) · D 44.7% · R 53.7% · Other 1.6%
- 2008→2024 swing
- +6.0pp toward D · 2008: -14.9pp · 2024: -9.0pp
- All cycles
- 2024: R+9.0 2020: R+8.0 2016: R+16.8 2012: R+18.7 2008: R+14.9
Not yet ingested
- Civics
- —
Market trends
- HPI YoY
- ▲ 71.67%
- Current HPI
- 430.5866
- Rent YoY
- ▲ 2.57%
- Metro
- Huntsville, AL
- State GDP YoY
- ▲ 2.94%
- F500 in state
- 4
Industry mix (Fortune 500 HQ in AL)
| Industry | F500 HQs | Revenue |
|---|---|---|
| Financial Services | 1 | $8B |
|
||
| Healthcare | 1 | $5B |
|
||
Price history
2 events — show timeline
- 2026-04-27 Pending — VMLS
- 2026-03-13 Listed $259,850 VMLS
Cash-flow waterfall
monthlySold comps — $/sqft
last 12 mo · ≤1 miLoading sold comps…