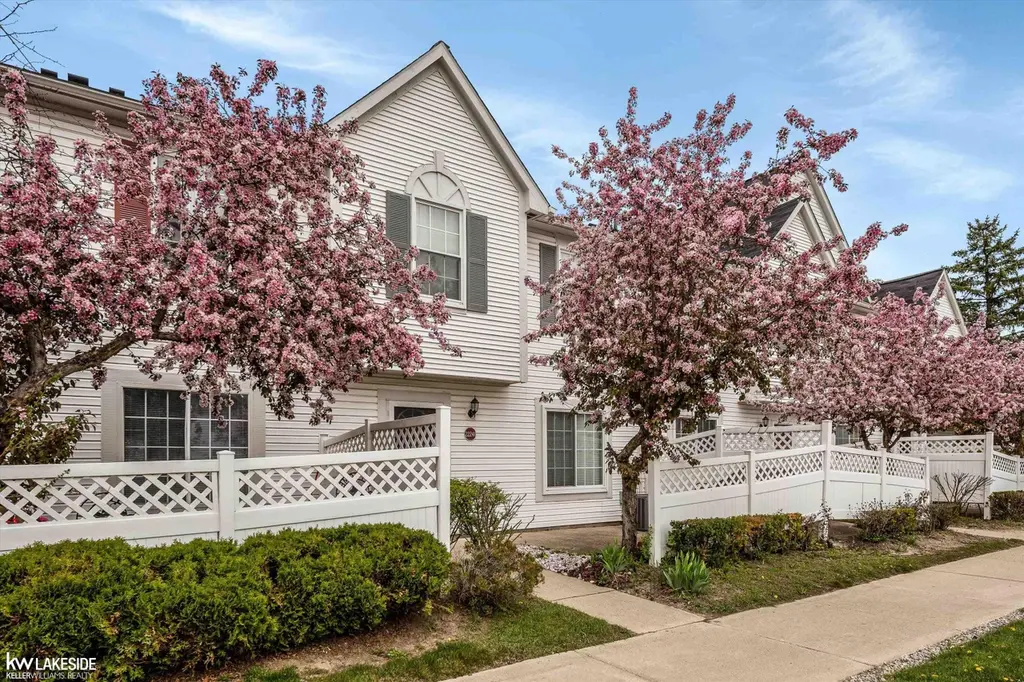
22241 Atlantic · Farmington Hills, MI
Flood risk 1/10 · Minimal
- FEMA flood zone
- X (unshaded)
- Chance of flooding over 30 yrs
- 0.0%
- Est. flood insurance / yr
- $507 – $1,088
Fire risk 1/10 · Minimal
- Est. fire insurance / yr
- $784 – $1,456
Heat risk 3/10 · Minor
- Hot days now (above 97°F)
- 7 days/yr
- Hot days in 30 yrs
- 15 days/yr
Wind risk 2/10 · Minimal
- Chance of severe wind over 30 yrs
- —
Air-quality risk 3/10 · Minor
- Unhealthy air days now
- 2 days/yr
- Unhealthy air days in 30 yrs
- 4 days/yr
Risk factors via First Street. Map © Google.
Why this score? — see what drove the D- grade
The composite is a weighted blend of 9 inputs, each scored 0–100. Each bar is that input's sub-score; the figure is the points it added to the 100-point composite (weight × sub-score).
- ARV discount +7.5/15.0
- Cash flow +6.9/30.0
- Rent growth +5.0/5.0
- Schools +4.6/10.0
- 1% rule +4.3/10.0
- Livability +4.0/5.0
- Condition / age +4.0/5.0
- DSCR +1.1/10.0
- Appreciation +0.0/10.0
$155,000
🖨 Deal sheet (PDF) 📄 Offer letter ✓ Due diligence
Listing remarks
Welcome to this well-maintained ground-floor condo featuring newer carpeting and a desirable private entrance. The home offers two spacious bedrooms, each with its own full en-suite bathroom, providing comfort and privacy. Enjoy the convenience of in-unit laundry, a first-floor guest lavatory, and a fully equipped kitchen with all appliances included-highlighted by a newer stove and microwave. Residents of the community enjoy access to a clubhouse and swimming pool, along with assigned carport parking and additional guest parking. The association fee includes water, lawn care, exterior maintenance, and snow removal, making for easy, low-maintenance living. Ideally located close to shopping,
Key facts
- Guest parking
- In-unit laundry
- Swimming pool
Tags
Property features AI
Finance
- HOA & community: Homeowners association with monthly fee of $305
Exterior
- Parking: 2-car garage; Carport
- Utilities: Public water; Public sewer
- Home design: Residential condominium; Two levels
- Construction: Vinyl siding; Slab foundation
- Exterior features: No pool; Pets allowed (contact for details)
Interior
- Kitchen: Dishwasher; Microwave; Oven; Range; Refrigerator
- Bathrooms: 2 full bathrooms; 1 half bathroom
- Heating & cooling: Forced air heating (natural gas); Central air conditioning
- Interior features: Gas water heater; Dishwasher; Dryer; Microwave; Oven; Refrigerator; Range; Washer
- Laundry & utility: Washer; Dryer
Neighborhood map
What this means for you Summary
Snapshot
- This is a 2-bed/2.5-bath condo listed at $155k. Condition is rated good.
Deal economics
- At list price, monthly cash flow is $-236 ($-3k/yr) — negative.
- To cash-flow at today's rent, offer at most $121k (22.0% below list).
- To meet the 1% rule (rent ≥ 1% of price), the offer needs to be $144k (6.9% below list).
- Recommended offer: $121k (22.0% below list) — sets the bar for cash-flow.
- Cap rate 4.5% vs local median 3.4% in Farmington Hills — top-decile yield for the area; either an underpriced asset or a hidden risk that comps aren't pricing in. Stress-test before assuming the spread holds.
Location & tenants
- Location reads 81/100 on livability (#64 in MI, #1,364 nationally) — a professional / high-income tenant draw. Strengths: employment A+, housing A+, crime A; Watch: amenities D, health & safety F.
- Farmington Public School District (urban): math 45% / reading 58% proficiency, ranked #78 of 540 in MI (top 14%) — acceptable for families but not a draw, mixed tenant base, ~2y average lease; only 19% free/reduced lunch — higher-income household profile.
- Zoned schools: Gill Elementary School (math 42% / reading 42%, grade F, #547 of 1,397 statewide, top 41%, 485 students, 31% FRL); Power Middle School (math 42% / reading 60%, grade C, #106 of 493 statewide, top 22%, 605 students, 29% FRL); Farmington High School (math 49% / reading 75%, grade B-, #58 of 713 statewide, top 9%, 1,400 students, 30% FRL).
- Market conditions: Rents rising fast (+10.8%/yr); 157 active listings in the ZIP; 12 comparable units currently listed for rent nearby; rentals at typical pace (median 15d on market — plan ~3-4 weeks tenant-placement turnaround); solid renter incomes; 2,614 units permitted in Oakland County in 2024 (721 in 5+ unit buildings).
Forward outlook
- Local home prices are declining (-3.0%/yr); year-one equity from $1k of loan paydown is wiped out by about $5k of value loss. Plan a longer hold.
- Oakland County population projected at +10% by 2050 — modest demand growth; plan on rents tracking national, not racing it.
Negotiation context
- It's been on market 43 days — a 3% lower offer ($150k) is reasonable based on typical stale-listing flexibility.
- 2 sale attempts with the ask held roughly flat each time — persistent listings suggest the price (not the market) is what's stuck; bring a comps-based counter.
Risks & watch-outs
- Watch-outs: HOA is 21% of rent.
Questions for the listing agent
- What do current leases actually rent for vs. the listed asking? Can we see a recent rent roll and the last 12 months of T-12 income?
- It's been on market 43 days. Have you received any prior offers? Is the seller open to a 22% concession, seller financing, or rate buy-down credit?
- What does the HOA fee cover, when was the last increase, and are there any pending special assessments or reserve-fund shortfalls?
- Any open or pending special assessments — roof, HVAC, plumbing, elevator, façade? What's the per-unit balance and payoff schedule, and is the seller paying it off at close or rolling it to the buyer?
- Is there a deadline driving the sale (1031 exchange, divorce, estate, relocation)? That informs how much negotiation room exists.
- Schools are B-rated — typically a magnet for longer-tenancy family renters. What's the average tenant stay here, and is there a school-zone premium baked into asking?
- The area grade is low — what's the realistic commute time and amenity access for the typical tenant pool here? Any planned neighborhood developments (good or bad) we should know about?
- What's the average days-on-market for RENTAL listings here right now (not sales)? A rising rental-DOM trend means longer vacancies and softer asking-rent achievability than the comps imply.
- What's the recent tenant-quality profile in this submarket — average credit score on applications, eviction rate, late-payment / NSF rate, and stable-employment percentage? A property-management company in the area should have these aggregated.
- How much new apartment / multifamily construction is in the pipeline within 1–3 miles? Heavy new supply (>2% of stock underway) typically softens rents 12–24 months out; light construction supports rent growth.
Investment metrics
- 1% rule
- 0.93% ✗
- Cap rate
- 4.47%
- Cash-on-cash
- -6.53%
- DSCR
- 0.71
- GRM
- 9.0
CMA / ARV
No comps found within radius.
Projected returns pro-forma
-3.0% appreciation · 8.0% rent growth · sell at horizon
- IRR
- -20.3%
- Equity multiple
- 0.26×
- Total profit
- $-32,316
- Equity at exit
- $23,111
- IRR
- -3.2%
- Equity multiple
- 0.72×
- Total profit
- $-11,937
- Equity at exit
- $13,402
Cash invested: $43,400 (down + closing). Projections, not guarantees.
Landlord ↔ Tenant lean methodology
- Overall (STATE)
- 62 Landlord-Friendly
- State Michigan
- 62 Landlord-Friendly · EVEN
- County
- — inherits STATE
- City
- — inherits STATE
ZIP-level market 48336
- Rents YoY
- 10.8%
- Active inventory
- 157
- Price-to-rent
- 9.0×
Monthly cashflow live
- Estimated rent
- $1,443 high interval (Pro) →
- Mortgage (P&I)
- −$813
- Tax est. 1.5%
- −$194 /mo · $2,325/yr
- Insurance
- −$65
- HOA
- −$305
- Vacancy / Maint / Mgmt
- −$303
- Net cashflow
- $-236
Break-even live
Sensitivity live
| Price | -10% $-129 | -5% $-183 | +0% $-236 | +5% $-290 | +10% $-343 |
|---|---|---|---|---|---|
| Rent | -10% $-350 | -5% $-293 | +0% $-236 | +5% $-179 | +10% $-122 |
| Rate | -1.0pp $-158 | -0.5pp $-197 | base $-236 | +0.5pp $-276 | +1.0pp $-317 |
UW: 25.0% down · 7.5% · 30yr · 1.5% tax · 5.0% vac · 8.0% maint · 8.0% mgmt
Financing live
Cash to close
- Down payment
- $38,750
- Closing costs
- $4,650
- Reserves months
- —
- Total cash needed
- —
Loan-product check · same deal, 3 products live
Conventional
25% down · 7.5% · 30yr
- Down + closing
- —
- Monthly P&I
- —
- Monthly cashflow
- —
- DSCR
- —
- Eligible?
- —
Personal DTI + credit; lowest rate.
DSCR
20% down · 8.5% · 30yr
- Down + closing
- —
- Monthly P&I
- —
- Monthly cashflow
- —
- DSCR
- —
- Eligible?
- —
No personal income docs; deal must DSCR.
Hard money
10% down · 12.0% · 12mo
- Down + closing
- —
- Monthly P&I
- —
- Monthly cashflow
- —
- DSCR
- —
- Eligible?
- —
Short-term bridge; refi at stabilization.
Rent comps 12 comps
| Address | Beds | Baths | Sqft | Rent | $/sqft | DOM | Units | Dist |
|---|---|---|---|---|---|---|---|---|
| 23085 Floral St Farmington, MI | 2.0 | 1.0 | 950 | $1,495 | $1.57 | 13d | 1 | 0.54mi |
| 23237 Tulane Ave Farmington Hills, MI | 3.0 | 1.5 | 1104 | $2,000 | $1.81 | 13d | 1 | 0.68mi |
| 23210 Middlebelt Rd Unit 108 Farmington Hills, MI | 1.0 | 1.0 | 750 | $1,195 | $1.59 | 7d | 1 | 0.71mi |
| 23210 Middlebelt Rd Unit 205 Farmington Hills, MI | 1.0 | 1.0 | 750 | $1,195 | $1.59 | 13d | 1 | 0.71mi |
| 23210 Middlebelt Rd Farmington Hills, MI | 1.0 | 1.0 | 750 | $1,195 | $1.59 | 14d | 1 | 0.71mi |
| 23210 Middlebelt Rd Unit 206 Farmington Hills, MI | 1.0 | 1.0 | 750 | $1,195 | $1.59 | 45d | 1 | 0.71mi |
| 23812 Middlebelt Rd Farmington Hills, MI | 1.0 | 1.0 | 750 | $1,110 | $1.48 | 45d | 1 | 0.95mi |
| 28532 Grayling Ave Farmington Hills, MI | 2.0 | 1.0 | 700 | $1,395 | $1.99 | 26d | 1 | 1.13mi |
| 31200 Morlock St Livonia, MI | 1.0–2.0 | 1.0 | 900 | $1,505 | $1.67 | 1d | 12 | 1.20mi |
| 27883 Independence St Farmington Hills, MI | 1.0 | 1.0 | 750 | $975 | $1.30 | 26d | 1 | 1.23mi |
| 23611 Bicking Ct Farmington, MI | 3.0 | 1.0 | 1117 | $2,100 | $1.88 | 45d | 1 | 1.27mi |
| 33203 N Manor Dr Farmington, MI | 1.0–2.0 | 1.0 | 855 | $1,454 | $1.70 | 0d | 13 | 1.44mi |
HOA detail condo
- Monthly dues
- $305 · $3,660/yr
- Likely covers
- waterlandscapingsnow removalexterior maint.pool
- Assessments
- None detected in remarks — confirm with the listing agent.
Listing history 13 events
-
2026-06-15statusdays on market $155,000 Pending 43 DOM
-
2026-06-13days on market $155,000 Active 42 DOM
-
2026-06-13days on market $155,000 Active 41 DOM
-
2026-06-09days on market $155,000 Active 38 DOM
-
2026-06-08days on market $155,000 Active 37 DOM
-
2026-06-07days on market $155,000 Active 36 DOM
-
2026-06-04days on market $155,000 Active 33 DOM
-
2026-06-02days on market $155,000 Active 31 DOM
-
2026-06-01days on market $155,000 Active 30 DOM
-
2026-05-31days on market $155,000 Active 29 DOM
-
2026-05-07status Active 804-char remark
-
2026-04-26status Pending 804-char remark
-
2026-04-21$155,000 Active 804-char remark
ⓘ Source: listings_history table (triggers on properties + properties_extension) + one-shot
backfill from property_details.listing_events for pre-trigger history.
Climate risk First Street
- Flood 1/10 Low FEMA zone X (unshaded) · 0% chance over 30 yrs
- Wildfire 1/10 Low
- Heat 3/10 Moderate 7 d/yr ≥97°F today · 15 d/yr by 30 yrs out
- Wind 2/10 Low
- Air quality 3/10 Moderate 2 unhealthy d/yr today · 4 by 30 yrs out
Nearby sold comps map
Loading sold comps map…
Walkable amenities ~0.75 mi
Loading nearby amenities…
Taxation est. · year 1
- Rental income
- $17,318
- − Mortgage interest
- −$8,682
- − Property taxes
- −$2,325
- − Insurance
- −$775
- − Repairs & maintenance
- −$1,385
- − Management
- −$1,385
- − HOA
- −$3,660
- − Depreciation
- −$4,509
- Taxable loss
- −$5,404
- Est. tax savings @ 24.0%
- +$1,297
- After-tax cash flow
- $-1,536/yr
For passive investors: Depreciation is non-cash, so a rental often shows a tax loss while cash-flowing — sheltering income. Rental losses are passive: they offset passive income freely, and up to $25,000/yr can offset ordinary (W-2) income if you actively participate and your MAGI is under $100k (phasing out to $0 by $150k); unused losses carry forward. On sale, claimed depreciation is recaptured at up to 25%, and gains may owe capital-gains tax (a 1031 exchange can defer both). Figures are a year-1 estimate at your 24.0% rate — not tax advice; consult a CPA.
Condition & rehab AI · 12 photos
This well-maintained ground-floor condo is in good condition with minimal repairs needed. It offers a good ROI with updates that can significantly increase its value.
Value-add opportunities
- Both Paint exterior siding — Enhances curb appeal and property value.
- Both Clean gutters — Improves drainage and property value.
- Resale Replace kitchen appliances — Modernizes the kitchen and appeals to buyers.
- Both Install smart home devices — Enhances convenience and adds value to the property.
Renovation cost estimate screening
Value-add ROI direction
- Both Paint exterior siding — Enhances curb appeal and property value. ↑
- Both Clean gutters — Improves drainage and property value. ↑
- Resale Replace kitchen appliances — Modernizes the kitchen and appeals to buyers. ↑
- Both Install smart home devices — Enhances convenience and adds value to the property. ↑
ⓘ Cost ranges are severity-bucket heuristics (US national rule-of-thumb). Get contractor quotes + a written scope before underwriting a rehab budget.
Schools (NCES district)
- District
- Farmington Public School District
- NCES district ID
- 2614070
- Math proficiency
- 45% ▼ -5.00%
- Reading proficiency
- 58% ▼ -1.00%
- Median HH income
- $72,846
- Composite
- 46.17/100
- National rank
- #2497
- State rank
- #78 of 540 in MI
Livability — Farmington Hills
- Score
- 81/100
- State rank
- #64
- US rank
- #1364
Category grades
Schools grade is shown separately in the Schools card above.
Census & demographics
- Census place
- Farmington Hills, MI
- County
- Oakland County · 1,009,092 people
- City population
- 67,612
- Metro
- Detroit-Warren-Dearborn, MI
- Population (ZIP)
- 26,432
- Household income
- $88,938
- Rent vs Own
- Severe rent burden
- 733.0
Population outlook (Oakland County) Hauer SSP2
- Today (2025)
- 1,335,747 people
- By 2030
- 1,375,100 · +2.9%
- By 2040
- 1,435,385 · +7.5%
- By 2050
- 1,469,250 · +10.0%
- By 2075
- 1,531,946 · +14.7%
- By 2100
- 1,450,485 · +8.6%
Race, ethnicity, and origin ACS 2023
- Neighborhood character
- Predominantly White (71%)
- Race & ethnicity
- White 71% Black 13% Two or more races 7% Asian 6% Hispanic / Latino 4%
- Common ancestry
- Romanian 10% Slovak 3% Lithuanian 3%
- Foreign-born
- 12% · Canada, China, South Korea
- Languages at home
- 85% English-only · Other Indo-European 5% Arabic 2% Spanish 2%
Political lean MEDSL · Oakland
- 2024 margin
- D (+10.6) · D 54.4% · R 43.8% · Other 1.9%
- 2008→2024 swing
- -3.9pp toward R · 2008: 14.5pp · 2024: 10.6pp
- All cycles
- 2024: D+10.6 2020: D+14.1 2016: D+8.1 2012: D+8.1 2008: D+14.5
Not yet ingested
- Civics
- —
Market trends
- HPI YoY
- ▼ -273.86%
- Current HPI
- 177.4299
- Rent YoY
- ▲ 10.83%
- Metro
- Detroit-Warren-Dearborn, MI
- State GDP YoY
- ▲ 1.37%
- F500 in state
- 28
Industry mix (Fortune 500 HQ in MI)
| Industry | F500 HQs | Revenue |
|---|---|---|
| Automotive Parts | 3 | $48B |
|
||
| Automotive | 2 | $372B |
|
||
| Chemicals | 1 | $45B |
|
||
| Automotive Retail | 1 | $29B |
|
||
| Healthcare / Medical Devices | 1 | $23B |
|
||
| Automotive Technology | 1 | $20B |
|
||
Price history
4 events — show timeline
- 2026-06-15 Pending — REALCOMP
- 2026-05-07 Relisted — REALCOMP
- 2026-04-26 Pending — REALCOMP
- 2026-04-21 Listed $155,000 REALCOMP
Cash-flow waterfall
monthlySold comps — $/sqft
last 12 mo · ≤1 miLoading sold comps…