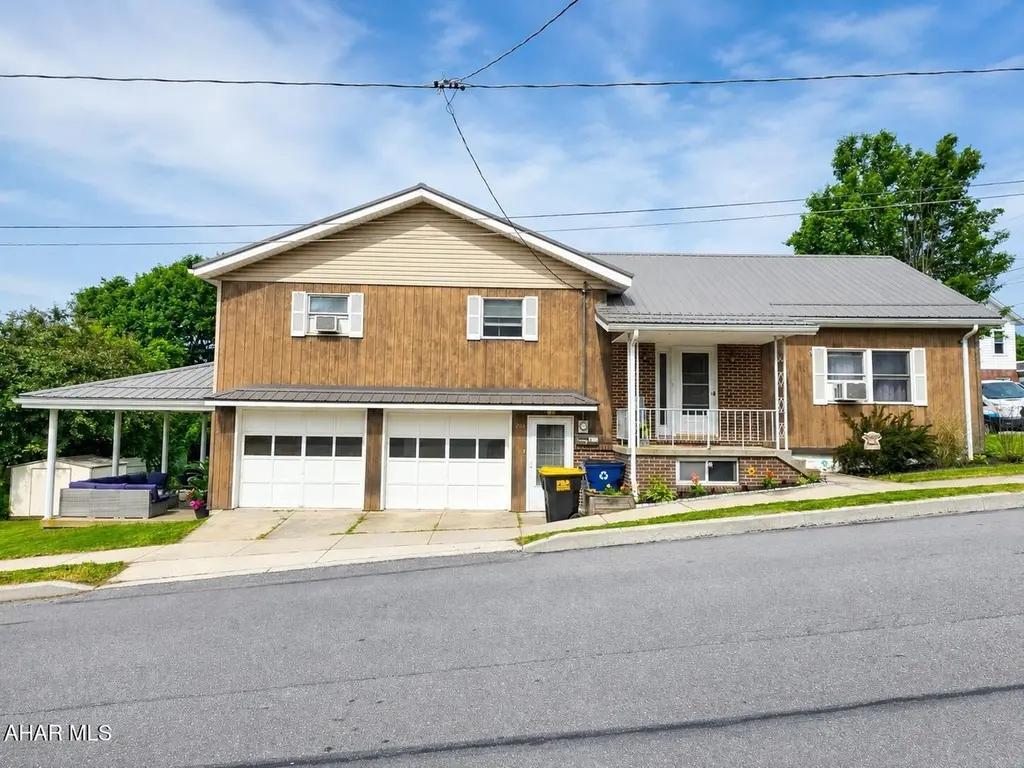
201 S Julian St · Ebensburg, PA
Flood risk 1/10 · Minimal
- FEMA flood zone
- X (unshaded)
- Chance of flooding over 30 yrs
- 0.0%
- Est. flood insurance / yr
- $473 – $860
Fire risk 1/10 · Minimal
- Est. fire insurance / yr
- $511 – $949
Heat risk 2/10 · Minimal
- Hot days now (above 90°F)
- 7 days/yr
- Hot days in 30 yrs
- 18 days/yr
Wind risk 2/10 · Minimal
- Chance of severe wind over 30 yrs
- —
Air-quality risk 3/10 · Minor
- Unhealthy air days now
- 2 days/yr
- Unhealthy air days in 30 yrs
- 4 days/yr
Risk factors via First Street. Map © Google.
Why this score? — see what drove the D- grade
The composite is a weighted blend of 9 inputs, each scored 0–100. Each bar is that input's sub-score; the figure is the points it added to the 100-point composite (weight × sub-score).
- Cash flow +13.4/30.0
- Livability +4.4/5.0
- Schools +4.1/10.0
- DSCR +4.0/10.0
- 1% rule +3.1/10.0
- ARV discount +2.5/15.0
- Rent growth +2.5/5.0
- Condition / age +2.5/5.0
- Appreciation +0.0/10.0
$210,000
🖨 Deal sheet (PDF) 📄 Offer letter ✓ Due diligence
Listing remarks MLS
Ebensburg in the borough close to nearly everything. One block from the courthouse. Central air and 2 car garage. Gas hot water baseboard heat. Move in condition.
Key facts
- Generous living area
- Newer roof
- New appliances
Tags
Property features AI
Exterior
- Parking: Attached 2-car garage with automatic door opener
- Utilities: Public water
- Home design: Single-family residence; Multi/split levels
- Construction: Brick construction; Metal roof
- Exterior features: Patio; Porch; Shed(s); Sloped lot; Frontage 35x94
Interior
- Kitchen: Dishwasher; Microwave; Range; Refrigerator
- Bedrooms: Total rooms: 10
- Flooring: Vinyl; Carpet
- Bathrooms: 2 full bathrooms; 1 half bathroom
- Heating & cooling: Natural gas heating with hot water system; Ceiling fans; Cooling present
- Interior features: Eat-in kitchen; Pantry; Basement
- Laundry & utility: Washer; Dryer
Neighborhood map
What this means for you Summary
Snapshot
- This is a 3-bed/2.5-bath single-family listed at $210k.
Deal economics
- At list price, monthly cash flow is $3 ($36/yr) — positive.
- The deal already cash-flows at list — no discount required.
- To meet the 1% rule (rent ≥ 1% of price), the offer needs to be $170k (19.1% below list).
- Recommended offer: $170k (19.1% below list) — sets the bar for 1% rule.
Location & tenants
- Location reads 87/100 on livability (#53 in PA, #310 nationally) — a professional / high-income tenant draw. Strengths: crime A+, cost of living A+, housing A+; Watch: commute F.
- Central Cambria SD (rural): math 40% / reading 55% proficiency, ranked #225 of 539 in PA (top 42%) — families likely to look elsewhere, expect single-tenant / working-renter base with shorter leases.
- Zoned schools: Cambria El Sch (math 45% / reading 61%, grade C, #571 of 1,518 statewide, top 38%, 450 students, 42% FRL); Central Cambria Ms (math 27% / reading 47%, grade F, #298 of 512 statewide, top 60%, 379 students, 39% FRL); Central Cambria Hs (math 67%, 559 students, 26% FRL).
- Market conditions: 39 active listings in the ZIP; 64 units permitted in Cambria County in 2024 (0 in 5+ unit buildings).
Forward outlook
- Local home prices are declining (-3.0%/yr); year-one equity from $1k of loan paydown is wiped out by about $6k of value loss. Plan a longer hold.
- Cambria County population projected at -28% by 2050 — secular population decline; favor cash flow + early exit over multi-decade hold.
Negotiation context
- Only 4 days on market — expect competitive offers; lowballing is unlikely to land.
- 4 sale attempts since 21y ago with the ask held roughly flat each time — persistent listings suggest the price (not the market) is what's stuck; bring a comps-based counter.
- Current owner paid $145k; 45% above their basis — modest negotiation headroom, anchor on the comps not their cost.
Questions for the listing agent
- Built in 1970 — when were the roof, HVAC, electrical panel, plumbing, and water heater last replaced?
- Is there a deadline driving the sale (1031 exchange, divorce, estate, relocation)? That informs how much negotiation room exists.
- Schools are A-rated — typically a magnet for longer-tenancy family renters. What's the average tenant stay here, and is there a school-zone premium baked into asking?
- The area grade is low — what's the realistic commute time and amenity access for the typical tenant pool here? Any planned neighborhood developments (good or bad) we should know about?
- What's the average days-on-market for RENTAL listings here right now (not sales)? A rising rental-DOM trend means longer vacancies and softer asking-rent achievability than the comps imply.
- What's the recent tenant-quality profile in this submarket — average credit score on applications, eviction rate, late-payment / NSF rate, and stable-employment percentage? A property-management company in the area should have these aggregated.
- How much new for-sale + rental construction is in the pipeline within 1–3 miles? Heavy new supply typically softens prices + rents 12–24 months out; constrained supply supports both.
Investment metrics
- 1% rule
- 0.81% ✗
- Cap rate
- 6.31%
- Cash-on-cash
- 0.06%
- DSCR
- 1.00
- GRM
- 10.3
CMA / ARV
- ARV (on-the-fly)
- $189,144
- Comps found
- 10
Show comp detail 10 sales within ~0.75 mi
| Address | Dist | Beds/Ba | Sqft | Sold | Price | $/sf | Match |
|---|---|---|---|---|---|---|---|
| 116 S Julian St | 0.04mi | 3/2.0 | 1,654 (-3%) | 7mo | $119,900 | $72 | 86 |
| 411 W Lloyd St | 0.08mi | 3/1.5 | 1,696 (-0%) | 10mo | $206,000 | $121 | 83 |
| 313 E Highland Ave | 0.49mi | 3/2.0 | 1,695 (-0%) | 2mo | $92,500 | $55 | 73 |
| 306 W Horner St | 0.24mi | 3/1.5 | 1,870 (+10%) | 4mo | $168,000 | $90 | 65 |
| 101 Tanner St | 0.57mi | 3/2.0 | 1,732 (+2%) | 14mo | $260,000 | $150 | 57 |
| 415 W Crawford St | 0.22mi | 3/1.0 | 1,480 (-13%) | 7mo | $164,900 | $111 | 56 |
| 609 E Ogle St | 0.43mi | 4/2.0 (+1) | 1,916 (+12%) | 3mo | $199,900 | $104 | 50 |
| 308 E Highland Ave | 0.46mi | 3/1.0 | 1,926 (+13%) | 3mo | $150,000 | $78 | 49 |
| 418 E Horner St | 0.41mi | 4/2.5 (+1) | 1,832 (+8%) | 18mo | $240,000 | $131 | 48 |
| 400 Randolph St | 0.53mi | 3/2.0 | 1,512 (-11%) | 10mo | $216,000 | $143 | 46 |
Match score weights: distance 35% · size 25% · config 20% · recency 20%. Top-matched comps best support the ARV.
Projected returns pro-forma
-3.0% appreciation · 3.0% rent growth · sell at horizon
- IRR
- -16.2%
- Equity multiple
- 0.42×
- Total profit
- $-33,879
- Equity at exit
- $31,312
- IRR
- -8.0%
- Equity multiple
- 0.50×
- Total profit
- $-29,427
- Equity at exit
- $18,157
Cash invested: $58,800 (down + closing). Projections, not guarantees.
Landlord ↔ Tenant lean methodology
- Overall (STATE)
- 62 Landlord-Friendly
- State Pennsylvania
- 62 Landlord-Friendly · EVEN
- County
- — inherits STATE
- City
- — inherits STATE
ZIP-level market 15931
- Home prices YoY
- -29.5%
- Active inventory
- 39
- Price-to-rent
- 10.3×
Monthly cashflow live
- Estimated rent
- $1,699 medium interval (Pro) →
- Mortgage (P&I)
- −$1,101
- Tax from tax record
- −$151 /mo · $1,806/yr
- Insurance
- −$88
- HOA
- −$0
- Vacancy / Maint / Mgmt
- −$357
- Net cashflow
- $3
Break-even live
Sensitivity live
| Price | -10% $122 | -5% $62 | +0% $3 | +5% $-56 | +10% $-116 |
|---|---|---|---|---|---|
| Rent | -10% $-131 | -5% $-64 | +0% $3 | +5% $70 | +10% $137 |
| Rate | -1.0pp $109 | -0.5pp $56 | base $3 | +0.5pp $-51 | +1.0pp $-107 |
UW: 25.0% down · 7.5% · 30yr · 1.5% tax · 5.0% vac · 8.0% maint · 8.0% mgmt
Financing live
Cash to close
- Down payment
- $52,500
- Closing costs
- $6,300
- Reserves months
- —
- Total cash needed
- —
Loan-product check · same deal, 3 products live
Conventional
25% down · 7.5% · 30yr
- Down + closing
- —
- Monthly P&I
- —
- Monthly cashflow
- —
- DSCR
- —
- Eligible?
- —
Personal DTI + credit; lowest rate.
DSCR
20% down · 8.5% · 30yr
- Down + closing
- —
- Monthly P&I
- —
- Monthly cashflow
- —
- DSCR
- —
- Eligible?
- —
No personal income docs; deal must DSCR.
Hard money
10% down · 12.0% · 12mo
- Down + closing
- —
- Monthly P&I
- —
- Monthly cashflow
- —
- DSCR
- —
- Eligible?
- —
Short-term bridge; refi at stabilization.
Listing history 4 events
-
2026-06-21days on market $210,000 Active 4 DOM
-
2026-06-21days on market $210,000 Active 3 DOM
-
2026-06-17remarks 699-char remark
-
2026-06-17$210,000 Active 1 DOM
ⓘ Source: listings_history table (triggers on properties + properties_extension) + one-shot
backfill from property_details.listing_events for pre-trigger history.
Tax reassessment forecast PA · Partial reset (capped growth)
- Current annual tax
- $1,806 · $151/mo
- Projected year-2 tax
- $2,562 · $214/mo
- Expected delta
- +$756/yr (+$63/mo · 41.8%)
ⓘ Screening estimate from a state-policy table — verify with the county assessor before closing.
Climate risk First Street
- Flood 1/10 Low FEMA zone X (unshaded) · 0% chance over 30 yrs
- Wildfire 1/10 Low
- Heat 2/10 Low 7 d/yr ≥90°F today · 18 d/yr by 30 yrs out
- Wind 2/10 Low
- Air quality 3/10 Moderate 2 unhealthy d/yr today · 4 by 30 yrs out
Nearby sold comps map
Loading sold comps map…
Walkable amenities ~0.75 mi
Loading nearby amenities…
Taxation est. · year 1
- Rental income
- $20,390
- − Mortgage interest
- −$11,763
- − Property taxes
- −$1,806
- − Insurance
- −$1,050
- − Repairs & maintenance
- −$1,631
- − Management
- −$1,631
- − Depreciation
- −$6,109
- Taxable loss
- −$3,601
- Est. tax savings @ 24.0%
- +$864
- After-tax cash flow
- $901/yr
For passive investors: Depreciation is non-cash, so a rental often shows a tax loss while cash-flowing — sheltering income. Rental losses are passive: they offset passive income freely, and up to $25,000/yr can offset ordinary (W-2) income if you actively participate and your MAGI is under $100k (phasing out to $0 by $150k); unused losses carry forward. On sale, claimed depreciation is recaptured at up to 25%, and gains may owe capital-gains tax (a 1031 exchange can defer both). Figures are a year-1 estimate at your 24.0% rate — not tax advice; consult a CPA.
Schools (NCES district)
- District
- Central Cambria SD
- NCES district ID
- 4205340
- Math proficiency
- 40% ▼ -10.00%
- Reading proficiency
- 55% ▼ -13.00%
- Median HH income
- $50,276
- Composite
- 40.68/100
- National rank
- #3674
- State rank
- #225 of 539 in PA
Livability — Ebensburg
- Score
- 87/100
- State rank
- #53
- US rank
- #310
Category grades
Schools grade is shown separately in the Schools card above.
Census & demographics
- Census place
- Ebensburg, PA
- Population (ZIP)
- 8,852
Population outlook (Cambria County) Hauer SSP2
- Today (2025)
- 122,754 people
- By 2030
- 115,827 · -5.6%
- By 2040
- 101,309 · -17.5%
- By 2050
- 88,379 · -28.0%
- By 2075
- 65,237 · -46.9%
- By 2100
- 46,909 · -61.8%
Race, ethnicity, and origin ACS 2023
- Neighborhood character
- Predominantly White (96%)
- Race & ethnicity
- White 96% Black 2% Two or more races 2%
- Common ancestry
- Romanian 12% Lithuanian 2% Scotch-Irish 2%
- Foreign-born
- 1%
- Languages at home
- 98% English-only · Spanish 1%
Political lean MEDSL · Cambria
- 2024 margin
- Solid R (+39.7) · D 29.8% · R 69.5%
- 2008→2024 swing
- -40.4pp toward R · 2008: 0.7pp · 2024: -39.7pp
- All cycles
- 2024: R+39.7 2020: R+37.3 2016: R+37.8 2012: R+17.8 2008: D+0.7
Not yet ingested
- Civics
- —
Market trends
- HPI YoY
- ▼ -54.99%
- Current HPI
- 131.3961
- Rent YoY
- —
- Metro
- —
- State GDP YoY
- ▲ 1.68%
- F500 in state
- 34
Industry mix (Fortune 500 HQ in PA)
| Industry | F500 HQs | Revenue |
|---|---|---|
| Healthcare | 2 | $309B |
|
||
| Insurance | 2 | $27B |
|
||
| Telecommunications / Media | 1 | $124B |
|
||
| Industrial Distribution | 1 | $22B |
|
||
| Financial Services | 1 | $20B |
|
||
| Chemicals / Materials | 1 | $18B |
|
||
Price history
+1300.0% since first listed12 events — show timeline
- 2026-06-17 Listed $210,000 AHARMLS
- 2018-09-24 Sold (Public Records) $145,000 Public Records
- 2018-09-24 Sold (MLS) $145,000 AHARMLS
- 2018-07-23 Listed $145,000 AHARMLS
- 2012-09-05 Sold (MLS) $130,000 AHARMLS
- 2012-09-04 Sold (Public Records) $130,000 Public Records
- 2012-05-23 Listed $137,500 AHARMLS
- 2005-11-28 Listed $139,900 AHARMLS
- 2000-11-03 Sold (Public Records) $75,000 Public Records
- 1989-02-01 Sold (Public Records) $53,000 Public Records
- 1985-06-01 Sold (Public Records) $14,500 Public Records
- 1983-04-01 Sold (Public Records) $15,000 Public Records
Property tax history
+2.1%/yrLatest (2026): $1,806 · +2.9% YoY. Source: county tax records.
Cash-flow waterfall
monthlySold comps — $/sqft
last 12 mo · ≤1 miLoading sold comps…