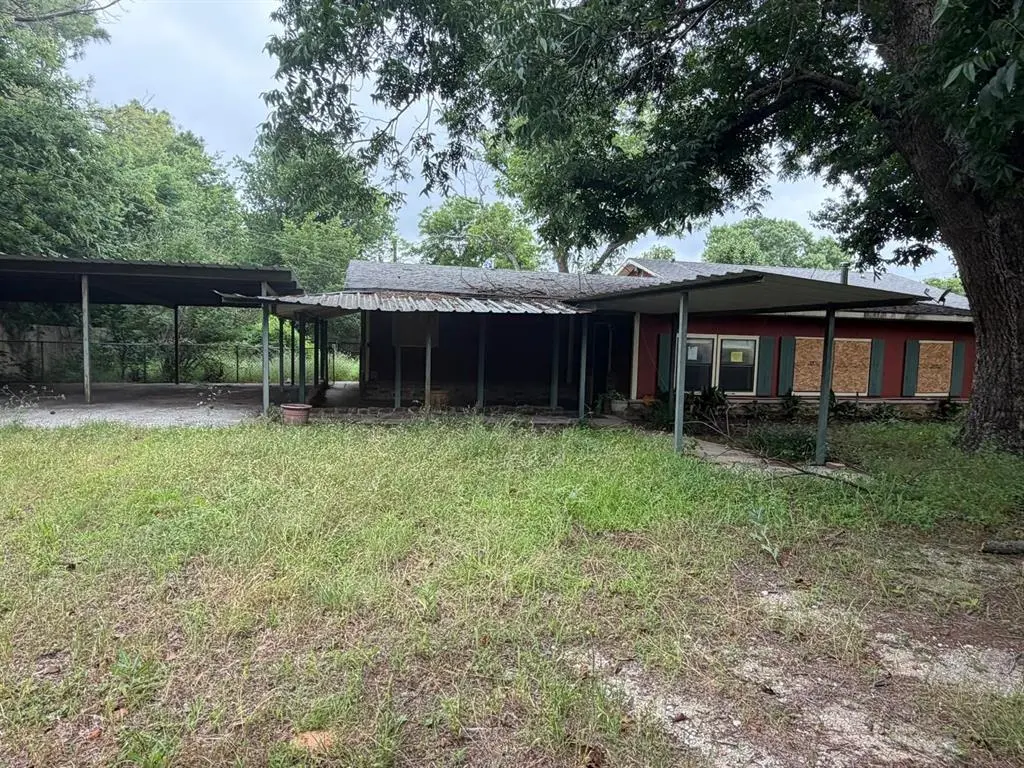
508 Lilac Dr · Granbury, TX
Flood risk 1/10 · Minimal
- FEMA flood zone
- X (unshaded)
- Chance of flooding over 30 yrs
- 0.0%
- Est. flood insurance / yr
- $507 – $1,088
Fire risk 5/10 · Moderate
- Est. fire insurance / yr
- $1,222 – $2,270
Heat risk 7/10 · Major
- Hot days now (above 108°F)
- 7 days/yr
- Hot days in 30 yrs
- 22 days/yr
Wind risk 6/10 · Moderate
- Chance of severe wind over 30 yrs
- 27.0%
Air-quality risk 2/10 · Minimal
- Unhealthy air days now
- 1 days/yr
- Unhealthy air days in 30 yrs
- 2 days/yr
Risk factors via First Street. Map © Google.
Why this score? — see what drove the B grade
The composite is a weighted blend of 9 inputs, each scored 0–100. Each bar is that input's sub-score; the figure is the points it added to the 100-point composite (weight × sub-score).
- Cash flow +30.0/30.0
- 1% rule +10.0/10.0
- DSCR +10.0/10.0
- ARV discount +7.5/15.0
- Schools +4.0/10.0
- Rent growth +3.8/5.0
- Livability +3.3/5.0
- Condition / age +2.5/5.0
- Appreciation +0.0/10.0
$164,900
🖨 Deal sheet (PDF) 📄 Offer letter ✓ Due diligence
Key facts
- Covered front porch
- Hot tub
- Screened in area
Tags
Property features AI
Finance
- Other: Property is not attached and does not have multiple parcels; Horse permitted on the property
- Financial info: Listing accepted loan types: Cash, Conventional; No second mortgage indicated
- HOA & community: No association
Exterior
- Parking: Attached carport with 2 covered/carport spaces
- Security: Security features unknown
- Utilities: City water; Septic system; All-weather road access; Not in a municipal utility district
- Home design: Single-family residence; Residential property; One story; Preowned (built in 1980); Smart home features present
- Construction: Built in 1980; Brick, concrete, fiber cement, and frame construction; Concrete perimeter foundation; Other roof
- Exterior features: Interior lot; Grassed vegetation; Other exterior features; Workshop with electric and other outbuildings; Easements present
Interior
- Kitchen: No appliances listed
- Bedrooms: 3 bedrooms (all on the main level); Primary bedroom on the main level with ensuite bath
- Flooring: Laminate flooring; Linoleum flooring
- Bathrooms: 2 full bathrooms
- Heating & cooling: Central heating (electric); Central air conditioning (electric)
- Interior features: Built-in features; One living area; One dining area; Total of 7 rooms; One level (single-story)
- Laundry & utility: Washer hookup
Neighborhood map
What this means for you Summary
Snapshot
- This is a 3-bed/2.0-bath single-family listed at $165k.
Deal economics
- At list price, monthly cash flow is $962 ($12k/yr) — positive.
- The deal already cash-flows at list — no discount required.
- Meets the 1% rule at list price ($3k rent vs $165k).
- Cap rate 13.3% vs local median 3.8% in Granbury — top-decile yield for the area; either an underpriced asset or a hidden risk that comps aren't pricing in. Stress-test before assuming the spread holds.
Location & tenants
- Location reads 66/100 on livability (#628 in TX) — a middle-class / working-renter tenant base. Strengths: cost of living A+, housing A+, health & safety A+; Watch: employment C-, crime D+, amenities F.
- Granbury ISD (town): math 46% / reading 46% proficiency, ranked #237 of 826 in TX (top 29%) — families likely to look elsewhere, expect single-tenant / working-renter base with shorter leases.
- Zoned schools: Nettie Baccus El (math 39% / reading 36%, grade F, #1,744 of 4,322 statewide, top 41%, 466 students, 81% FRL) — zoned schools average 81% FRL vs 43% district-wide (38 pts higher); higher-poverty schools than district average — tighter screening recommended.
- Market conditions: Rents rising fast (+5.2%/yr); 690 active listings in the ZIP; 22 comparable units currently listed for rent nearby; rentals lingering (median 45d on market — plan ~5-8 weeks vacancy on turnover, expect pricing pressure); 59% of comp listings sitting > 30 days — soft ceiling on asking rent; solid renter incomes; 125 units permitted in Hood County in 2024 (0 in 5+ unit buildings).
- This rent runs 30% of the median local income ($105k/yr) — at the standard rent-burdened threshold; future hikes will face affordability resistance.
Forward outlook
- Local home prices are declining (-3.0%/yr); year-one equity from $1k of loan paydown is wiped out by about $5k of value loss. Plan a longer hold.
- Hood County population projected at +29% by 2050 — long-run rental-demand tailwind backs the buy-and-hold thesis.
- At projected returns (-3.0% appreciation + 5.2% rent growth), your $46k cash investment doubles in ~5 years — after that, you're playing with house money.
Negotiation context
- Only 13 days on market — expect competitive offers; lowballing is unlikely to land.
- 8 sale attempts since 15y ago; this cycle's ask has dropped $25k (13%) from the opening price — seller is motivated, your offer sets the floor, not the list.
Risks & watch-outs
- Climate carrying-cost: major wind risk, 27% chance of damaging wind over 30y; moderate wildfire risk; extreme-heat days projected 7→22/yr by 2055 (HVAC capex compounding) — expect insurance premiums to compound above CPI over the hold.
Questions for the listing agent
- Is there a deadline driving the sale (1031 exchange, divorce, estate, relocation)? That informs how much negotiation room exists.
- Schools are D-rated, which usually means shorter tenancies and higher turnover. Who's the typical renter profile here, and what's been the actual vacancy rate?
- Crime grade is D in this area — have there been break-ins, vandalism, or insurance claims at this property in the last 3 years? What carrier currently insures it and at what premium?
- What's the average days-on-market for RENTAL listings here right now (not sales)? A rising rental-DOM trend means longer vacancies and softer asking-rent achievability than the comps imply.
- What's the recent tenant-quality profile in this submarket — average credit score on applications, eviction rate, late-payment / NSF rate, and stable-employment percentage? A property-management company in the area should have these aggregated.
- How much new for-sale + rental construction is in the pipeline within 1–3 miles? Heavy new supply typically softens prices + rents 12–24 months out; constrained supply supports both.
Investment metrics
- 1% rule
- 1.60% ✓
- Cap rate
- 13.29%
- Cash-on-cash
- 25.01%
- DSCR
- 2.11
- GRM
- 5.2
CMA / ARV
- ARV (on-the-fly)
- $349,414
- Comps found
- 12
Show comp detail 12 sales within ~0.75 mi
| Address | Dist | Beds/Ba | Sqft | Sold | Price | $/sf | Match |
|---|---|---|---|---|---|---|---|
| 4607 Pecan Ln | 0.32mi | 3/2.0 | 1,959 (-0%) | 7mo | $329,750 | $168 | 79 |
| 306 Donna Cir | 0.52mi | 4/2.0 (+1) | 1,860 (-5%) | 1mo | $349,990 | $188 | 61 |
| 313 Donna Cir | 0.58mi | 4/2.0 (+1) | 2,047 (+4%) | 2mo | $350,000 | $171 | 59 |
| 1601 Omaha Dr | 0.39mi | 4/2.0 (+1) | 1,753 (-11%) | 1mo | $345,000 | $197 | 58 |
| 4412 Logan Cir | 0.71mi | 4/2.0 (+1) | 2,019 (+3%) | 3mo | $375,000 | $186 | 54 |
| 115 Donna Cir | 0.75mi | 4/2.0 (+1) | 1,976 (+1%) | 6mo | $350,000 | $177 | 54 |
| 1905 Preakness Dr | 0.64mi | 4/2.5 (+1) | 2,100 (+7%) | 3mo | $343,815 | $164 | 49 |
| 1917 Preakness Dr | 0.66mi | 4/2.0 (+1) | 1,790 (-9%) | 2mo | $317,990 | $178 | 48 |
| 304 Gallant Man Ct | 0.71mi | 4/2.0 (+1) | 1,858 (-5%) | 8mo | $339,990 | $183 | 47 |
| 424 Sunday Silence Way | 0.71mi | 4/2.5 (+1) | 2,100 (+7%) | 3mo | $346,990 | $165 | 46 |
| 205 Affirmed Ct | 0.72mi | 4/2.5 (+1) | 2,100 (+7%) | 2mo | $348,990 | $166 | 46 |
| 101 Seabiscuit Ct | 0.73mi | 4/2.0 (+1) | 1,790 (-9%) | 2mo | $321,990 | $180 | 45 |
Match score weights: distance 35% · size 25% · config 20% · recency 20%. Top-matched comps best support the ARV.
Projected returns pro-forma
-3.0% appreciation · 5.2% rent growth · sell at horizon
- IRR
- 20.9%
- Equity multiple
- 1.88×
- Total profit
- $40,544
- Equity at exit
- $24,587
- IRR
- 30.5%
- Equity multiple
- 4.03×
- Total profit
- $139,905
- Equity at exit
- $14,258
Cash invested: $46,172 (down + closing). Projections, not guarantees.
Landlord ↔ Tenant lean methodology
- Overall (STATE)
- 87 Strongly Landlord-Friendly
- State Texas
- 87 Strongly Landlord-Friendly · R+5
- County
- — inherits STATE
- City
- — inherits STATE
ZIP-level market 76049
- Home prices YoY
- -26.8%
- Rents YoY
- 5.2%
- Active inventory
- 690
- Price-to-rent
- 5.2×
Monthly cashflow live
- Estimated rent
- $2,635 high interval (Pro) →
- Mortgage (P&I)
- −$865
- Tax from tax record
- −$186 /mo · $2,230/yr
- Insurance
- −$69
- HOA
- −$0
- Vacancy / Maint / Mgmt
- −$553
- Net cashflow
- $962
Break-even live
Sensitivity live
| Price | -10% $1,055 | -5% $1,009 | +0% $962 | +5% $915 | +10% $869 |
|---|---|---|---|---|---|
| Rent | -10% $754 | -5% $858 | +0% $962 | +5% $1,066 | +10% $1,170 |
| Rate | -1.0pp $1,045 | -0.5pp $1,004 | base $962 | +0.5pp $919 | +1.0pp $876 |
UW: 25.0% down · 7.5% · 30yr · 1.5% tax · 5.0% vac · 8.0% maint · 8.0% mgmt
Financing live
Cash to close
- Down payment
- $41,225
- Closing costs
- $4,947
- Reserves months
- —
- Total cash needed
- —
Loan-product check · same deal, 3 products live
Conventional
25% down · 7.5% · 30yr
- Down + closing
- —
- Monthly P&I
- —
- Monthly cashflow
- —
- DSCR
- —
- Eligible?
- —
Personal DTI + credit; lowest rate.
DSCR
20% down · 8.5% · 30yr
- Down + closing
- —
- Monthly P&I
- —
- Monthly cashflow
- —
- DSCR
- —
- Eligible?
- —
No personal income docs; deal must DSCR.
Hard money
10% down · 12.0% · 12mo
- Down + closing
- —
- Monthly P&I
- —
- Monthly cashflow
- —
- DSCR
- —
- Eligible?
- —
Short-term bridge; refi at stabilization.
Rent comps 22 comps
| Address | Beds | Baths | Sqft | Rent | $/sqft | DOM | Units | Dist |
|---|---|---|---|---|---|---|---|---|
| 4606 Francis Ct Granbury, TX | 3.0 | 2.0 | 1300 | $2,100 | $1.62 | 44d | 1 | 0.38mi |
| 213 Dean Ct Granbury, TX | 3.0 | 2.0 | 1372 | $1,609 | $1.17 | 3d | 1 | 0.71mi |
| 208 Bobbie Ann Ct Granbury, TX | 3.0 | 2.0 | 1645 | $1,675 | $1.02 | 44d | 1 | 0.71mi |
| 100 Cardinal Woods Ct Granbury, TX | 3.0 | 2.5 | 1980 | $3,850 | $1.94 | 44d | 1 | 0.78mi |
| 4411 Bobbie Ann Dr Granbury, TX | 3.0 | 2.0 | 1645 | $1,650 | $1.00 | 44d | 1 | 0.78mi |
| 102 Cardinal Woods Ct Granbury, TX | 2.0 | 2.0 | 1620 | $3,650 | $2.25 | 44d | 1 | 0.78mi |
| 104 Cardinal Woods Ct Granbury, TX | 3.0 | 2.5 | 1890 | $3,850 | $2.04 | 44d | 1 | 0.79mi |
| 107 Donna Cir Granbury, TX | 3.0 | 2.0 | 1735 | $2,400 | $1.38 | 44d | 1 | 0.79mi |
| 106 Cardinal Woods Ct Granbury, TX | 2.0 | 2.0 | 1600 | $3,650 | $2.28 | 44d | 1 | 0.81mi |
| 108 Cardinal Woods Ct Granbury, TX | 2.0 | 2.5 | 2040 | $3,850 | $1.89 | 44d | 1 | 0.82mi |
| 110 Cardinal Woods Ct Granbury, TX | 3.0 | 2.5 | 1980 | $3,850 | $1.94 | 44d | 1 | 0.82mi |
| 211 S Cardinal Ct Granbury, TX | 3.0 | 2.5 | 1980 | $3,850 | $1.94 | 44d | 1 | 0.83mi |
| 112 Cardinal Woods Ct Granbury, TX | 3.0 | 2.5 | 1890 | $3,850 | $2.04 | 44d | 1 | 0.83mi |
| 4000 Sapphire Ln Granbury, TX | 3.0 | 2.0 | 1635 | $1,789 | $1.09 | 3d | 1 | 0.94mi |
| 2700 James Rd Granbury, TX | 3.0 | 2.0 | 1295 | $1,800 | $1.39 | 25d | 1 | 0.97mi |
| 4700 Topaz Ln Granbury, TX | 4.0 | 2.0 | 2022 | $2,350 | $1.16 | 8d | 1 | 0.99mi |
| 700 Rolling Terrace Cir Granbury, TX | 3.0 | 2.0 | 1612 | $1,774 | $1.10 | 8d | 1 | 1.02mi |
| 4720 Topaz Ln Granbury, TX | 4.0 | 2.0 | 1903 | $2,400 | $1.26 | 25d | 1 | 1.06mi |
| 2705 Acton School Rd Granbury, TX | 4.0 | 2.0 | 1390 | $1,700 | $1.22 | 17d | 1 | 1.07mi |
| 2705 Acton School Rd Granbury, TX | 4.0 | 2.0 | 1390 | $1,700 | $1.22 | 25d | 1 | 1.07mi |
| 316 Sardius Blvd Granbury, TX | 3.0 | 2.0 | 1686 | $1,950 | $1.16 | 8d | 1 | 1.07mi |
| 4816 Sapphire Ln Granbury, TX | 4.0 | 2.0 | 1878 | $2,400 | $1.28 | 44d | 1 | 1.23mi |
Listing history 8 events
-
2026-06-18days on market $164,900 Active 13 DOM
-
2026-06-17days on market $164,900 Active 12 DOM
-
2026-06-16days on market $164,900 Active 11 DOM
-
2026-06-15pricedays on market $164,900 Active 10 DOM
-
2026-06-13days on market $189,900 Active 8 DOM
-
2026-06-09days on market $189,900 Active 4 DOM
-
2026-06-08days on market $189,900 Active 3 DOM
-
2026-06-07$189,900 Active 2 DOM
ⓘ Source: listings_history table (triggers on properties + properties_extension) + one-shot
backfill from property_details.listing_events for pre-trigger history.
Tax reassessment forecast TX · Resets to sale price
- Current annual tax
- $2,230 · $186/mo
- Projected year-2 tax
- $3,018 · $251/mo
- Expected delta
- +$788/yr (+$66/mo · 35.3%)
ⓘ Screening estimate from a state-policy table — verify with the county assessor before closing.
Climate risk First Street
- Flood 1/10 Low FEMA zone X (unshaded) · 0% chance over 30 yrs
- Wildfire 5/10 Major
- Heat 7/10 Severe 7 d/yr ≥108°F today · 22 d/yr by 30 yrs out
- Wind 6/10 Major 27% chance of damaging wind over 30 yrs
- Air quality 2/10 Low 1 unhealthy d/yr today · 2 by 30 yrs out
Nearby sold comps map
Loading sold comps map…
Walkable amenities ~0.75 mi
Loading nearby amenities…
Taxation est. · year 1
- Rental income
- $31,617
- − Mortgage interest
- −$9,237
- − Property taxes
- −$2,230
- − Insurance
- −$824
- − Repairs & maintenance
- −$2,529
- − Management
- −$2,529
- − Depreciation
- −$4,797
- Taxable income
- $9,469
- Est. tax owed @ 24.0%
- −$2,273
- After-tax cash flow
- $9,273/yr
For passive investors: Depreciation is non-cash, so a rental often shows a tax loss while cash-flowing — sheltering income. Rental losses are passive: they offset passive income freely, and up to $25,000/yr can offset ordinary (W-2) income if you actively participate and your MAGI is under $100k (phasing out to $0 by $150k); unused losses carry forward. On sale, claimed depreciation is recaptured at up to 25%, and gains may owe capital-gains tax (a 1031 exchange can defer both). Figures are a year-1 estimate at your 24.0% rate — not tax advice; consult a CPA.
Schools (NCES district)
- District
- Granbury ISD
- NCES district ID
- 4821390
- Math proficiency
- 46% ▬ 0.00%
- Reading proficiency
- 46% ▲ 4.00%
- Median HH income
- $55,856
- Composite
- 40.04/100
- National rank
- #3820
- State rank
- #237 of 826 in TX
Livability — Granbury
- Score
- 66/100
- State rank
- #628
- US rank
- #11998
Category grades
Schools grade is shown separately in the Schools card above.
Census & demographics
- County
- Hood County · 58,506 people
- City population
- 58,506
- Metro
- Granbury, TX
- Population (ZIP)
- 31,506
- Household income
- $104,967
- Rent vs Own
- Severe rent burden
- 235.0
Population outlook (Hood County) Hauer SSP2
- Today (2025)
- 63,502 people
- By 2030
- 67,459 · +6.2%
- By 2040
- 74,958 · +18.0%
- By 2050
- 81,922 · +29.0%
- By 2075
- 98,872 · +55.7%
- By 2100
- 107,796 · +69.8%
Race, ethnicity, and origin ACS 2023
- Neighborhood character
- Predominantly White (82%)
- Race & ethnicity
- White 82% Hispanic / Latino 14% Two or more races 9%
- Hispanic origin (detail)
- Mexican 11%
- Common ancestry
- Slovak 3% Serbian 2% Italian 2%
- Foreign-born
- 5% · Canada
- Languages at home
- 91% English-only · Spanish 8%
Political lean MEDSL · Hood
- 2024 margin
- Solid R (+66.0) · D 16.6% · R 82.6%
- 2008→2024 swing
- -11.9pp toward R · 2008: -54.0pp · 2024: -66.0pp
- All cycles
- 2024: R+66.0 2020: R+64.1 2016: R+66.5 2012: R+64.7 2008: R+54.0
Not yet ingested
- Civics
- —
Market trends
- HPI YoY
- ▼ -100.09%
- Current HPI
- 273.1293
- Rent YoY
- ▲ 5.20%
- Metro
- Granbury, TX
- State GDP YoY
- ▲ 3.95%
- F500 in state
- 110
Industry mix (Fortune 500 HQ in TX)
| Industry | F500 HQs | Revenue |
|---|---|---|
| Energy | 16 | $1,198B |
|
||
| Technology | 5 | $198B |
|
||
| Engineering / Construction | 4 | $72B |
|
||
| Energy Services | 3 | $60B |
|
||
| Utilities | 3 | $41B |
|
||
| Healthcare | 2 | $330B |
|
||
Price history
+129.1% since first listed27 events — show timeline
- 2026-06-05 Listed $189,900 NTREIS
- 2026-05-11 Listing Removed — NTREIS
- 2026-04-10 Contingent — NTREIS
- 2026-04-07 Relisted — NTREIS
- 2026-04-06 Listing Removed — NTREIS
- 2026-03-10 Price Changed $189,900 NTREIS
- 2026-02-20 Price Changed $199,900 NTREIS
- 2026-02-02 Listed $214,900 NTREIS
- 2026-01-31 Listing Removed — NTREIS
- 2026-01-23 Price Changed $214,900 NTREIS
- 2025-12-30 Price Changed $233,750 NTREIS
- 2025-11-30 Listed $247,500 NTREIS
- 2025-11-28 Listing Removed — NTREIS
- 2025-10-27 Price Changed $247,500 NTREIS
- 2025-09-26 Price Changed $261,250 NTREIS
- 2025-08-28 Listed $275,000 NTREIS
- 2023-10-19 Listing Removed — NTREIS
- 2023-08-30 Price Changed $310,000 NTREIS
- 2023-08-11 Relisted — NTREIS
- 2023-07-25 Contingent — NTREIS
- 2023-07-07 Price Changed $260,000 NTREIS
- 2023-06-09 Price Changed $270,000 NTREIS
- 2023-05-25 Price Changed $290,000 NTREIS
- 2023-05-15 Listed $310,000 NTREIS
- 2012-08-29 Listing Removed — NTREIS
- 2011-09-06 Listed $82,900 NTREIS
- 1984-08-22 Sold (Public Records) — Public Records
Property tax history
+2.9%/yrLatest (2025): $2,230 · +10.9% YoY. Source: county tax records.
Cash-flow waterfall
monthlySold comps — $/sqft
last 12 mo · ≤1 miLoading sold comps…