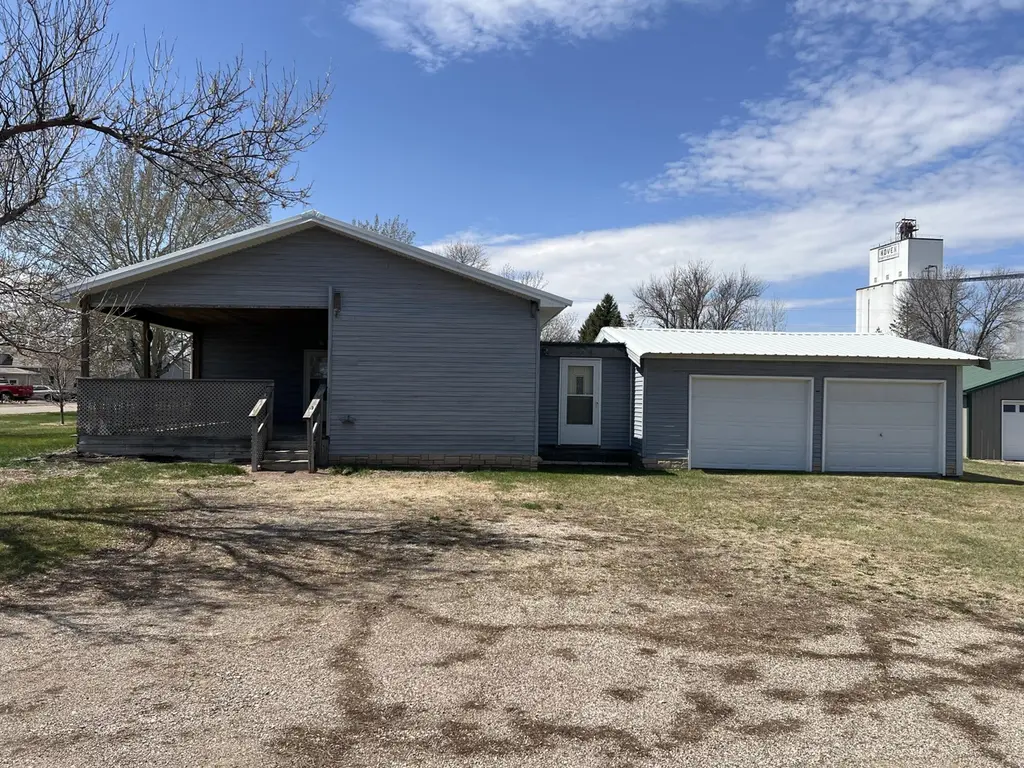
238 True St · Hoven, SD
Flood risk No data
- FEMA flood zone
- —
- Chance of flooding over 30 yrs
- —
- Est. flood insurance / yr
- —
Fire risk No data
- Est. fire insurance / yr
- —
Heat risk No data
- Hot days now (above threshold)
- —
- Hot days in 30 yrs
- —
Wind risk No data
- Chance of severe wind over 30 yrs
- —
Air-quality risk No data
- Unhealthy air days now
- —
- Unhealthy air days in 30 yrs
- —
Risk factors via First Street. Map © Google.
Why this score? — see what drove the A- grade
The composite is a weighted blend of 9 inputs, each scored 0–100. Each bar is that input's sub-score; the figure is the points it added to the 100-point composite (weight × sub-score).
- Cash flow +30.0/30.0
- ARV discount +15.0/15.0
- 1% rule +10.0/10.0
- DSCR +10.0/10.0
- Appreciation +5.0/10.0
- Schools +4.4/10.0
- Livability +3.2/5.0
- Rent growth +2.5/5.0
- Condition / age +2.2/5.0
$65,000
🖨 Deal sheet 📄 Offer letter ✓ Due diligence
Listing remarks MLS
This 1 bed, 1 bath home offers 2 additional rooms that could be used as bedrooms with some work. The property needs some TLC but has potential as a great home, hunting retreat, or investment property. The large attached garage is wired for a heater per seller. There is also a large cement pad included on the NW corner of the property.
Key facts
- 0.35 acre lot
- 2 garage spots
- Built 1973
Neighborhood map
What this means for you Summary
Snapshot
- This is a 1-bed/1.0-bath manufactured listed at $65k. Condition is rated fair.
Deal economics
- At list price, monthly cash flow is $325 ($4k/yr) — positive.
- The deal already cash-flows at list — no discount required.
- Meets the 1% rule at list price ($980 rent vs $65k).
- Recommended offer: $57k (12.0% below list) — sets the bar for market timing.
Location & tenants
- Location reads 64/100 on livability (#168 in SD) — a middle-class / working-renter tenant base. Strengths: cost of living A+, housing A+; Watch: health & safety C-, crime D-, amenities F.
- Hoven School District 53-2 (rural): math 40% / reading 60% proficiency, ranked #76 of 148 in SD (top 51%) — acceptable for families but not a draw, mixed tenant base, ~2y average lease.
- Market conditions: 3 active listings in the ZIP; 10 units permitted in Potter County in 2024 (0 in 5+ unit buildings).
Forward outlook
- In year one you build about $2k of equity ($449 loan paydown + $2k appreciation (3.0% local appreciation)).
- At projected returns (3.0% appreciation + 3.0% rent growth), your $18k cash investment doubles in ~3 years — after that, you're playing with house money.
Negotiation context
- It's been on market 146 days — a 12% lower offer ($57k) is reasonable based on typical stale-listing flexibility.
- 3 sale attempts since 2y ago with the ask held roughly flat each time — persistent listings suggest the price (not the market) is what's stuck; bring a comps-based counter.
Questions for the listing agent
- It's been on market 146 days. Have you received any prior offers? Is the seller open to a 12% concession, seller financing, or rate buy-down credit?
- Have any recent inspections been done? Can we get a copy of the seller's disclosures and any deferred-maintenance estimates?
- Built in 1973 — when were the roof, HVAC, electrical panel, plumbing, and water heater last replaced?
- Why hasn't it sold? Are there any deal-killer items the seller is aware of (foundation, flood, title, zoning, code violations)?
- Is there a deadline driving the sale (1031 exchange, divorce, estate, relocation)? That informs how much negotiation room exists.
- Crime grade is D in this area — have there been break-ins, vandalism, or insurance claims at this property in the last 3 years? What carrier currently insures it and at what premium?
- What's the average days-on-market for RENTAL listings here right now (not sales)? A rising rental-DOM trend means longer vacancies and softer asking-rent achievability than the comps imply.
- What's the recent tenant-quality profile in this submarket — average credit score on applications, eviction rate, late-payment / NSF rate, and stable-employment percentage? A property-management company in the area should have these aggregated.
- How much new for-sale + rental construction is in the pipeline within 1–3 miles? Heavy new supply typically softens prices + rents 12–24 months out; constrained supply supports both.
Investment metrics
- 1% rule
- 1.51% ✓
- Cap rate
- 12.29%
- Cash-on-cash
- 21.43%
- DSCR
- 1.95
- GRM
- 5.5
CMA / ARV
- ARV (median comp)
- $115,025
- List price
- $65,000
- Delta
- -43.49%
- Verdict
- UNDERPRICED
- Comps
- 1 within 2.0 mi
Projected returns pro-forma
3.0% appreciation · 3.0% rent growth · sell at horizon
- IRR
- 27.7%
- Equity multiple
- 2.57×
- Total profit
- $28,549
- Equity at exit
- $29,227
- IRR
- 28.3%
- Equity multiple
- 4.99×
- Total profit
- $72,647
- Equity at exit
- $45,042
Cash invested: $18,200 (down + closing). Projections, not guarantees.
Landlord ↔ Tenant lean methodology
- Overall (STATE)
- 83 Strongly Landlord-Friendly
- State South Dakota
- 83 Strongly Landlord-Friendly · R+16
- County
- — inherits STATE
- City
- — inherits STATE
ZIP-level market 57450
- Active inventory
- 3
- Price-to-rent
- 5.5×
Monthly cashflow live
- Estimated rent
- $980 medium interval (Pro) →
- Mortgage (P&I)
- −$341
- Tax est. 1.5%
- −$81 /mo · $975/yr
- Insurance
- −$27
- HOA
- −$0
- Vacancy / Maint / Mgmt
- −$206
- Net cashflow
- $325
Break-even live
UW: 25.0% down · 7.5% · 30yr · 1.5% tax · 5.0% vac · 8.0% maint · 8.0% mgmt
Financing live
Cash to close
- Down payment
- $16,250
- Closing costs
- $1,950
- Reserves months
- —
- Total cash needed
- —
Loan-product check · same deal, 3 products live
Conventional
25% down · 7.5% · 30yr
- Down + closing
- —
- Monthly P&I
- —
- Monthly cashflow
- —
- DSCR
- —
- Eligible?
- —
Personal DTI + credit; lowest rate.
DSCR
20% down · 8.5% · 30yr
- Down + closing
- —
- Monthly P&I
- —
- Monthly cashflow
- —
- DSCR
- —
- Eligible?
- —
No personal income docs; deal must DSCR.
Hard money
10% down · 12.0% · 12mo
- Down + closing
- —
- Monthly P&I
- —
- Monthly cashflow
- —
- DSCR
- —
- Eligible?
- —
Short-term bridge; refi at stabilization.
Listing history 19 events
-
2026-06-19days on market $65,000 Active 146 DOM
-
2026-06-18days on market $65,000 Active 145 DOM
-
2026-06-17days on market $65,000 Active 144 DOM
-
2026-06-16days on market $65,000 Active 143 DOM
-
2026-06-15days on market $65,000 Active 142 DOM
-
2026-06-14days on market $65,000 Active 140 DOM
-
2026-06-12days on market $65,000 Active 139 DOM
-
2026-06-09days on market $65,000 Active 136 DOM
-
2026-06-08days on market $65,000 Active 135 DOM
-
2026-06-07days on market $65,000 Active 134 DOM
-
2026-06-05days on market $65,000 Active 132 DOM
-
2026-06-04days on market $65,000 Active 130 DOM
-
2026-06-02days on market $65,000 Active 129 DOM
-
2026-06-01days on market $65,000 Active 128 DOM
-
2026-05-31days on market $65,000 Active 127 DOM
-
2026-05-31days on market $65,000 Active 126 DOM
-
2026-01-23$65,000 Active 336-char remark
Show marketing remark (336 chars)
This 1 bed, 1 bath home offers 2 additional rooms that could be used as bedrooms with some work. The property needs some TLC but has potential as a great home, hunting retreat, or investment property. The large attached garage is wired for a heater per seller. There is also a large cement pad included on the NW corner of the property.
-
2025-04-23$75,000 Active
-
2024-04-08$70,000 Active
ⓘ Source: listings_history table (triggers on properties + properties_extension) + one-shot
backfill from property_details.listing_events for pre-trigger history.
Nearby sold comps map
Loading sold comps map…
Walkable amenities ~0.75 mi
Loading nearby amenities…
Taxation est. · year 1
- Rental income
- $11,761
- − Mortgage interest
- −$3,641
- − Property taxes
- −$975
- − Insurance
- −$325
- − Repairs & maintenance
- −$941
- − Management
- −$941
- − Depreciation
- −$1,891
- Taxable income
- $3,047
- Est. tax owed @ 24.0%
- −$731
- After-tax cash flow
- $3,170/yr
For passive investors: Depreciation is non-cash, so a rental often shows a tax loss while cash-flowing — sheltering income. Rental losses are passive: they offset passive income freely, and up to $25,000/yr can offset ordinary (W-2) income if you actively participate and your MAGI is under $100k (phasing out to $0 by $150k); unused losses carry forward. On sale, claimed depreciation is recaptured at up to 25%, and gains may owe capital-gains tax (a 1031 exchange can defer both). Figures are a year-1 estimate at your 24.0% rate — not tax advice; consult a CPA.
Condition & rehab AI · 12 photos
This manufactured home requires moderate repairs and updates to improve its condition and value. Painting interior walls and replacing carpet with hardwood would significantly enhance its curb appeal and increase its resale and rental value.
Repairs flagged
- Minor kitchen cabinets — slight wear
- Minor bathroom cabinets — slight wear
- Moderate exterior siding — gray siding
- Moderate interior walls — wallpaper, wood paneling
- Moderate flooring — carpeted floors
Value-add opportunities
- Both paint interior walls — enhances curb appeal and interior aesthetics
- Both replace carpet with hardwood — increases both resale and rental value
- Both update kitchen cabinets — modernizes kitchen and increases value
- Both update bathroom cabinets — modernizes bathroom and increases value
Renovation cost estimate screening
| Repair item | Severity | Est. cost |
|---|---|---|
| kitchen cabinets · slight wear | Minor | $500–3,000 |
| bathroom cabinets · slight wear | Minor | $500–3,000 |
| exterior siding · gray siding | Moderate | $3,000–15,000 |
| interior walls · wallpaper, wood paneling | Moderate | $3,000–15,000 |
| flooring · carpeted floors | Moderate | $3,000–15,000 |
| Total estimated repair cost · 5 items | $10,000–51,000 |
Value-add ROI direction
- Both paint interior walls — enhances curb appeal and interior aesthetics ↑
- Both replace carpet with hardwood — increases both resale and rental value ↑
- Both update kitchen cabinets — modernizes kitchen and increases value ↑
- Both update bathroom cabinets — modernizes bathroom and increases value ↑
ⓘ Cost ranges are severity-bucket heuristics (US national rule-of-thumb). Get contractor quotes + a written scope before underwriting a rehab budget.
Schools (NCES district)
- District
- Hoven School District 53-2
- NCES district ID
- 4634600
- Math proficiency
- 40% ▬ 0.00%
- Reading proficiency
- 60% ▲ 10.00%
- Median HH income
- $41,824
- Composite
- 43.98/100
- National rank
- #6269
- State rank
- #76 of 148 in SD
Livability — Hoven
- Score
- 64/100
- State rank
- #168
- US rank
- #14372
Category grades
Schools grade is shown separately in the Schools card above.
Census & demographics
- Census place
- Hoven, SD
- Population (ZIP)
- 605
Population outlook (Potter County) Hauer SSP2
- Today (2025)
- 2,235 people
- By 2030
- 2,208 · -1.2%
- By 2040
- 2,203 · -1.4%
- By 2050
- 2,266 · +1.4%
- By 2075
- 2,920 · +30.6%
- By 2100
- 3,427 · +53.3%
Race, ethnicity, and origin ACS 2023
- Neighborhood character
- Predominantly White (100%)
- Race & ethnicity
- White 100%
- Common ancestry
- Romanian 6% Lithuanian 3% Serbian 1%
- Foreign-born
- 0%
Political lean MEDSL · Potter
- 2024 margin
- Solid R (+65.1) · D 16.5% · R 81.6% · Other 1.9%
- 2008→2024 swing
- -33.5pp toward R · 2008: -31.6pp · 2024: -65.1pp
- All cycles
- 2024: R+65.1 2020: R+66.1 2016: R+64.0 2012: R+50.0 2008: R+31.6
Not yet ingested
- Civics
- —
Market trends
- HPI YoY
- —
- Current HPI
- —
- Rent YoY
- —
- Metro
- —
- State GDP YoY
- ▲ 0.70%
- F500 in state
- 2
Industry mix (Fortune 500 HQ in SD)
| Industry | F500 HQs | Revenue |
|---|---|---|
| Utilities | 1 | $1B |
|
||
Price history
-7.1% since first listed3 events — show timeline
- 2026-01-23 Listed $65,000 ABOR
- 2025-04-23 Listed $75,000 ABOR
- 2024-04-08 Listed $70,000 ABOR
Cash-flow waterfall
monthlySold comps — $/sqft
last 12 mo · ≤1 miLoading sold comps…